
3.5 Official Statistics
Despite knowing that crime goes unreported, it is still important to estimate and attempt to measure crime in the country. However, it is essential to be aware of the data sources’ strengths and weaknesses when reading crime statistics. Also, be cautious of how changing data collection techniques may alter statistics.
Reading Data Right: Crime Reporting Statistics
In the past, crime reporting relied on paper-based systems. Citizens were required to report crimes in person or by phone to the police station. These reports were then manually recorded in a database, which was time-consuming and could result in errors or missing data.
With the advent of digital technology, many police departments transitioned to online crime reporting systems, where citizens can report crimes through a website. This has made it easier and more convenient for citizens to report crimes, resulting in a significant increase in the number of reported crimes.
As a result of this change in data collection technique, crime statistics may appear to show a sudden increase in crime rates in the area, even if the actual rate of criminal activity has remained relatively constant. In some cases, the increase in reported crimes may also be attributed to an increase in public awareness and willingness to report crimes rather than an actual increase in criminal activity.
Thus, it is important to consider the impact of changes in data collection techniques on statistical analysis and interpretation and to adjust the analysis accordingly to account for these changes. Failure to do so may lead to misleading conclusions and inaccurate policy decisions.
Official statistics are gathered from various criminal justice agencies, such as the police and courts. Therefore, these statistics represent the total number of crimes officially reported to the police or the number of arrests made by that police agency. If an officer uses discretion and does not arrest a person, even if a crime was committed, the crime does not get reported.
The Federal Bureau of Investigation’s (FBI) Uniform Crime Reporting (UCR) Program is the largest and most well-recognized data collection program on crime currently available. The UCR lists the number of crimes that were reported to the police and the number of arrests made.
The UCR Program’s primary objective is to generate reliable information for use in law enforcement administration, operation, and management. Various groups and agencies rely upon the UCR crime data, including criminal justice students, researchers, the media, and members of the public (“Crime/Law Enforcement Stats” (UCR Program), 2023). The UCR began in 1929 by the International Association of Chiefs of Police to meet the need for reliable, uniform crime statistics for the nation. In 1930, the FBI was tasked with collecting, publishing, and archiving those statistics. Every year, reports were produced from data received from more than 18,000 reporting agencies, including cities, counties, universities, and colleges. Also included are state, tribal, and federal law enforcement agencies voluntarily participating in the program to share their crime data (“Crime/Law Enforcement Stats” (UCR Program), 2023).
The UCR Program contains data from four collections: the National Incident-Based Reporting System (NIBRS), the Summary Reporting System (SRS), the Law Enforcement Officers Killed and Assaulted (LEOKA) Program, and the Hate Crime Statistics Program. The UCR also publishes special reports on cargo theft, human trafficking, and NIBRS topical studies. In 2020, UCR data began being published in the FBI’s Crime Data Explorer (CDE), an interactive online tool containing data from the four collections as well as additional data, including the National Use-of-Force Data Collection.
Check out the FBI’s Uniform Crime Reporting Program— FBI [Website] and Crime Data Explorer [Website] to learn more.
National Incident-Based Reporting System, or NIBRS
The National Incident-Based Reporting System, or NIBRS, was created to improve the overall quality of crime data collected by law enforcement. NIBRS is unique when compared to other crime databases. It collects data on crimes reported to the police, but also incidents where multiple crimes are committed. For example, when a robbery escalates into a rape (Rantala, 2000). NIBRS also collects information on victims, known offenders, relationships between victims and offenders, arrestees, and property involved in the crimes.
Summary Reporting System
The Summary Reporting System or SRS collected aggregate counts of the number of occurrences of offenses as well as arrest data for those offenses (“UCR Technical Specifications, User Manuals, and Data Tools,” 2022). The Summary Reporting System (SRS) compiled summary data, providing a general overview of crime trends. It collected information on the most serious offenses reported by law enforcement agencies within a specific time period, focusing on counts and basic details. SRS switched over to NIBRS in 2021.
NIBRS as the Standard
Beginning in January 2021, the Federal Bureau of Investigation (FBI) implemented the National Incident-Based Reporting System (NIBRS) as the national standard for law enforcement crime data reporting in the United States. This transition marked a significant advancement in the methods used by the federal government to measure and estimate reported crime (Bureau of Justice Statistics, 2024).
Key Features of NIBRS
NIBRS collects detailed information about criminal incidents, which includes:
- A wide range of offenses
- Types and amounts of property lost
Measuring Crime with NIBRS Data
The year 2021 was notable as it marked the first time the FBI and the Bureau of Justice Statistics (BJS) estimated reported crime in the United States using NIBRS data. These annual crime estimates are based on information submitted by state and local law enforcement agencies that are certified to report data to the FBI (Bureau of Justice Statistics, 2024).
.
Current NIBRS Reporting Status (as of May 2024)
- All 50 states and the District of Columbia are now certified to report crime data to NIBRS.
- Approximately 82% of the U.S. population is served by law enforcement agencies that report data to NIBRS.
- Out of the 154 police agencies that serve cities and counties with populations of 250,000 or more, 125 are actively reporting to NIBRS, covering a total population of over 76.7 million people.
This comprehensive approach allows for more accurate and detailed crime statistics, which can aid in understanding and addressing crime in communities across the country (Bureau of Justice Statistics, 2024).
Law Enforcement Officers Killed and Assaulted (LEOKA) Program
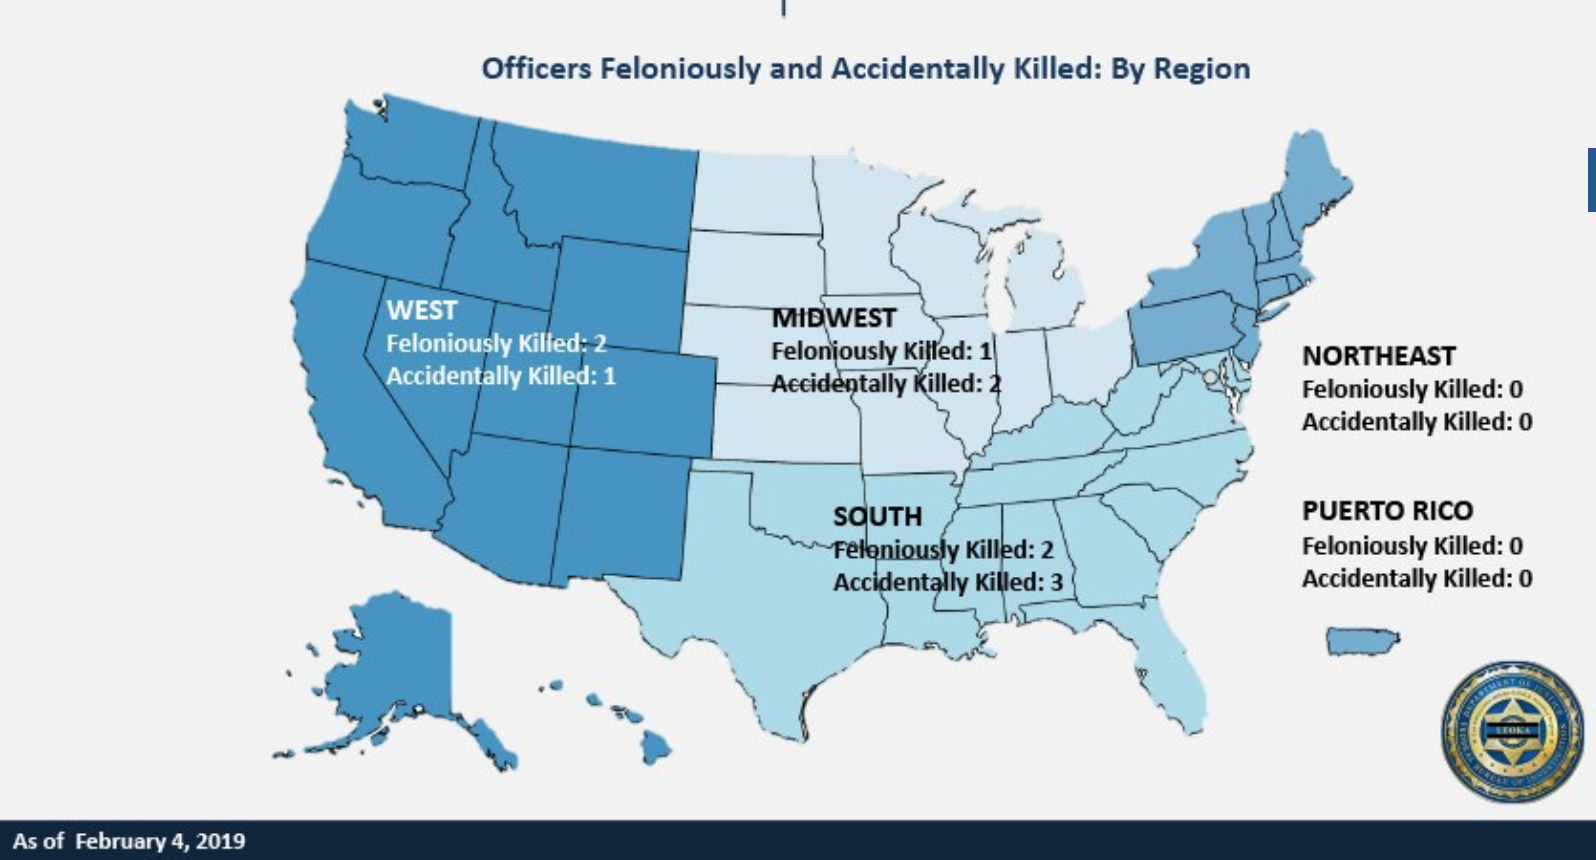
Law Enforcement Officers Killed and Assaulted Program (LEOKA) provides data and training that helps keep law enforcement officers safe by providing relevant, high-quality, potentially lifesaving information to law enforcement agencies. These agencies may often be focusing more on why an incident occurred as opposed to what occurred during the incident. The purpose of LEOKA is to prevent future incidents of officer killings and assaults through officer safety awareness training (LEOKA, 2022). In 2019, the FBI published figure 3.2 based on the data submitted to LEOKA related to officers killed through felonious and accidental incidents.
Exclusions from the LEOKA Program’s Data Collection
Deaths resulting from the following are not included in the LEOKA program’s statistics:
- Natural causes such as heart attack, stroke, aneurysm, etc.
- On duty, but death is attributed to their own personal situation, such as domestic violence, neighbor conflict, etc.
- Suicide
Examples of job positions not typically included in the LEOKA program’s statistics (unless they meet the above exception) follow:
- Corrections/correctional officers
- Bailiffs
- Parole/probation officers
- Federal judges
- The U.S. and assistant U.S. attorneys
- Bureau of Prison officers
- Private security officers
If we look only at the LEOKA data in figure 3.2, we might make incorrect assumptions about the number of law enforcement officers killed in the line of duty in our country each year. Although improvements in technology, gear, and procedures have made the career of law enforcement safer, the LEOKA data suggests it is not as safe as previously thought. For instance, in 2019, when we include all types of line-of-duty deaths from all types of law enforcement agencies, we see that 170 officers were killed doing their job in 2019 alone (Officer Down Memorial Page, 2024). More accurate data for line-of-duty police deaths in 2019 can be found at the Officer Down Memorial Page [Website]. Feel free to take a look if you would like to learn more. The website was started by a college student in 1996 and today has grown to the largest law enforcement memorial in the country, tracking data on all line-of-duty deaths under federal law, not just those officers killed under felonious circumstances (Officer Down Memorial Page, 2024).
Although official statistics are a great starting point, recognize that they are imperfect in nature. Police agencies can focus on different types of crime, which can change the overall number of arrests. For example, if police begin cracking down on domestic violence, the statistics may go up. This crackdown can make it appear that the problem has increased, but it could be related to increased enforcement. Just remember, if the crime is not reported or no arrest is made, it will not get captured in the data.
Hate Crime Statistics
Congress passed the Hate Crime Statistics Act in 1990. This act required the attorney general to collect data “about crimes that manifest evidence of prejudice based on race, religion, sexual orientation, or ethnicity.” Hate crime statistics may assist law enforcement agencies, provide lawmakers with justification for certain legislation, or provide the media with credible information. They can also simply show hate crime victims that they are not alone (“About Hate Crime Statistics,” 2019).
FBI UCR Program’s Hate Crime Data Collection
Race/Ethnicity/Ancestry:
- Anti-American Indian or Alaska Native
- Anti-Arab
- Anti-Asian
- Anti-Black or African American
- Anti-Hispanic or Latino
- Anti-Multiple Races, Group
- Anti-Native Hawaiian or Other Pacific Islander
- Anti-Other Race/Ethnicity/Ancestry
- Anti-White
Religion:
- Anti-Buddhist
- Anti-Catholic
- Anti-Eastern Orthodox (Russian, Greek, Other)
- Anti-Hindu
- Anti-Islamic
- Anti-Jehovah’s Witness
- Anti-Jewish
- Anti-Mormon
- Anti-Multiple Religions, Group
- Anti-Other Christian
- Anti-Other Religion
- Anti-Protestant
- Anti-Sikh
- Anti-Atheism/Agnosticism, etc.
Sexual Orientation:
- Anti-Bisexual
- Anti-Gay (Male)
- Anti-Heterosexual
- Anti-Lesbian
- Anti-Lesbian, Gay, Bisexual, or Transgender (Mixed Group)
Disability:
- Anti-Mental Disability
- Anti-Physical Disability
Gender:
- Anti-Male
- Anti-Female
Gender Identity:
- Anti-Transgender
- Anti-Gender Non-Conforming
Types of Hate Crimes by Category (Box)
The types of hate crimes reported to the FBI are broken down into specific categories. The aggregate hate crime data collected for each incident includes the following:
- Bias Motivation: Incidents may include one or more offense types.
- Victims: The types of victims collected for hate crime incidents include individuals (adults and juveniles), businesses, institutions, and society.
- Offenders: The number of offenders (adults and juveniles), and when possible, the race and ethnicity of the offender(s).
- Location type: One of 46 location types can be designated, such as a house of worship, sidewalk, home, school, etc.
- Jurisdiction: Includes data about hate crimes by judicial district, state, and agency.
National Use-of-Force Data Collection
The FBI created the National Use-of-Force Data Collection in 2015 and began collecting data in 2019 to provide statistics on law enforcement use-of-force incidents. The data collected includes information about the circumstances of the use-of-force incident, the subject(s), and the officer(s) involved, offering big-picture insights into the incidents (Use-of-Force, 2022).
Activity: Bureau of Justice Statistics
The Bureau of Justice Statistics (BJS) is relatively user-friendly. Look at crime statistics by state, region, or city, and explore different years and crime types in the Arrest Data Analysis Tool [Website].
- Examine current state AND city crime trends in the past five years.
- Second, pick a state AND city you are interested in living in and examine the crime trends for the past five years.
One downside to the FBI’s data collection program is that it is only as good as the data it receives. Because much of the data collected is voluntarily provided by law enforcement agencies, there are many missing pieces. Collecting data on crime involves gathering all relevant information to understand what’s happening in an area. However, there are some challenges. For instance, there’s not enough teamwork between the local community and university leaders to make sure we gather the right data. Also, the people in charge of collecting data, like the FBI, haven’t been very proactive in helping these community leaders work together. This lack of collaboration makes it harder to get accurate and useful information. Also, it takes a lot of time and resources to collect all this data, and it presents challenges to both staffing and funding.
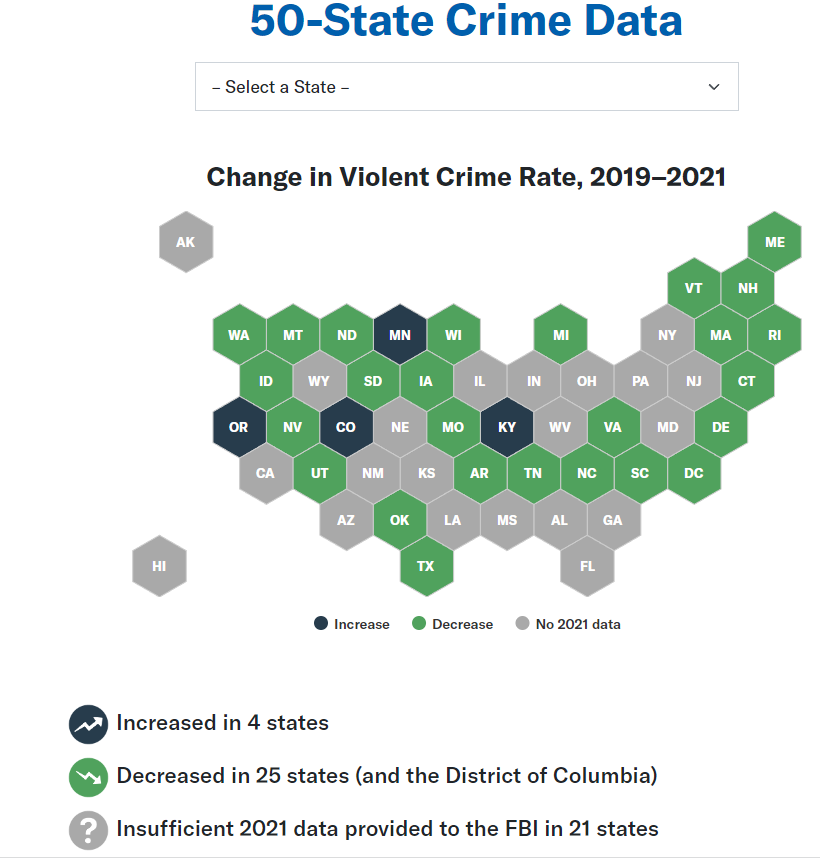
50-State Crime Data (Map)
Many Americans believe that crime in their area is constantly increasing, but is that really the case? The Council of States Justice Center has developed an interactive tool to help individuals track change in violent crime in their state. Explore the Crime Data Tool to learn more about how Crime rates in your state [Website].
Licenses and Attributions for Official Statistics
Open Content, Shared Previously
“Official Statistics” is adapted from “2.2. Official Statistics” by Shanell Sanchez in SOU-CCJ230 Introduction to the American Criminal Justice System by Alison S. Burke, David Carter, Brian Fedorek, Tiffany Morey, Lore Rutz-Burri, and Shanell Sanchez, licensed under CC BY-NC-SA 4.0. Modifications by Sam Arungwa, licensed CC BY-NC-SA 4.0, for style, consistency, recency, brevity, and DEI content. Revised by Roxie Supplee, licensed CC BY-NC-SA 4.0, for clarity, original ODMP content, and corrections.
Figure 3.2. Officers Feloniously and Accidentally Killed by Region 2019 by the Federal Bureau of Investigation is in the Public Domain.
Figure 3.3. Tools for States to Address Crime in Your State by CSG Justice Center is in the Public Domain.
Reported statistics, self-report statistics, and victimization statistics that are reported to various official government criminal justice agencies, such as the police and courts.
A system of rules enforced through social institutions to govern behavior.
The release of a prisoner under supervision after serving a portion of their sentence.
A sentence that allows a convicted person to remain in the community under the supervision of a probation officer, instead of going to jail or prison.
A facility that houses people convicted of serious crimes and sentenced to long terms of incarceration.
The authority of a court to hear and decide a case.
