
9.5 Current Issues and Crime Problems in Corrections
In this section, we review some of the contemporary issues occurring in our American jails, prisons, and community corrections. Our decision to incarcerate on a large scale as a solution to many issues does have significant impacts. These impacts affect not only the individuals in the justice system but also community members as a whole. These issues include overcrowding, gangs, aging incarcerated individuals, and substance abuse. This section will report some of the more pervasive issues facing corrections today.
Mass Incarceration
The section on punishment started with a discussion about feeling safe and secure in our homes. Feeling safe and secure in person and at home is arguably one of the most discussed feelings in our nation today. Our fear of crime influences how we think and act day to day. This has caused great fluctuation in the United States in regard to how we punish people who are convicted of violating the law.
In part, punishment comes from the will of the people, which is then carried out by the legislative process, and converted into sentencing practices. However, has our desire to feel safe and secure been taken too far by policy? And, have these policies created even bigger problems for us as community members? This final section on corrections attempts to answer what the United States is doing to solve our corrections crisis related to mass incarceration, which is defined as the reality that the United States incarcerates more people than any other country in the world.
Here is a comparison of the United States prison systems to other countries around the world. As seen in figure 9.13, America uses punishment fairly well. One could argue that we are the best at it.

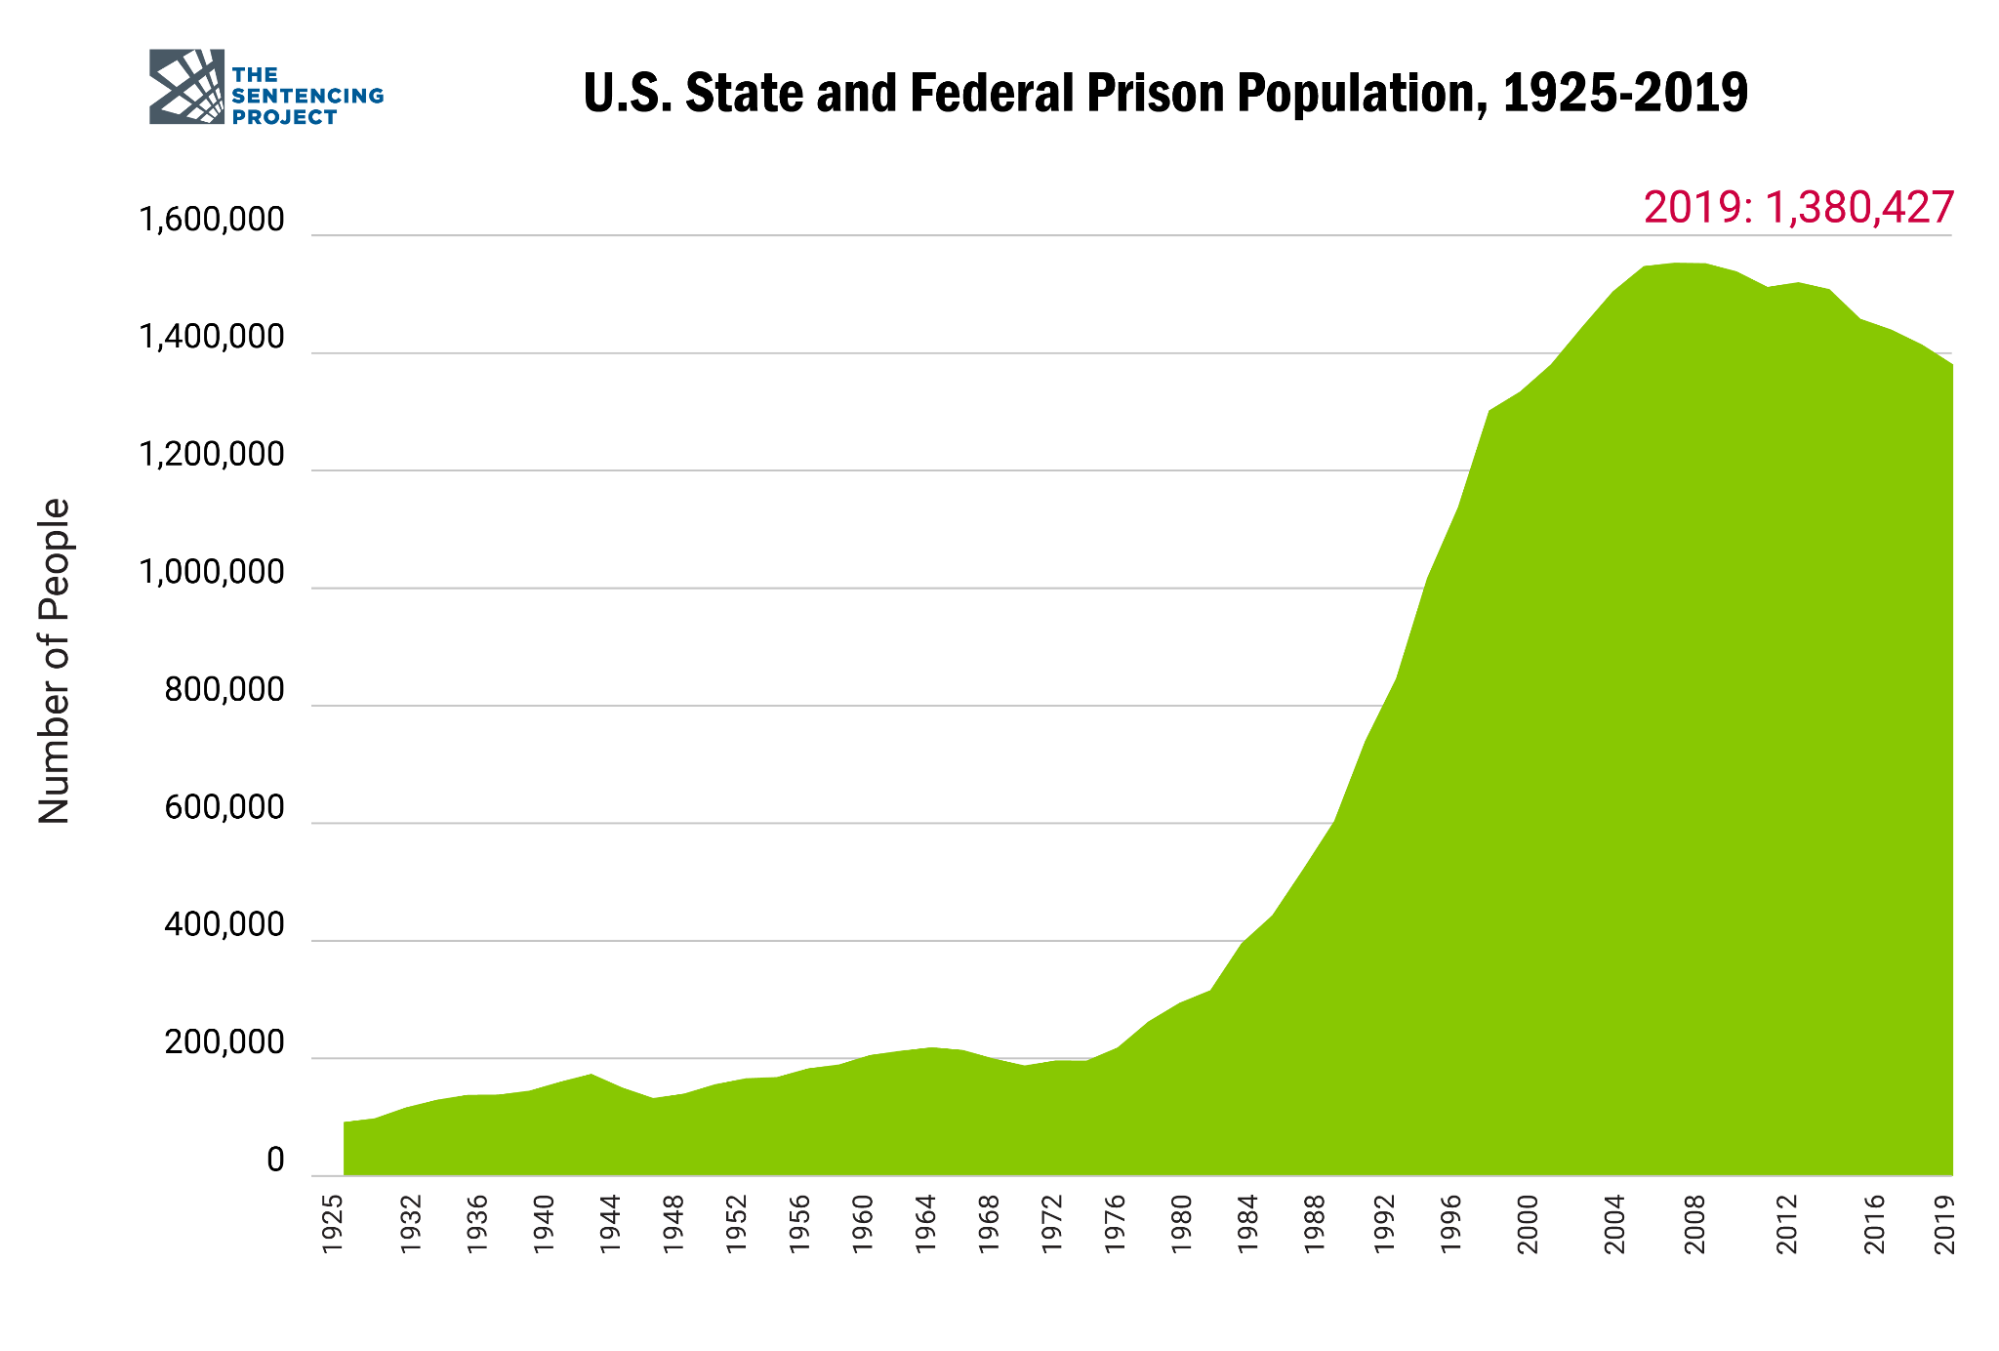
The United States wasn’t always this punitive. As we have discussed, with the context of the eras we have moved through, our underlying philosophy of punishment has constantly evolved, even if it has been rather slow at times. Unfortunately, in the 1970s, there was a confluence of events that began us on a path of incarcerating many types of individuals, more so than we had done in the past. This path of increased imprisonment has had lasting effects. Below, you can see in figure 9.14 when the expansion of the correctional system began.
The United States had just gone through a large-scale amount of civil unrest, which led to a civil rights movement among many Americans. As a country, we were dissatisfied with the treatment of subpopulations, and it was during this period that many positive changes were adopted into law. This also corresponded with a massive influx of men returning from the Vietnam War. The disapproval of the war heightened our growing distrust that the government would provide programs to help individuals within the justice system. Many state-funded operations were seen as intrusive by the public, including mental health facilities. There was also a large-scale importation of drugs occurring in America.
All of these items shifted our ideology rather abruptly in the United States, and we turned toward a more punitive approach. We would consider this the “get tough on crime era.” This included the war on drugs (gang involvement), tougher sentencing legislation across the country, trans-institutionalization or trans-incarceration (the removal of many individuals from state mental health hospitals), and others. Collectively, these all had a large-scale increase in the prison population.
War on Drugs and Gangs
The war on drugs, initiated by President Nixon in 1971, was framed as an all-out war to eradicate drugs in the United States. The massive expenditures toward the ending of the drug epidemic also shifted our views on drug use. We became much more punitive towards drugs, treating it as more of a criminal justice issue rather than as a substance dependence issue. Good or bad, drug use was demonized in the public and media, which aided in the development of much tougher sanctions on drug use in America. The Drug Enforcement Agency was created in 1973 to provide another arm of the government to tackle the specific issue of drugs. By the 1980s, lengthy sentences for drug possession were also in place. One to five-year sentences for possession were increased to upwards of 25 years. There was also an increased focus on gangs, which were held responsible for the majority of the drug trade in the United States.
Gang activity in the United States was prevalent long before the enactment of the War on Drugs. However, once the linkage between our fear of crime and the drug trade by gangs became more pronounced due to the war on drugs, the conflict escalated. While there are hundreds of different gangs in many neighborhoods and communities in the United States today, gangs in prison have converged into four main gangs, or what corrections call security threat groups (STGs). These four basic gangs include the Whites, the Blacks, the Southerners (Sureños, or EME), and the Northerners (Norteños). Not only are these STGs considered violent inside and outside of prison, but they are also actively involved in the continuing drug trade in the United States today, even behind bars. Many of the leaders of all gangs on the streets are held in one prison in California, at Pelican Bay State Prison.
Within the prisons in the United States, gangs actively recruit members, communicate with gangs on the streets, run the drug trade, and are also at war with each other over the power within the institutions from their perspective. There have been numerous documentaries on gangs in the United States and even mainstream films about gangs and gang life, both inside and out. A few notable examples of films to watch on this subject include Felon (2008) [Website], Shot Caller (2017) [Website], and American Me (1992) [Website].
Get Tough Policies
Another reason for the large-scale increases can be found in our changes to policies surrounding sentences and sentence lengths. Get-tough policies flourished in the latter half of the 1980s and 1990s. This included truth in sentencing legislation, three-strikes policies, and drug crime minimums. Truth in sentencing, also known as the 85 percent rule, is a policy that requires incarcerated individuals to serve at least 85 percent of their mandatory sentence minimum. If an individual was sentenced to prison, a mandatory minimum of 85 percent of the sentence would have to be served before the individual was eligible for release (parole). This added to the average length of sentences served in American prisons, which meant that individuals were not being released as early as in prior years. As more individuals were incarcerated due to increases in other legislation, more people were already in prisons.
Three-strikes policies were also enacted in many states. In 1993, Washington overwhelmingly passed (75 percent voted yes) to approve Initiative 593 (Wright, 1995). This policy increased sentence lengths for 40 felonies, which included life imprisonment. Perhaps the largest three-strikes policy was in 1994, in California, with Proposition 184, commonly called the “Three Strikes and You’re Out” policy. It mandated a minimum of 25 years of prison for individuals committing three specific felonies. What made this policy more pervasive than others was how it could be applied. If a person had two previous strikes for violent or serious felonies (not necessarily violent), any new felony was life imprisonment, with a minimum of 25 years. For a more detailed view of this policy, see A Primer: Three Strikes: The Impact After More Than a Decade [Website].
Drug laws were also changing at this time. The Controlled Substances Import and Export Act (1970) started the increases for drugs in the United States under federally mandated minimums found within the federal code 21 U.S.C. § 841. For a detailed report of these minimums, see Mandatory Minimum Penalties for Drug Offenses in the Federal Criminal Justice System [PDF].
One of the most debated issues within the drug sentencing laws was the differential between cocaine (in powder form) and crack (a form of cocaine, diluted and in a hardened paste form). During the increases in sentencing, there was a disparity in the lengths of sentences for comparable weights of these two drugs. There has been much debate about whether this targeted poorer individuals more harshly, as crack was seen as a poor man’s cocaine. However, with additional mandatory minimum increases in the 1980s, differences in sentence lengths began to widen. In a detailed report, Barbara Meierhoefer detailed how the average sentence lengths for African Americans, for similar weights of crack v. cocaine for White people, was roughly 50 percent higher, supporting this assertion that drug sentences were not equal (1992).
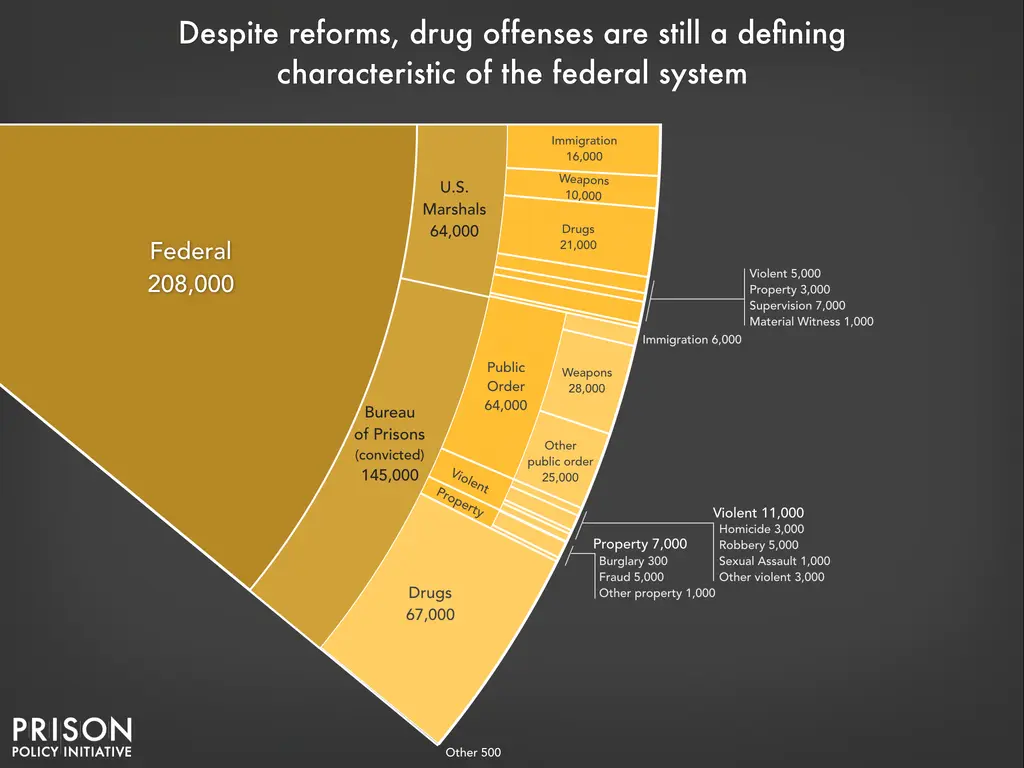
With over a million arrests per year for drugs, it adds to the prison system. While the proportion of individuals with drug offenses in state prisons hovers around 20–25 percent, it is much larger at the federal level. As seen in figure 9.15, it makes up over half of the federal prisons. In all, the drug seriousness went up (how drugs are scheduled within federal guidelines), and sentence lengths for drugs went up; certain drugs more than others also went up.
Some states are starting to address lower-level drug issues to help curb them from entering the justice system. It is important to find a balance between treatment and enforcement. In Oregon, Measure 110 was passed in November 2020. Tagged “drug decriminalization,” the measure allowed for individuals who have personal-use amounts of illegal substances not to be charged criminally with a misdemeanor drug possession charge as they would have previously. Instead, law enforcement officers can choose to impose a violation fine, which can be waived if the individual participates in a substance abuse assessment.
Just over three years later, in February of 2024, the Oregon Legislature is in the process of passing a bill to undo the voter-passed Measure 110 (Botkin, 2024). This is in response to the rise in Oregon overdose deaths, which increased 41%, compared to a 16% increase nationwide (Korthuis, 2022). Check out the National Center for Health Statistics [Website] if you would like to learn more. A bill has been crafted through collaboration between Democrats and Republicans in response to Oregon’s public health crisis (Korthuis, 2022). This bill, which has the backing of law enforcement and various business groups, aims to address the pressing needs of the community. The bill seeks to reverse a significant component of Measure 110, which had decriminalized the possession of small amounts of hard drugs and introduced a system of $100 citations that could be avoided with a health assessment. However, law enforcement officials have indicated that this citation system was not effective in encouraging people to seek treatment. Public surveys have also shown that a majority of Oregonians support the repeal of Measure 110 or certain parts of it.
Aging
One of the side effects of lengthier sentences is that the individuals in prison grow older. Thus, the number of individuals in prison over 55 years old has dramatically increased. As McKillop and Boucher relate in figure 9.16, based on BJS data, there has been a 280 percent increase in individuals aged 55 and older (2018).
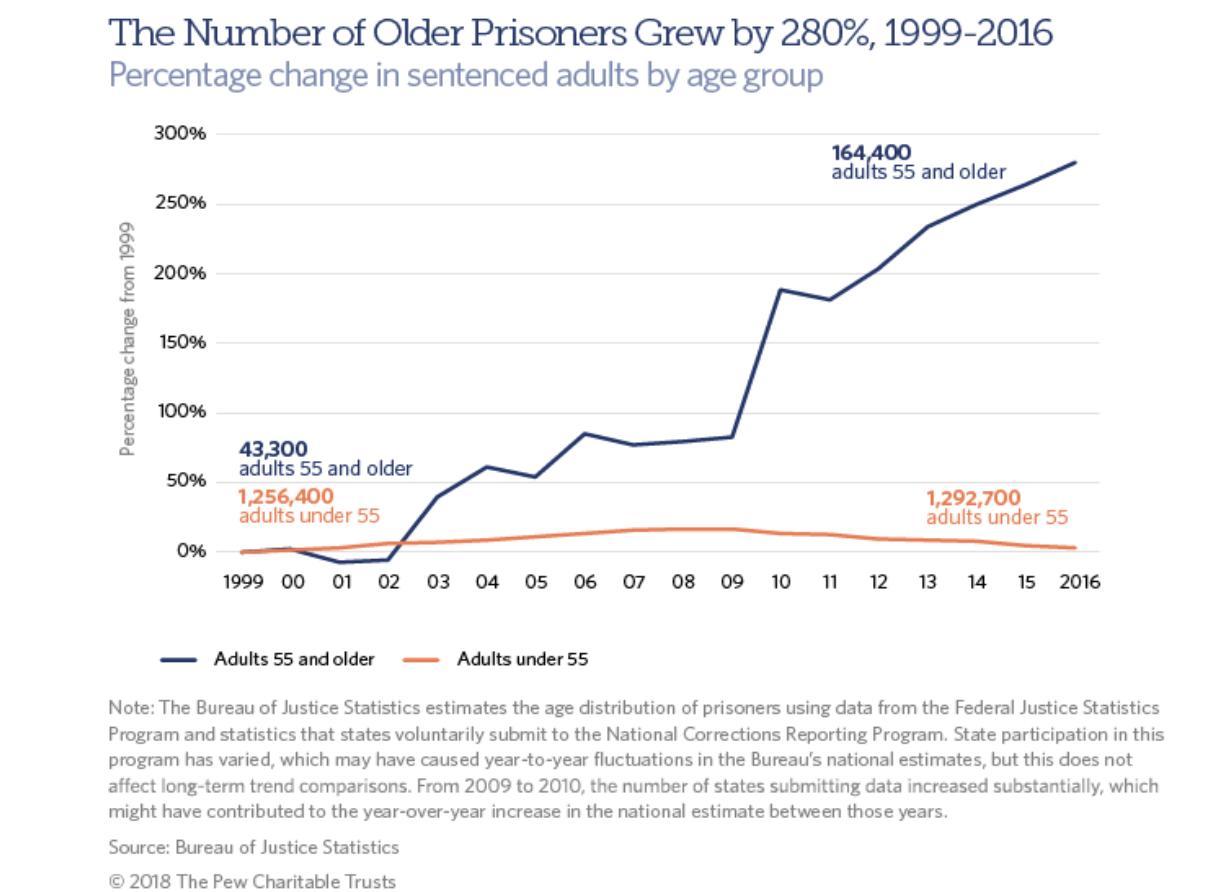
Optionally, you may visit Aging Prison Populations Drive Up Costs [Website], which shows that there is a growing cost within this subpopulation. McKillop and Boucher relay that the cost of this group of individuals can be upwards of three times the cost of the normal incarcerated individual, roughly 30k to 100k per individual (Jone, 2018).
Beyond just the cost of incarcerated individuals, a more philosophical question has arisen in regard to how to treat them as they enter their last phase in life. Some have advocated for compassionate releases for individuals entering hospice care or requiring assisted living conditions. Others articulate that this is unfair to put the burden on the aging individual, as they have been incarcerated for long periods of time and have few self-support options available. You may learn more in a powerful documentary on this matter. Edgar Barens details these issues in the film The Prison Terminal (2013) [Website].
Mental Health
The incarceration of those struggling with mental health illnesses has also been on the rise. With the few remaining state-run mental health facilities maxed for resources and many communities struggling to provide anything but emergency room crisis beds for those with mental health issues, many battling mental health issues have found their way into the justice system. Graves noted in a report published by the California Budget & Policy Center in March of 2020 that “more than one-quarter of people incarcerated at the state level in California receive mental health care” (figure 9.17).
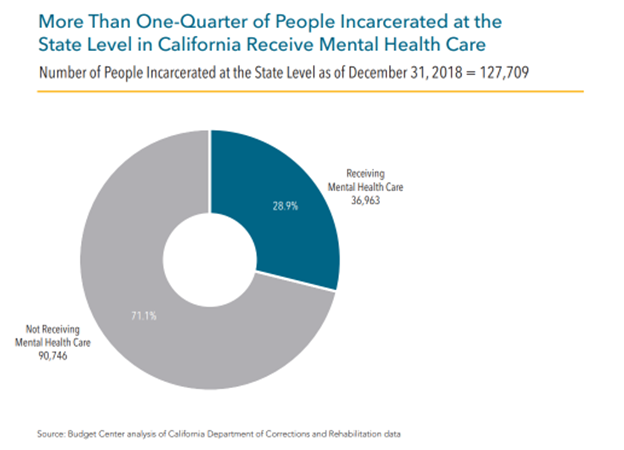
The report also went on to state that three in 10 people incarcerated in Los Angeles County Jails received treatment for mental illness, meaning they were housed in a mental health unit and/or prescribed psychotropic medication (Graves, 2021). More recent preliminary studies across the nation suggest these numbers to be even higher, especially after coming out of the COVID-19 pandemic. Another staggering statistic from the Bureau of Justice Statistics, Mortality in Local Jails, 2000–2018 [PDF] report is that suicide remains the single leading cause of death in local jails in 2018, accounting for almost 30 percent of deaths (Carson, 2021). Knowing that so many in our incarcerated populations are struggling with mental illness and that many are losing their lives to it, how are agencies responding?
Outside of prescribing psychotropic medications and housing them in special housing units, many facilities across the nation have added more mental health services within their walls. One of these additional resources is the introduction of Qualified Mental Health Professionals (QMHPs) or trained mental health providers working within these facilities to complete suicide risk assessments, provide brief counseling, and complete evaluations and referrals. Some QMHPs can also provide transitional services, partnering individuals with community resources upon their release from facilities. Another resource that has been incorporated within many agencies is the training of all staff on Crisis Intervention Teams (CIT). The intent of this training is to better educate staff on mental illness, break down the stigmas related to it, and address steps to intervene when someone is in crisis or demonstrating signs of mental health issues. To learn more about these teams and their role in Corrections, watch and download the Crisis Intervention Teams: An Effective Response to Mental Illness in Corrections [Website] via the Wayback Machine.
A report published by Disabilities Rights Oregon titled Four Years Later: Oregon Prison Overhauls Treatment of Inmates with Serious Mental Illness [PDF] outlines a four-year agreement with recommendations and changes that were identified as part of a partnership between the Oregon Department of Corrections (ODOC) and Disabilities Rights Oregon (DRO). The two groups signed a Memorandum of Understanding (MOU) with the goal of improving conditions within Oregon’s Maximum Security Prison’s Behavioral Health Unit (Townsend, 2021). Partnerships like these are ways agencies are actively working to make improvements. Check out the report to learn more.
Along with partnerships like the ODOC and DRO, many agencies are actively implementing mental health specialty courts and mental health community corrections teams with POs assigned to specific caseloads for those facing mental health diagnoses. Yet, even with all of these programs and partnerships, the justice system continues to be a place where those with mental health issues can get stuck. So, how is this fixed? What other options are out there to provide for those with mental health needs and yet still hold them accountable for their actions? Many think the justice system is not doing enough.
Reentry and the Future of Corrections
In order to take steps forward and address these issues we have been discussing, we have to look at how our reentry systems are working and understand, as the community that is being impacted, how we can move forward into the future.
Reentry and the Revolving Door
Parole has had mixed reviews. Overall, the effectiveness of parole hovers at around a 50 percent success rate. It is estimated that somewhere between 600,000 and 800,000 individuals are on parole in any given year over the last three decades. Additionally, several hundred thousand are exiting parole in each of these years. This brings up questions about what happens to these individuals. The reality is that most of them will be rearrested. In one of the more comprehensive studies on recidivism, Alper et al. (2018) discussed the recidivism rate of individuals tracked over a nine-year follow-up period. What they found was that rearrest occurred for about 70 percent in the first three years, and by year nine, 83 percent of the individuals released had been rearrested. Many of these individuals return to prison, hence the concept of the “revolving door” of justice.
For reentry programs to be more successful, individuals returning to society require assistance to get back on their feet and stay on their feet. This includes items such as education and training, employment assistance to get a job, legal services, education on public benefits, and housing assistance. Interestingly, many of the items here appear to be the same ones that led to deficits in their lives, which ultimately caused trouble for them (Alper et al., 2018). That is, many of these items are the same predictors of offending that were discussed in the first section (known as the known predictors of recidivism). Unfortunately, it appears that they are not receiving all of these while incarcerated. This creates a cycle of release and catch again.
Situations and circumstances that compound these problems for many who were previously incarcerated are the difficulties faced in trying to get a job once released. Over the last 20 years, there has been an overwhelming push to include items on employment applications that ask questions about prior incarceration history. Not only were there questions about prior incarcerations and prior convictions, but many employers included interview or job application questions about ever being arrested. If an individual told the truth (which is what they should do), the reality is that their applications would be discarded or overlooked for others without an arrest/conviction. If an individual who had been previously incarcerated lied about it, and it was discovered during a background investigation, the application would certainly be discarded.
In either scenario, it became increasingly difficult for an individual who had previously been incarcerated to obtain legitimate employment. In response to this issue, Oregon and other states have pursued legislation not to allow employers to ask applicants about their criminal history before the interview stage of hiring or, in some cases, until they are making a conditional job offer. Titled Oregon’s “ban the box” law, it is just one more example of where communities are seeing the impacts a criminal record can have on getting someone hired. To learn more about Oregon’s steps to get individuals hired, review the BOLI: Hiring discrimination and “Ban the Box”: For Workers: State of Oregon [Website].
Criminal records also have an adverse impact on apartment rental applications. Again, when individuals would put down prior arrests, their applications would often be placed at the bottom of the pile. If someone were to lie about it, and it was discovered, it could be used as grounds for not selecting an individual for tenancy. Once again, society was making it difficult for a person who was previously incarcerated to even function as a normal member of society based on a sentence that they had served, which is when the punishment should have ended. Collectively, these items are included in the concept of collateral consequences. That is, items that are barriers to successful integration are remnants of prior punishment.
Impacts
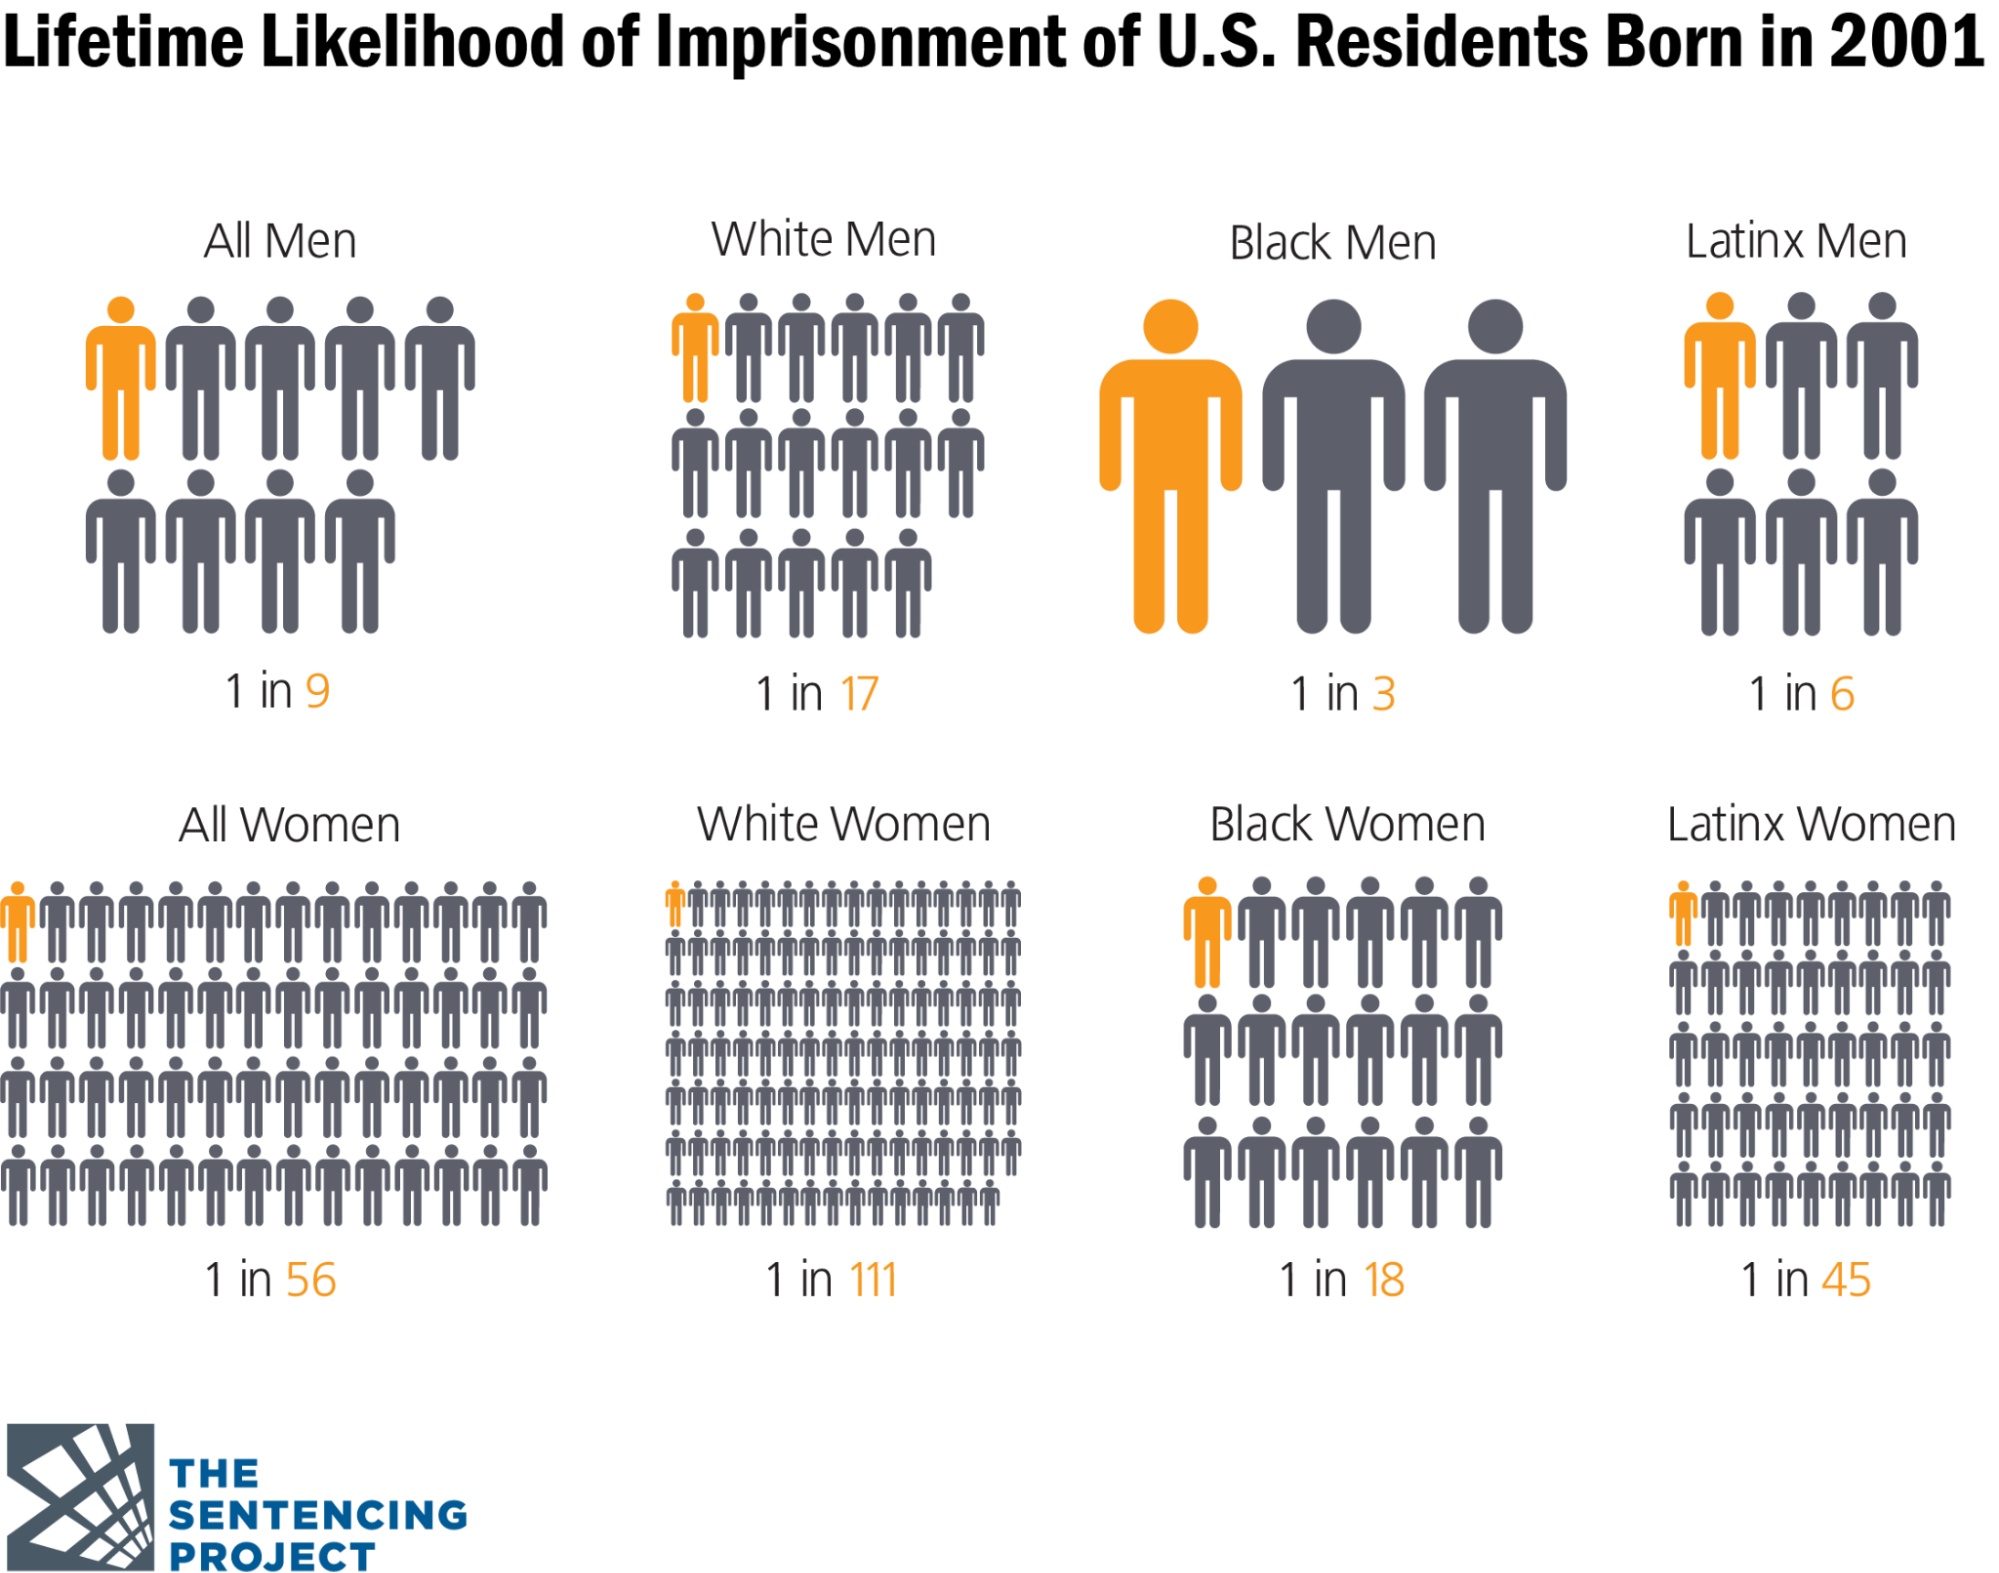
The statistics are clear: these changes and issues are having a disparate impact on our community, specifically our minority communities. Years of injustices and inequalities have been built into policies, and change has to happen. Looking at figure 9.18, you can see just a few of the disparities facing individuals in our communities.
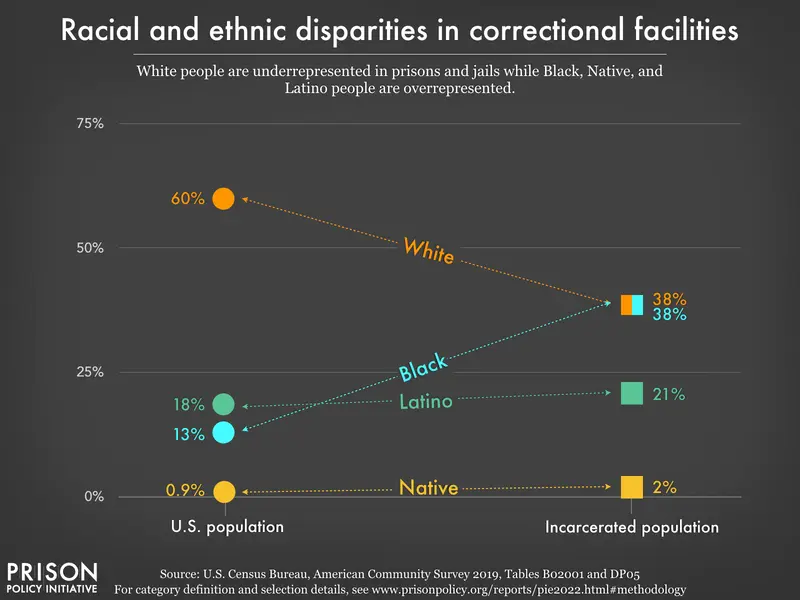
Or if we are not just looking at the likelihood based on these factors, but the data in relation to racial and ethnic disparities that currently exist in correctional facilities, as seen in this prison policy graph shown in figure 9.19.
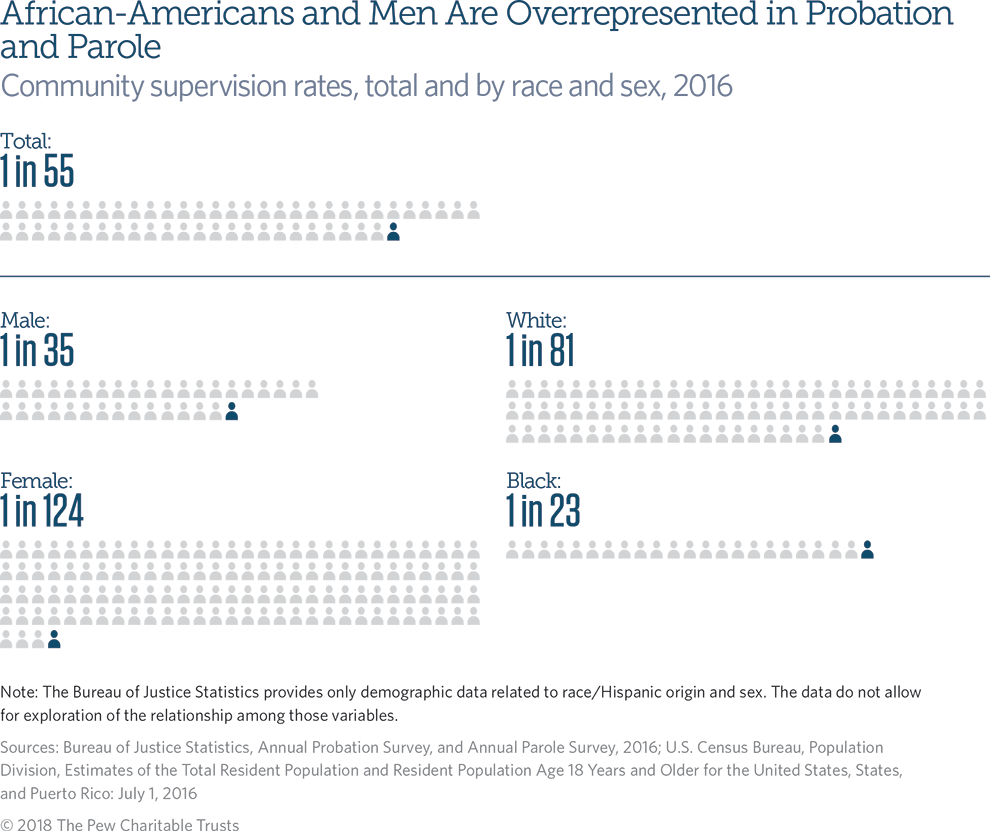
Similar statistics can be found in Community Corrections populations as well, as seen here in the article, Community Supervision Marked by Racial and Gender Disparities | The Pew Charitable Trusts [Website] (figure 9.20). Feel free to explore this website if you want to learn more.
Licenses and Attributions for Current Issues and Crime Problems in Corrections
Open Content, Shared Previously
“Current Issues and Crime Problems in Corrections” is adapted from “9.12 Current Issues in Corrections: Mass Incarceration”, “9.14 Current Issues in Corrections: War on Drugs and Gangs”, “9.15 Current Issues in Corrections: Aging and Overcrowding”, and “9.16 Current Issues in Corrections: Reentry and the Future of Corrections” by David Carter in SOU-CCJ230 Introduction to the American Criminal Justice System by Alison S. Burke, David Carter, Brian Fedorek, Tiffany Morey, Lore Rutz-Burri, and Shanell Sanchez, licensed under CC BY-NC-SA 4.0. Modifications by Megan Gonzalez, revisions by Roxie Supplee, licensed CC BY-NC-SA 4.0 include updating for recency and clarity.
Figure 9.17. “More than one-Quarter of People Incarcerated at the State Level in California Receive Mental Health Care” by Scott Graves, California Budget & Policy Center is licensed under CC BY 4.0.
All Rights Reserved Content
Figure 9.13. International Rates of Incarceration © The Sentencing Project All Rights Reserved, Used with permission materials.
Figure 9.14. State and Federal Prison Population from 1925–2019 © The Sentencing Project All Rights Reserved, Used with permission materials.
Figure 9.15. Despite reforms, drug offenses are still a defining characteristic of the federal system © The Prison Policy Initiative. All Rights Reserved, Used with permission materials.
Figure 9.16. The Number of Older Prisoners Grew by 280%, 1999–2016 by The Pew Trust is included under fair use.
Figure 9.18. Lifetime Likelihood of Imprisonment of U.S. Residents Born in 2001 © The Sentencing Project. All Rights Reserved, Used with permission materials.
Figure 9.19. Racial and Ethnic disparities in correctional facilities © The Prison Policy Initiative. All Rights Reserved, Used with permission materials.
Figure 9.20. Community Supervision Rates, total and by race and sex, 2016 © The Pew Trust. Used under fair use.
A system that uses community-based programs and placements as alternatives to incarceration for all or part of a sentence.
When the number of incarcerated individuals exceeds the capacity of correctional facilities.
A penalty imposed on someone who has committed a crime.
A system of rules enforced through social institutions to govern behavior.
The phenomenon of the United States having the highest incarceration rate in the world.
A facility that houses people convicted of serious crimes and sentenced to long terms of incarceration.
A person's emotional, psychological, and social well-being. Mental health includes our emotional, psychological, and social well-being. It affects how we think, feel, and act. It also helps determine how we handle stress, relate to others, and make choices.
The release of a prisoner under supervision after serving a portion of their sentence.
These are the least dangerous types of crimes which can include, depending on the location, public intoxication, prostitution, and graffiti, among others.
Courts designed to handle specific types of cases, such as drug courts or mental health courts.
