
7.3 Health Equity for Families
Elizabeth B. Pearce; Amy Huskey; Jessica N. Hampton; and Hannah Morelos
Health in the United States is a complex topic. As one of the wealthiest nations, health equity—equal access to health benefits for all people, regardless of identity—could be within reach. The United States, however, fares well in some health comparisons with the rest of the world, and badly in others. For example, postoperative complications are less common in the United States than in comparable countries. And, as Figure 7.6 shows, mortality rates for several cancers are lower. First, let’s look at how the United States compares overall to other countries.
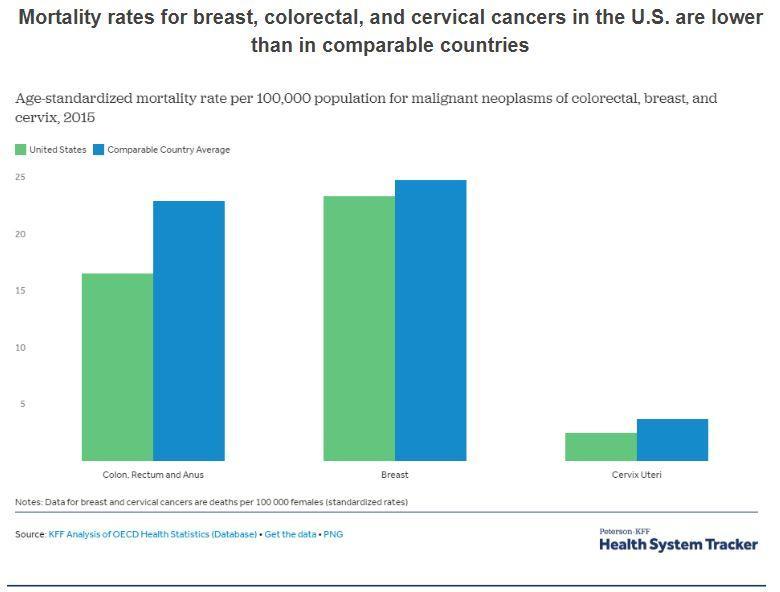
Figure 7.6. The United States typically performs better in both mortality (death) rates and five-year survival rates for breast cancer. In 2015, the mortality rate for breast and cervical cancers in the United States was slightly lower than the comparable country average. For colorectal cancers, the U.S. mortality rate is also lower, with 16.5 deaths per 100,000 people, compared to 22.9 per 100,000 in similar countries.
The overall comparative picture is more grim. The United States spends a great deal more public, private, and out-of-pocket funds per capita on health care but also lags behind almost every industrialized country in terms of providing basic health and health care to all of its citizens (figures 7.7, 7.8, and 7.9) (Tikkanen & Abrams, 2020).
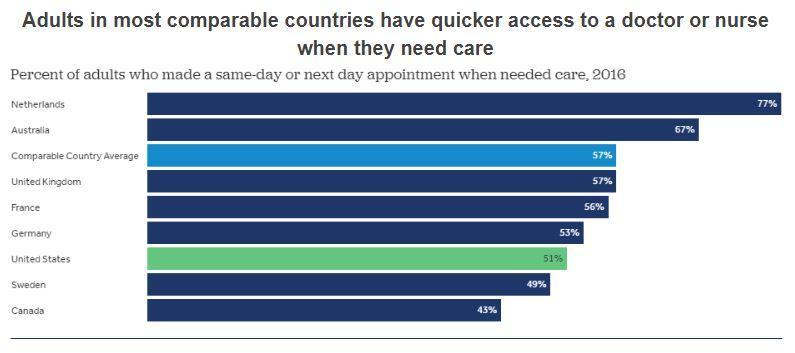
Figure 7.7. With the exception of Canada and Sweden, patients in the United States have a harder time making a same-day appointment when in need of care.
In 2016, 51% of patients in the United States were able to make a same-day appointment with a provider, compared to 57% of patients in similar countries. In other words, you are more likely to have to stay home, miss work or social activities, and be sick longer in the United States compared to someone in other countries, who also spend less on health care than we do in the United States.
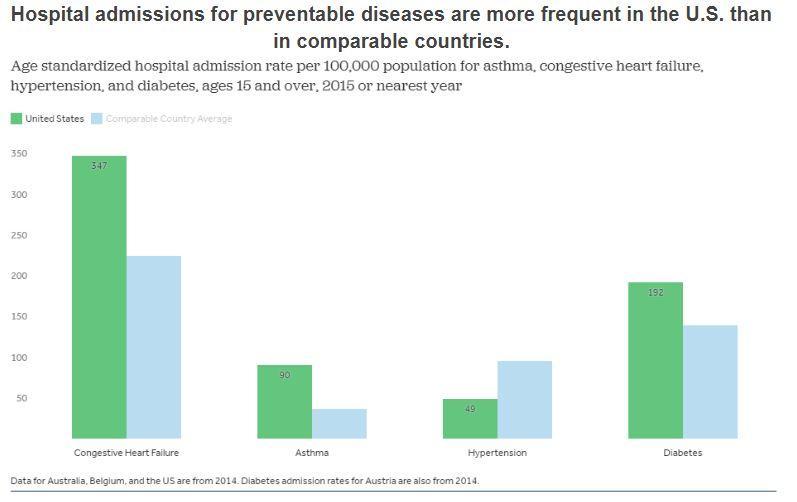
Figure 7.8. Hospital admissions for certain chronic diseases like circulatory conditions, asthma, and diabetes can arise when prevention services are not being delivered.
Hospital admission rates in the United States are higher than in comparable countries for congestive heart failure, asthma, and complications due to diabetes. However, the United States has lower rates of hospitalization for hypertension than comparably wealthy countries do on average. Why is it that hypertension receives more attention in the United States than do other diseases? In total across these four disease categories, the United States has a 37% higher rate of hospital admissions than the average of other countries.
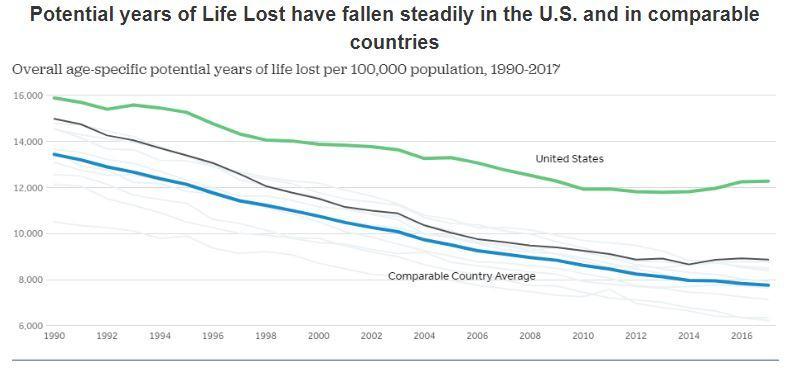
Figure 7.9. Premature deaths are measured in “years of life lost,” which is an alternative to overall mortality rate. It is measured by adding together the total number of years that people who died before a specified age (e.g., 70) would have lived if they had lived to that age. You can see that the United States continues to trail other countries in this measure.
For example, a person who dies at age 45 would have a “years of life lost” (YLL) value of 25. The United States and comparable countries have made progress in reducing YLLs over the last 25 years (down 23% and 42%, respectively), although the United States continues to trail comparable countries by a significant margin (12,282 versus 7,764 YLLs in 2017).
But these charts do not tell the entire story. The overall averages of health only compare the rates in the United States to the rates in other countries. Within the United States, groups are affected disproportionately in terms of access to health and health outcomes. These disparities are described next.
Social Determinants of Health and Disparities
Family and individual health is affected by the environments in which people live, work, learn, and play, the non-medical factors that affect health outcomes, or social determinants of health (World Health Organization). Social engagement and access to resources, safety, and security are all impacted by the settings where families spend their time. Simply put, place matters when it comes to health.
Health disparities are the preventable differences in the burden of disease, injury, violence, or opportunities to achieve optimal health that are experienced by socially disadvantaged populations (Centers for Disease Control and Prevention, 2008). These populations can be defined by factors such as race or ethnicity, gender, education or income, disability, geographic location (e.g., rural or urban), or sexual orientation.
Health disparities result from multiple factors, including:
- Poverty
- Environmental threats
- Inadequate access to health care
- Individual and behavioral factors
- Educational inequalities
Health disparities are related to inequities in education. Dropping out of school is associated with multiple social and health problems (McCarty et al., 2008; Ellickson et al., 1997). Overall, individuals with less education are more likely to experience a number of health risks, such as obesity, substance use disorders, and intentional and unintentional injury, compared with individuals with more education (U.S. Department of Health and Human Services, 2000). Higher levels of education are associated with a longer life and an increased likelihood of obtaining or understanding basic health information and services needed to make appropriate health decisions (Liao et al., 1999; Jemal et al., 2008; Breese et al., 2007).
At the same time, good health is associated with academic success. Higher levels of protective health behaviors and lower levels of health risk behaviors have been associated with higher academic grades among high school students (Rasberry et al., 2017). Health risks such as teenage pregnancy, poor dietary choices, inadequate physical activity, physical and emotional abuse, substance use disorders, and gang involvement have a significant impact on how well students perform in school (Choi, 2007; Shore et al., 2008; Valois et al., 2002; Chomitz et al., 2009; Field et al., 2001).
Health by Race and Ethnicity
When studying health and disease in the United States, it is hard to miss the disparities among races. In 2018, the average life expectancy for Black males was 74.7 years. The average life expectancy for White males was 78.5 years. This is a gap of almost 5 years (Wamsley, 2021). Mortality measures how many people die at a particular time or place. Many families have experienced the tragedy of losing an infant, and it can be hard to talk about. We see similar disparities when we look at how many babies die or infant mortality. The 2018 infant mortality rates for different races and ethnicities are shown in Figure 7.10.

Figure 7.10. Infant mortality varies significantly by race and ethnicity. How might applying the social determinants of health model help us to understand why? Image description.
According to a report from the Kaiser Family Foundation, Black Americans also have a higher incidence of several other diseases and causes of mortality, from cancer to heart disease to diabetes (James et al., 2007). Mexican Americans and Native Americans, also have higher rates of these diseases and causes of mortality than White people
Lisa Berkman (2009) notes that this gap started to narrow during the civil rights movement in the 1960s, but it began widening again in the early 1980s. What accounts for these perpetual disparities in health among different ethnic groups? Much of the answer lies in the level of health care that these groups receive. Even after adjusting for insurance differences, marginalized racial and ethnic groups racial and ethnic minority groups receive poorer quality of care and less access to care than dominant groups (Agency for Healthcare Research and Quality, 2010). Racial inequalities in care include:
- Black Americans, Native Americans, and Alaskan Natives received inferior care than White Americans for about 40% of measures.
- Asian ethnicities received inferior care for about 20% of measures.
- Among Whites, Hispanic Whites received 60% inferior care of measures compared to non-Hispanic Whites.
Although there are multiple, complex reasons for discrepancies in care, a simple illustration may help make the point. Medical professionals and public health workers are asking why Black and Brown people are more likely to die of COVID-19. One medical study examined the pulse oximetry measurements of Black and White people in the hospital. If you’ve been to the hospital, you likely have had to put your finger into a little device that tells the medical professionals how much oxygen is in your blood. That’s oximetry. The study’s authors examined how often these measurements were accurate for White and Black patients.
They found that Black patients were three times more likely than White patients to have shortages of oxygen in the blood that the monitor didn’t pick up. Because COVID-19 mainly attacks the lungs and reduces oxygen, the discrepancies in the measurements of this device may lead to more medical complications in Black patients (Sjoding et al., 2021). In addition, blood oxygenation levels are part of complex automated medical alerts. If the measurements are wrong, they do not trigger the alerts that notify medical professionals to respond. Therefore, the related levels of care are lower and less effective for Black patients, which may not trigger these alerts and higher levels of care for Black patients. To learn more, you can watch the video “Investigating Claims that Oximeters Give Inaccurate Readings to Patients with Darker Skin.”
Health by Socioeconomic Status
Discussions of health by race and ethnicity often overlap with discussions of health by SES, as the two concepts are intertwined in the United States. As the Agency for Health Research and Quality (2010) notes, “racial and ethnic minorities are more likely than non-Hispanic Whites to be poor or near poor,” so many of the data pertaining to marginalized groups are also likely to be pertinent to low socioeconomic groups. Marilyn Winkleby et al. (1992) state that “one of the strongest and most consistent predictors of a person’s morbidity [incidence of disease] and mortality experience is that person’s SES. This finding persists across all diseases with few exceptions, continues throughout the entire lifespan, and extends across numerous risk factors for disease.”
Remember that economics are only part of the SES picture; research suggests that education also plays an important role. Many diseases with a behavioral component, like lung cancer from smoking, coronary artery disease from poor eating and exercise habits, and AIDS occur disproportionately in families with lower education levels, and SES status (Phelan & Link, 2003).
Social class also influences how likely you are to have health insurance. Particularly in the United States, where health care is not universal, the poorer you are, the less likely you are to have quality health insurance. Suppose you have a full-time, beneficial managerial job in a large multinational corporation. In that case, you will likely receive paid time off, excellent health insurance, long-term care insurance, and contributions to your retirement. This package of benefits helps you to prevent disease and stay healthy.
Conversely, suppose you have a low-wage seasonal job, particularly in a state that doesn’t participate in the Affordable Care Act. In that case, neither your employer nor the government provides health care insurance for you. You pay for your health care out of your own pocket. Given the high cost of care, you will likely delay getting treatment, not have access to preventive care, or not be able to pay for complex treatment. In the United States, economics, insurance, and health outcomes are linked in enormously inequitable ways.
Health by Gender and Sexual Identity
Gender identity and sexual orientation may also impact how a person experiences health and illness. However, understanding these unequal experiences based on sociological data is challenging. Because it has been illegal to be queer or transgender until recently in the United States, many people do not disclose their unique identities. The agencies that collect data about gender identity and sexual orientation have only recently begun to retool their data collection methods so that people can report their gender identity or sexual orientation. Despite these limitations, though, we notice inequality.
For example, when the Centers for Disease Control and Prevention examined risk factors for COVID-19 illness or death, they found that gay, lesbian, and bisexual people had challenging underlying health conditions more often than straight people. The report points primarily to economic causes as a core cause of the difference, indicating that lesbian, gay, and bisexual people, particularly if they are Black or Brown, experience less economic stability (Heslin & Hall, 2021).
Women are affected adversely both by unequal access to health care and institutionalized sexism in the health care industry. According to the Kaiser Family Foundation, women experienced a decline in their ability to see needed specialists between 2001 and 2008. In 2008, one quarter of females questioned the quality of their health care (Ranji & Salganico, 2011). In this report, we also see the explanatory value of understanding intersectionality and intersection theory. Further examination of the lack of confidence in the health care system by women, as identified in the Kaiser study, found that low-income women were more likely (32% compared to 23%) to express concerns about health care quality, illustrating the multiple layers of disadvantage caused by SES and sex.
We can see an example of institutionalized sexism in the way that women are more likely than men to be diagnosed with certain kinds of mental disorders. Psychologist Dana Becker (n.d.) notes that 75% of all diagnoses of borderline personality disorder are for women, according to the Diagnostic Statistical Manual of Mental Disorders. This diagnosis is characterized by instability of identity, mood, and behavior, and Becker argues that it has been used as a catch-all diagnosis for too many women. She further criticizes the pejorative connotation of the diagnosis, saying that these pejorative connotations cause people in and outside of the profession of psychotherapy to be biased against women who have been diagnosed with borderline personality disorder.
Many critics also point to the medicalization of women’s issues as an example of institutionalized sexism. Medicalization refers to the process by which previously normal aspects of life are redefined as deviant and needing medical attention to remedy. Historically and contemporarily, many aspects of women’s lives have been medicalized, including menstruation, premenstrual syndrome, pregnancy, childbirth, and menopause.
The medicalization of pregnancy and childbirth has been particularly contentious in recent decades, with many women opting against the medical process and choosing a more natural childbirth. Fox and Worts (1999) find that all women experience pain and anxiety during the birth process, but that social support relieves both as effectively as medical support. In other words, medical interventions are no more effective than social ones at helping with the difficulties of pain and childbirth. Fox and Worts further found that women with supportive partners ended up with less medical intervention and fewer cases of postpartum depression. Of course, access to quality birth care outside the standard medical models may not be readily available to women of all social classes.
Interrelationship of Mental and Physical Health
Mental and physical health have been viewed in the Western world as separate, with mental disorders being stigmatized. Often mental illnesses such as depression or anxiety have been seen as a personal problem that a person should and could “get over” as opposed to a physical ailment such as a sprained ankle or strep throat that merits medical attention and assistance. Even physical illnesses such as fibromyalgia or chronic fatigue syndrome, which are experienced by many more women than men, can be seen as “in the patient’s head,” leading medical professionals to the potential of missing physical illnesses that need medical intervention. This leaves the patient with not only the physical symptoms, but also a potential lack of understanding among peers, family members, medical professionals, and co-workers.
Eastern and Indigenous cultures have long seen the connection between the mind and body and indeed, this connection is better understood than in the United States and among other Western countries where dualism (the separating of the mind/spirit from the body) prevails. Cancer, heart, and respiratory disease death rates are all higher in people with mental illness. In addition, it is better understood how physical lifestyle choices such as exercise, diet, and drug use affect mental health and vice versa (Mental Health Foundation, 2020).
Health Insurance Coverage and Legislation
Like all other health care in the United States, access to mental health care is highly dependent on access to medical insurance. But because the need for mental health support is not validated as fully as is the need for physical health support, insurance companies and government programs have frequently excluded or limited mental health coverage. This is an example of institutionalized or structural stigma.
This practice has been changed through two major acts of legislation: the Mental Health Parity and Addiction Equity Act (MHPAEA) passed in 2008 and The Patient Protection and Affordable Care Act, commonly referred to as the Affordable Care Act (ACA) or Obamacare, passed by the 111th Congress and signed into law by President Barack Obama in 2010.
In 2008, federal lawmakers passed MHPAEA, which created an equity requirement for insurance providers who covered mental health services; those services must be equivalent to the physical health coverage provided. It did not, however, require providers to provide mental health care coverage. So benefits, expenses, and limits requirements were allowed to vary from state to state along with whatever insurance plan individuals could access. It was still the case that insurance holders did not have access to mental health treatment. In 2013, 61% of insured people had access to mental health services and 54% of the insured had access to addiction treatment (Health Pocket, 2013).
The passage of the ACA reduced the inequities in access to mental health and addiction treatment in two fundamental ways. First, it eliminated health insurance companies’ ability to deny coverage based on pre-existing conditions. That gave consumers diagnosed with any mental or physical illness greater choice and more financial leverage when selecting an insurance company. In addition, it required insurance providers to include 10 essential benefits including “services for those suffering from mental health disorders and problems with substance abuse.”
While these improvements in the equitability of mental health and addiction access are notable, they apply only to families who have access to certain kinds of health insurance and not universally to all families in the United States. Structural stigma intersects with systemic racism, sexism, and classism.
Sleep, Discrimination, and Intersectionality
Let’s focus on how these various disparities overlap with everyday behavior. A biological need that is fundamental to human health is sleep, yet the medical community still has much to understand and learn about its exact mechanisms. Sleep is a vital part of our daily routine, and we spend about one-third of our time doing it. Quality sleep, and getting enough of it at the right times, is as essential to survival as food and water. In rats, death results from no sleep at 32 days (Palmer, 2009). Research has not observed human death as a result of prolonged sleep deprivation, but paranoia and hallucinations can begin happening in as little as 24 hours without sleep (Walters et al., 2008).
Consider the effects on you and your family when someone goes without enough sleep. Can you think clearly enough to organize your daily tasks? Complete your studies? Help your child figure out their homework problems? Do you provide the same attention and patience with your partner or in other relationships? Without sleep, it’s harder to concentrate and respond quickly. Sleep is important to a number of brain functions, including maintaining the pathways in your brain that let you learn and create new memories, and getting nerve cells to communicate with each other. In fact, our brains and bodies stay remarkably active while we sleep. Recent findings suggest that sleep plays a housekeeping role that removes toxins in our brains that build up when we are awake.
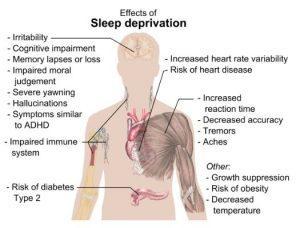
Figure 7.11. Being sleep deprived has much graver consequences than simply feeling tired.
Sleep affects almost every type of tissue and system in the body, from the brain, heart, and lungs to metabolism, immune function, mood, and disease resistance. Research shows that a chronic lack of sleep, or getting poor quality sleep, increases the risk of disorders including high blood pressure, cardiovascular disease, diabetes, depression, and obesity. All of these conditions, shown in Figure 7.11, would likely have a noticeable effect on multiple dimensions of family life and how it impacts the well-being of a family as a whole.
If you would like to learn some more surprising and specific health effects of sleep and apply what you have learned about the superpowers of sleep, participate in this activity in the Going Deeper section.
A 2010 study examined whether there were disparities in sleep quality based on poverty and race/ethnicity. They found that a “sleep disparity” did exist in the study population, and poor sleep quality was strongly associated with poverty and race. Factors such as employment, education, and health status, among others, significantly mediated this effect in participants experiencing poverty. The literature linking sleep and health continues to grow. This study illustrated how poor health is associated with an almost 4-fold increased likelihood of poor sleep. It is important to note that the relationship between health and sleep quality is likely bidirectional and/or parallel: sleep can influence health and vice versa (Patel et al., 2010). The CDC collects data related to sleep and in figures 7.12 and 7.13, you can see how race, ethnicity, and geographic location are correlated with how much sleep adults get.
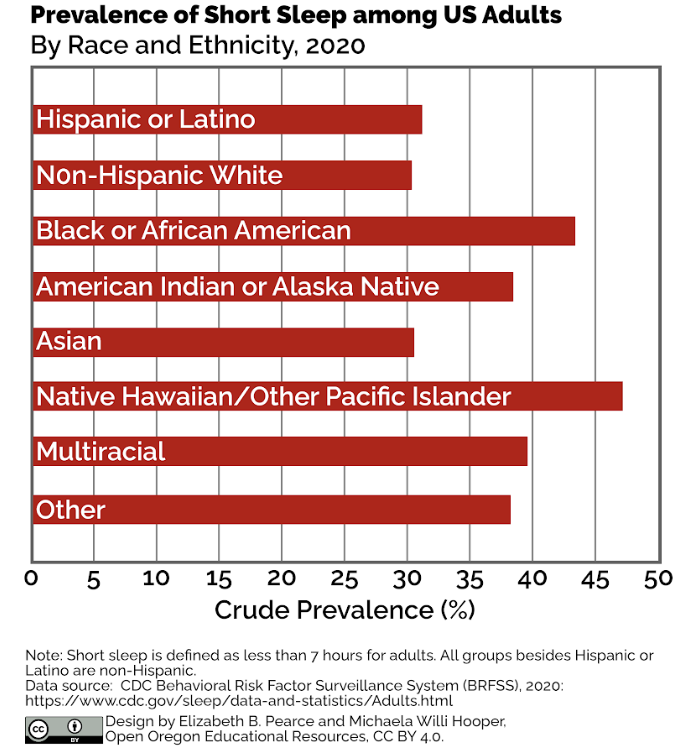
Figure 7.12. Data collected by the CDC between 2013 and 2020, showed the correlation between race, ethnicity and sleep duration. Asian people and non-Hispanic White people had the fewest instances of short sleep duration. Image Description
Discrimination, and especially intersectional discrimination, appear to influence sleep, mental, and physical health. The relationship between discrimination and poorer mental and physical health has been established among populations such as women, racial and ethnic minorities, and members of LGBTQ+ groups. For instance, discrimination can harm well-being, increase distress and mental illness symptoms, elevate risk for a wide variety of physical illnesses and conditions, and undermine general indicators of health (Brown et al., 2018; Schmitt et al., 2014).
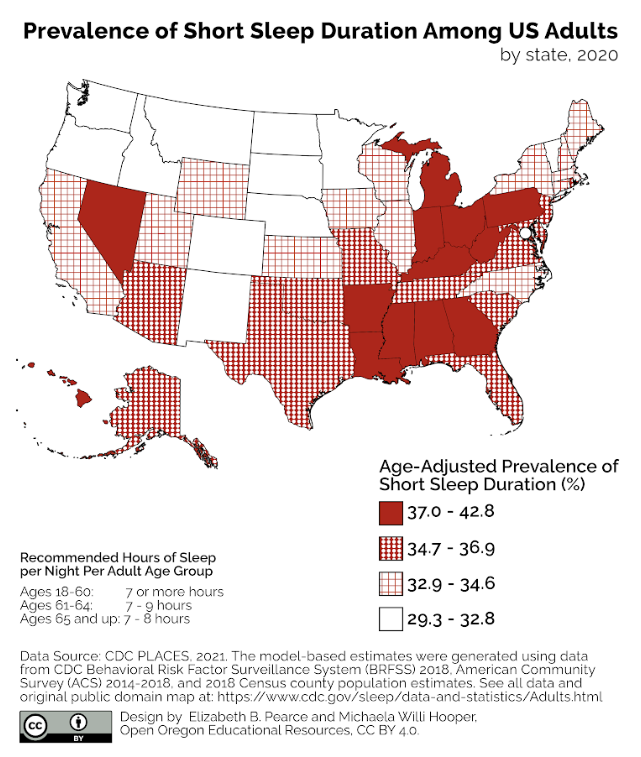
Figure 7.13. Between 29% and 43% of the U.S. adult population gets less sleep than they need. States that have the darkest red shading have the most instances of sleep deprivation, whereas states that have the lightest white shading have the fewest amounts of adults who have sleep deprivation. Image Description
Age-adjusted prevalence of adults who reported short sleep duration varied by county in 2018, ranging from 25.6% in Summit County, Utah to 49.1% in McCreary County, Kentucky. In other words, the map which shows sleep deprivation by state does not tell the whole story. If you are interested in seeing more detailed information, click here to view the CDC county-by county map and click here for an image description of the map.
Consider also the ways that low-income and marginalized kinship groups inhabit less-desirable neighborhoods. The map in Figure 7.13 shows that geography matters. The overlap of all social determinants of health including feeling safe and secure are likely to impact sleep—and then lack of sleep impacts familial relationships. Lack of sleep and less functionality during the daytime have been identified as integral aspects of the cycle of discrimination, stress, and overall mental and physical health (Hisler & Brenner, 2019).
Obesity
A social problem is characterized by affecting many people, threatening the health and welfare of society, recognized as a problem by many people, with multiple causes and effects, and also requiring a systemic solution. Among many social problems faced by this country is obesity, which affects many Americans directly and indirectly. Obesity affects children and adults but is most prevalent in Non-Hispanic Black adults as shown in Figure 7.14 (Centers for Disease Control and Prevention, 2022).
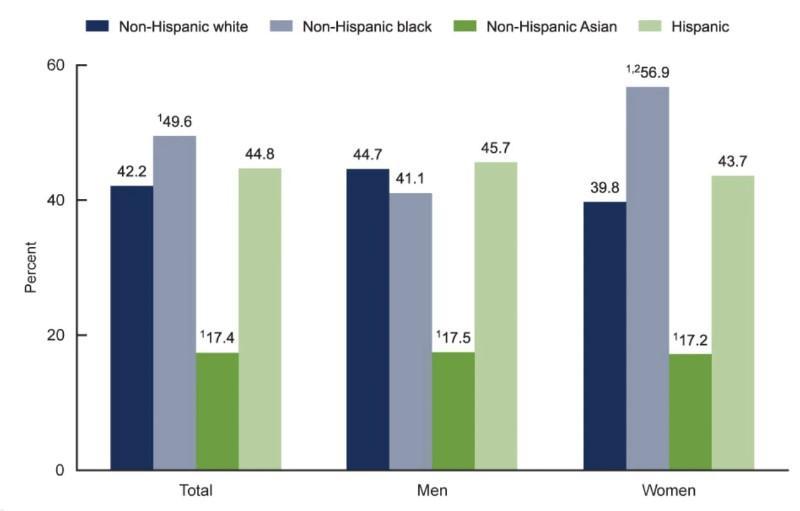
Figure 7.14. This chart shows the prevalence of obesity among adults ages 20 and over by sex, race, and Hispanic origin in the United States from 2017 to 2018.
It is clear from Figure 7.14 that obesity is most prevalent in non-Hispanic Black people, with the highest level of 49.6%. It translates to one in every two non-Hispanic Black adults suffering from obesity, women more than men. But it is difficult to separate this data from the intersection of “isms” that Black women have faced and continue to face: racism, sexism, and classism (Awad et al., 2015).
The National Institute of Health states that when an individual’s weight is higher than the average weight at a given height, they are said to be overweight or suffering from obesity (Ogden, 2018). Being overweight or obese makes it more likely to be prone to a wide range of other illnesses, such as type-2 diabetes, heart disease, and high blood pressure, which are life-threatening. It is tricky to pinpoint what causes obesity as many factors contribute to including several personal conditions and behaviors:
- Genetics that predispose a person toward obesity
- Medication
- Medical conditions
- Diet
How do these personal conditions and behaviors relate to societal conditions? In order to solve a social problem we must understand the ways that social structures create conditions for the problem.
Some of the social conditions that contribute to the obesity epidemic include:
- Food deserts
- Subsidized crops (predominantly those discussed earlier)
- Lack of access to outdoors
- Lack of places to exercise
- SES
- Stigma related to being overweight
In February 2023, the American Academy of Pediatrics (AAP) released updated guidelines for evaluating and treating children and adolescents with obesity, the first update in over 15 years. They advocate for more intensive treatment options, including therapy, medication, and surgery, earlier in life. They advise pediatricians to “offer treatment options early and at the highest available intensity” (Hampl et al., 2023). If obesity is untreated, it is associated with a wide range of health problems including heart disease and diabetes. The AAP guidelines call for a “whole child” approach, acknowledging that obesity has complex causes including genetics and SES rather than personal behaviors and choices. They emphasize communication that is non-stigmatizing and supportive.
Licenses and Attributions for Health Equity for Families
Open Content, Original
“Health Equity for Families” by Elizabeth B. Pearce. License: CC BY 4.0.
Figure 7.12. “Prevalence of Short Sleep Duration Among US Adults by Race and Ethnicity, 2020” by Elizabeth B. Pearce and Michaela Willi Hooper, Open Oregon Educational Resources. License: CC BY 4.0. Based on data from CDC Behavioral Risk Factor Surveillance System (BRFSS), 2020.
Figure 7.13. “Prevalence of Short Sleep Duration Among US Adults by State, 2020“ by Elizabeth B. Pearce and Michaela Willi Hooper, Open Oregon Educational Resources. License: CC BY 4.0. Based on CDC Behavioral Risk Factor Surveillance System (BRFSS) 2018, American Community Survey (ACS) 2014-2018, and 2018 Census county population estimates. See all data and original public domain map.
“Interrelationship of Mental and Physical Health” by Elizabeth B. Pearce. License: CC BY 4.0.
“Mental Health Stigma” by Hannah Morelos. License: CC BY 4.0.
“Health Insurance Coverage” by Elizabeth B. Pearce. License: CC BY 4.0.
“Obesity” by Audrey Mayo and Elizabeth B. Pearce. License: CC BY 4.0.
Open Content, Shared Previously
“Social Determinants of Health and Disparities” is adapted from “Health Disparities” by the Centers for Disease Control and Prevention. Public domain. Adaptations: inclusion of health equity information; edited for brevity.
“Health by Race and Ethnicity,” “Health by Socioeconomic Status,” and “Health by Gender” are adapted from “Health in the United States” by Tonja R. Conerly, Kathleen Holmes, and Asha Lal Tamang from Introduction to Sociology, 3rd Edition, Openstax. License: CC BY 4.0. Adaptations: reorganized and edited for brevity. Remixed with additions and updated material related to infant mortality rates, racism, COVID-19, and sexual orientation from Social Problems by Kim Puttman and Kate Burrows. License: CC BY 4.0.
“Focus on: Sleep, Discrimination and Intersectionality” is adapted from “Brain Basics: Understanding Sleep” by the National Institute of Neurological Disorders and Stroke/National Institute of Health. Public domain. Adaptations: minor edits for clarity and consistency.
Figure 7.6. “Mortality Rates for Breast and Colorectal Cancer in the United States Are Lower than in Comparable Countries” by Peterson-KFF. License: CC BY-NC-ND 3.0.
Figure 7.10. “Infant Mortality by Race and Ethnicity, 2018” by the Centers for Disease Control. Public domain.
Figure 7.9. “Percent of Adults Who Made a Same-Day or Next-Day Appointment when Needed Care, 2016” by Peterson-KFF. License: CC BY-NC-ND 3.0.
Figure 7.8. “Age-Sex Standardized Hospital Admission Rate per 100,000 Population for Asthma, Congestive Heart Failure, Hypertension, and Diabetes, Ages 15 and over, 2016 or nearest Year” by Peterson-KFF. License: CC BY-NC-ND 3.0.
Figure 7.9. “Potential Years of Life Lost Have Fallen Steadily in the United States and in Comparable OECD Countries” by Peterson-KFF. License: CC BY-NC-ND 3.0.
Figure 7.13. “Short Sleep Duration (<7 Hours) Race/Ethnicity” by the Centers for Disease Control and Prevention. Public domain.
Figure 7.14. National Institute of Diabetes and Digestive and Kidney Diseases, 2021, www.niddk.nih.gov/health-information/health-statistics/overweight-obesity. Adapted from the National Institutes of Health National Institute of Diabetes and Digestive and Kidney Diseases “Overweight & Obesity Statistics.”
All Rights Reserved Content
Figure 7.12. “Sleep Is Your Superpower” © TED Talks. License: Standard YouTube License.
References
Awad, G. H., Norwood, C., Taylor, D. S., Martinez, M., McClain, S., Jones, B., Holman, A., & Chapman-Hilliard, C. (2015). Beauty and Body Image Concerns Among African American College Women. The Journal of Black Psychology, 41(6), 540–564. https://doi.org/10.1177/0095798414550864
Becker, D. (n.d.) Borderline Personality Disorder: The disparagement of women through diagnosis. Association for Women in Psychology. http://www.awpsych.org/index.php?option=com_content&view=article&id=109&catid=74&Itemid=126.
Berkman, L. F. (2009). Social epidemiology: Social determinants of health in the United states: are we losing ground? Annual Review of Public Health, 30(1), 27–41. https://doi.org/10.1146/annurev.publhealth.031308.100310
Breese, P. E., Burman, W. J., Goldberg, S., & Weis, S. E. (2007). Education level, primary language, and comprehension of the informed consent process. Journal of Empirical Research on Human Research Ethics, 2(4), 69–79. https://doi.org/10.1525/jer.2007.2.4.69
Brown, T. T., Partanen, J., Chuong, L., Villaverde, V., Chantal Griffin, A., & Mendelson, A. (2018). Discrimination hurts: The effect of discrimination on the development of chronic pain. Social Science & Medicine, 204, 1–8. https://doi.org/10.1016/j.socscimed.2018.03.015
Choi, Y. (2007). Academic achievement and problem behaviors among Asian Pacific Islander American adolescents. Journal of Youth and Adolescence, 36(4), 403–415. https://doi.org/10.1007/s10964-006-9152-4
Chomitz, V. R., Slining, M. M., McGowan, R. J., Mitchell, S. E., Dawson, G. F., & Hacker, K. A. (2009). Is there a relationship between physical fitness and academic achievement? Positive results from public school children in the northeastern United states. Journal of School Health, 79(1), 30–37. https://doi.org/10.1111/j.1746-1561.2008.00371.x
Ellickson, P., Saner, H., & McGuigan, K. A. (1997). Profiles of violent youth: Substance use and other concurrent problems. American Journal of Public Health, 87(6), 985–991. https://doi.org/10.2105/AJPH.87.6.985
Field, T., Diego, M., & Sanders, C. E. (2001). Exercise is positively related to adolescent’s relationships and academics. Adolescence, 36(141), 105.
Fox, B., & Worts, D. (1999). Revisiting the critique of medicalized childbirth: A contribution to the sociology of birth. Gender & Society, 13(3), 326–346. https://doi.org/10.1177/089124399013003004
Hampl, S. E., Hassink, S. G., Skinner, A. C., Armstrong, S. C., Barlow, S. E., Bolling, C. F., Avila Edwards, K. C., Eneli, I., Hamre, R., Joseph, M. M., Lunsford, D., Mendonca, E., Michalsky, M. P., Mirza, N., Ochoa, E. R., Jr, Sharifi, M., Staiano, A. E., Weedn, A. E., Flinn, S. K., … Okechukwu, K. (2023). Clinical Practice Guideline for the Evaluation and Treatment of Children and Adolescents With Obesity. Pediatrics, 151(2), e2022060640. https://doi.org/10.1542/peds.2022-060640
Health Pocket. (2013, March 7). Few existing health plans meet new ACA essential health benefit standards. https://www.healthpocket.com/healthcare-research/infostat/few-existing-health-plans-meet-new-aca-essential-health-benefit-standards
Heslin, K. C., Hall, J. E. (2021). Sexual Orientation Disparities in Risk Factors for Adverse COVID-19–Related Outcomes, by Race/Ethnicity—Behavioral Risk Factor Surveillance System. Morbidity Mortality Weekly Report, 70, 149–54. http://dx.doi.org/10.15585/mmwr.mm7005a1.
Hisler, G. C., & Brenner, R. E. (2019). Does sleep partially mediate the effect of everyday discrimination on future mental and physical health? Social Science & Medicine, 221, 115–123. https://doi.org/10.1016/j.socscimed.2018.12.002
James, C., Thomas, M., & Lillie-Blanton, M. (2007). Key facts: Race, ethnicity & medical care. The Henry J. Kaiser Family Foundation. http://www.kff.org/minorityhealth/upload/6069-02.pdf.
Jemal, A., Thun, M. J., Ward, E. E., Henley, S. J., Cokkinides, V. E., & Murray, T. E. (2008). Mortality from leading causes by education and race in the United states, 2001. American Journal of Preventive Medicine, 34(1), 1-8.e7. https://doi.org/10.1016/j.amepre.2007.09.017
Liao, Y., McGee, D. L., Kaufman, J. S., Cao, G., & Cooper, R. S. (1999). Socioeconomic status and morbidity in the last years of life. American Journal of Public Health, 89(4), 569–572. https://doi.org/10.2105/AJPH.89.4.569
Mental Health Foundation. (2020). Physical health and mental health. https://www.mentalhealth.org.uk/a-to-z/p/physical-health-and-mental-health
Ogden, C (n.d.). Overweight & Obesity Statistics. National Institute of Diabetes and Digestive and Kidney Diseases. http://www.niddk.nih.gov/health-information/health-statistics/overweight-obesity.
Palmer, B. (2009, May 11). Can you die from lack of sleep? Slate. https://slate.com/news-and-politics/2009/05/can-you-die-from-lack-of-sleep.html
Patel, N. P., Grandner, M. A., Xie, D., Branas, C. C., & Gooneratne, N. (2010). “Sleep disparity” in the population: Poor sleep quality is strongly associated with poverty and ethnicity. BMC Public Health, 10(1), 475. https://doi.org/10.1186/1471-2458-10-475
Phelan, J. C., & Link, B. G. (2003). When income affects outcome: Socioeconomic status and health. Research in Profile, 6.
Ranji, U., & Salganico, A. (2011). Women’s health care chartbook: Key findings from the Kaiser Women’s Health Survey. The Henry J. Kaiser Family Foundation. https://www.kff.org/womens-health-policy/report/womens-health-care-chartbook-key-findings-from/
Rasberry, C. N., Tiu, G. F., Kann, L., McManus, T., Michael, S. L., Merlo, C. L., Lee, S. M., Bohm, M. K., Annor, F., & Ethier, K. A. (2017). Health-related behaviors and academic achievement among high school students—United States, 2015. MMWR. Morbidity and Mortality Weekly Report, 66(35), 921–927. https://doi.org/10.15585/mmwr.mm6635a1
Schmitt, M. T., Branscombe, N. R., Postmes, T., & Garcia, A. (2014). The consequences of perceived discrimination for psychological well-being: A meta-analytic review. Psychological Bulletin, 140(4), 921–948. https://doi.org/10.1037/a0035754
Shore, S. M., Sachs, M. L., Lidicker, J. R., Brett, S. N., Wright, A. R., & Libonati, J. R. (2008). Decreased scholastic achievement in overweight middle school students. Obesity, 16(7), 1535–1538. https://doi.org/10.1038/oby.2008.254
Sjoding, M. W., Admon, A. J., Saha, A. K., Kay, S. G., Brown, C. A., Co, I., Claar, D., McSparron, J. I., & Dickson, R. P. (2021). Comparing clinical features and outcomes in mechanically ventilated patients with covid-19 and acute respiratory distress syndrome. Annals of the American Thoracic Society, 18(11), 1876–1885. https://doi.org/10.1513/AnnalsATS.202008-1076OC
Tikkanen, R. & Abrams, M.K. (2020, January 30). U.S. health care from a global perspective, 2019: Higher spending, worse outcomes? The Commonwealth Fund. https://www.commonwealthfund.org/publications/issue-briefs/2020/jan/us-health-care-global-perspective-2019
U.S. Agency for Healthcare Research and Quality. (2010). The 2010 National Healthcare Disparities Report. https://archive.ahrq.gov/research/findings/nhqrdr/nhdr10/index.html
U.S. Census Bureau. (2011). Statistical Abstract of the United States: 2012. (131st ed.) Washington, DC. http://www.census.gov/compendia/statab.
U. S. Centers for Disease Control and Prevention. (2008). Community Health and Program Services (CHAPS): Health disparities among racial/ethnic populations. Atlanta: U.S. Department of Health and Human Services.
U. S. Centers for Disease Control and Prevention (2022, July 20). Obesity is a common, serious, and costly disease. Centers for Disease Control and Prevention. https://www.cdc.gov/obesity/data/adult.html
U.S. Department of Health and Human Services. (2000). Healthy People 2010 objectives: Educational and community-based programs. https://www.cdc.gov/nchs/healthy_people/hp2010.htm
Valois, R. F., MacDonald, J. M., Bretous, L., Fischer, M. A., & Drane, J. W. (2002). Risk factors and behaviors associated with adolescent violence and aggression. American Journal of Health Behavior, 26(6), 454–464. https://doi.org/10.5993/AJHB.26.6.6
Wamsley, L. (2021, February 18). American Life Expectancy Dropped By A Full Year In 1st Half Of 2020. NPR, https://www.npr.org/2021/02/18/968791431/american-life-expectancy-dropped-by-a-full-year-in-the-first-half-of-2020.
Waters, F., Chiu, V., Atkinson, A., & Blom, J. D. (2018). Severe sleep deprivation causes hallucinations and a gradual progression toward psychosis with increasing time awake. Frontiers in Psychiatry, 9, 303. https://doi.org/10.3389/fpsyt.2018.003
Winkleby, M. A., Jatulis, D. E., Frank, E., & Fortmann, S. P. (1992). Socioeconomic status and health: How education, income, and occupation contribute to risk factors for cardiovascular disease. American Journal of Public Health, 82(6), 816–820. https://doi.org/10.2105/AJPH.82.6.816
World Health Organization (n.d.) Social determinants of health. https://www.who.int/health-topics/social-determinants-of-health