
8.2 Housing and Homes
I just feel like I influence people because I’m like—I was practically homeless.
—Cardi B
Housing is another word for the place that families go each night to find shelter not only from the physical elements, but also to find enough emotional safety that they can become centered, rejuvenated, and sleep securely. In the best scenarios it provides not only security, but a place for families to love and nurture the self and one another.

Figure 8.1. Cardi B rose from poverty to fame.
Cardi B, a famous rapper (born as Belcalis Almanzar), describes being able to move out of her abusive boyfriend’s home with money earned from her work stripping in a club. “There were two pit bulls in that house, and I had asthma. There were bed bugs, too,” she said. “On top of that, I felt like my ex-boyfriend was cheating on me, but it was like even if he was cheating on me, I still can’t leave because—where was I gonna go?” (Akhtar, 2017).
In Cardi B’s case (Figure 8.1), she had safety from the outside physical world. But she was not safe inside her home. This is just one example of the complexities of housing, and specifically the ways that inequities play out in the United States.
Income is the primary determining factor in housing access. Price, availability, location, and macroeconomics all play a role, but a family’s annual income is the main determinant in housing affordability (Tilly, 2006). Therefore, inequities in income distribution directly affect housing access, and the capability of families to be safe, secure, and able to function to their maximum potential.
Cardi B grew up living between two different Bronx neighborhoods in New York City. When she describes her parents, she says, “I have real good parents, they poor. They have regular, poor jobs and what not,” she said in an interview with the news organization Global Grind. “They real good people and what not, I was just raised in a bad society” (Shamsian & Singh, 2019). It is common for U.S. working families to be unable to afford adequate housing, pictured in 8.2.

Figure 8.2.Some families with multiple wage-earners and jobs, are prohibited from buying a home.
Part-time and temporary jobs frequently come with lower pay and fewer benefits such as health care, sick leave, and other paid and unpaid leaves. This makes it harder to budget for regular expenses such as food and housing. Sex, sexuality, immigration status, and ethnicity matters when it comes to full-time permanent work, meaning that it is also likely women, immigrants, and people from marginalized ethnic and sexuality groups are more likely to have fewer of these jobs and more difficulty saving for housing.
Where Families Live
Considering the location of families in the United States, we will briefly look at three factors: geography, types of locations, which commonly include urban, suburban, and rural communities, and household size. Household size refers to the number of people living together in a dwelling. Exurbs, a relatively new term, describes areas just outside of suburban communities that typically feature low-density housing and large homes. These may overlap into farm or forested areas, but they are not considered rural.
Population distribution is divided into four main regions by the U.S. Census Bureau in order to register the population: the Northeast, Midwest, South, and West; see the map in Figure 8.3 for divisions within regions.
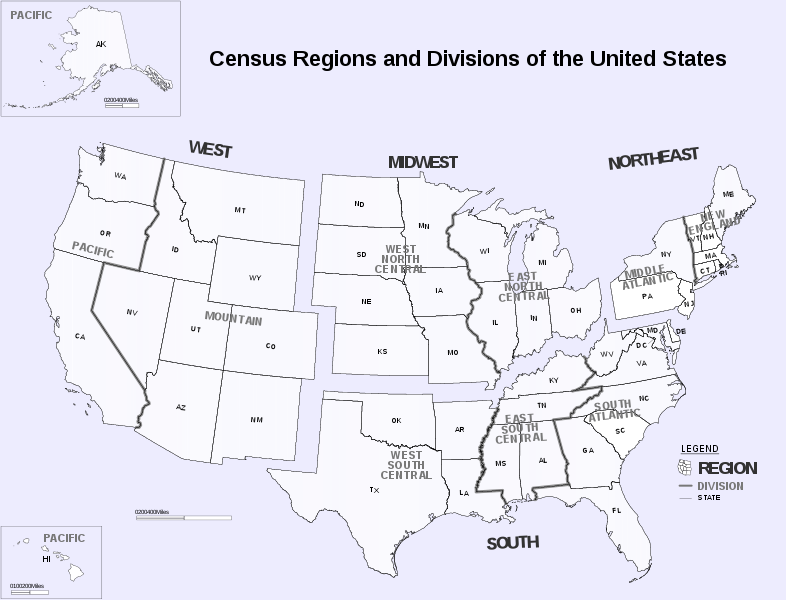
Figure 8.3. The U.S. Census Bureau divides the United States into four regions: the Northeast, Midwest, South, and West.
Population is spread unevenly across the United States with density focused in the Northeast and Southern regions, and two smaller divisions: the East North Central in the Midwest, and the Pacific division of the West, which includes Oregon (Figure 8.4).
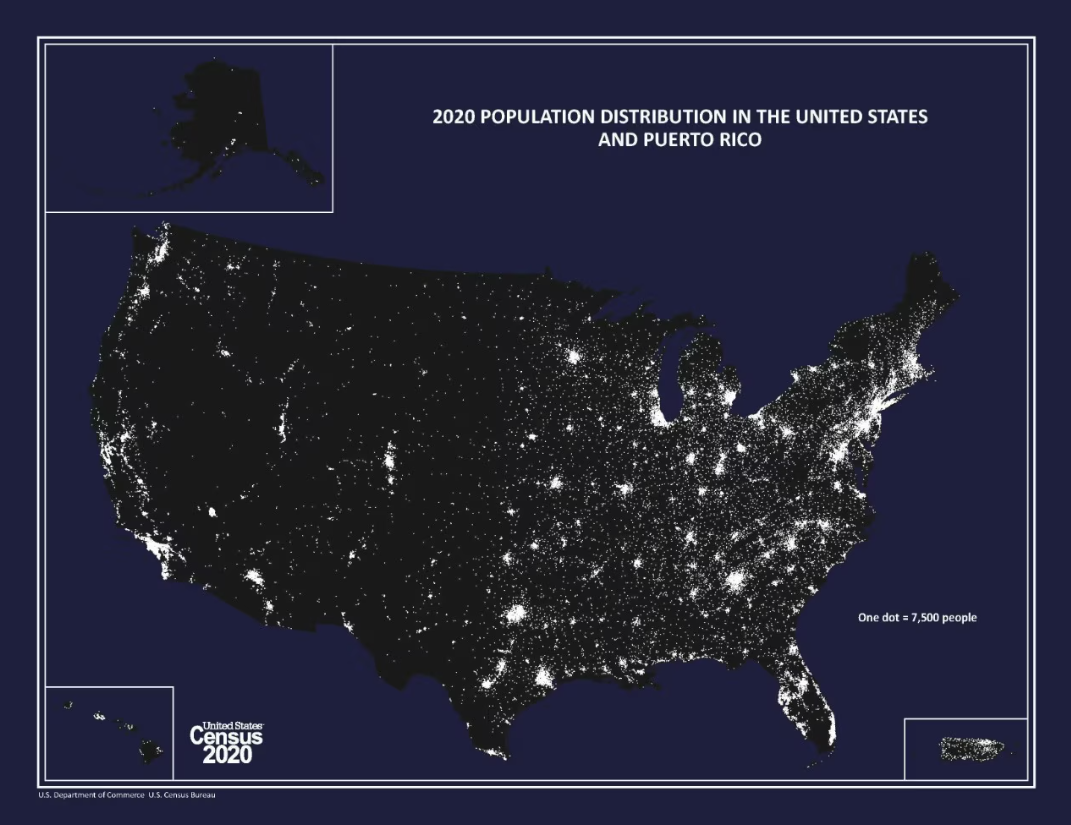
Figure 8.4. Although the population of the United States is growing, the rate of growth is slowing. The four states that have the most numeric growth in the past 10 years are Texas, Florida, Arizona, and North Carolina. The states with the highest percentage growth are South Carolina, Florida, Texas, and Idaho experiencing between 1.3% and 1.7% growth from 2022 to 2023 (U.S. Census Bureau, 2023).
Where families live can also be examined related to living in urban, suburban, rural, and exurban (prosperous districts outside of the suburbs) areas. Over the second half of the 20th century and the first part of the 21st century, families generally moved away from urban centers and into the suburbs. But the recession of 2008 to 2015 reversed that trend and urban areas made some growth, while suburbs and exurbs declined. Since 2016, the overall trend has again shifted, increasing family growth in suburbs and metropolitan areas (as opposed to urban cores), with Midwestern metro areas seeing the most growth (Frey, 2018). Values, racial-ethnic groups, and education are all factors in family location.
Environments and locations have differing health advantages and risks. Air quality, access to green spaces, clean water, and places to recreate are often described as “quality of life” factors. But a greater emphasis is critical as these are considered to be as important to overall health as are genetics and lifestyle (U.S. Department of Health and Human Services, 2019). Air and water will be discussed more in depth in Chapter 10. With the advent of shelter-at-home restrictions related to the pandemic of COVID-19, home environments have become an even greater factor in our overall health.
How Families Live
Finding a place to call “home” is important. Living in a place that supports access to outdoor spaces, a feeling of security, effective schools, transportation, food and other resources and the potential for community are quality factors that affect a family’s abilities to function effectively and efficiently. We might call these “livable environments.”
Home ownership has been and is still the most basic and viable way to accrue wealth in the United States. Access to home ownership is important to families for both livability and financial investment purposes. Uncovering the inequities in access to home ownership is critical to understanding the well-being of families in the United States.
Household size had been declining from 1790 through 2010, going from an average size of 5.79 people to 2.58 people. Since then it has increased to 2.63 people in 2018. This increase is likely due to several factors. The recession affected families across the United States and many families “doubled up” in their housing. In addition, the trend of young adults living with their parents for longer periods of time decreases the number of independent households (Fry, 2019). And there is an increase in multigenerational households. This reflects the growing racial-ethnic diversity in the United States; Asian, Hispanic, and Black families are more likely to live in multigenerational households than are non-Hispanic White families (Menasce et al., 2019). The trend of increasing household size is important to note because it will likely impact the economy in the United States if it continues, as it will influence that amount of new housing construction.
Families that rent (pay to live in a home owned by someone else) homes rather than buy are on the increase; more people are renting now than at any time in the last 50 years. This is not due to lack of desire to own a home; in a 2016 Pew Research Center Survey, 72% of renters said that they desire to own a home (Cilluffo et al., 2017). Denial rates for mortgages continue to be higher for Black and Hispanic applicants. When they are approved, they tend to have higher monthly payments, which increases the cost burden on families. This is typically due to having fewer financial resources with which to make a down payment (Desilver & Bialik, 2017).
Licenses and Attributions for Housing and Homes
Open Content, Original
“Housing and Homes” by Elizabeth B. Pearce. License: CC BY 4.0.
Open Content, Shared Previously
Figure 8.1. “Cardi B live auf dem Openair Frauenfeld 2019” by FrankSchwichtenberg. License: CC BY-SA 4.0.
Figure 8.2. “home sweet home” by Libor Gabrhel. License: CC BY-NC-ND 2.0.
Figure 8.3. “Census Regions and Division of the United States” by U.S. Census Bureau. Public domain.
Figure 8.4. “2010 Population Distribution in the United States and Puerto Rico” by U.S. Census Bureau. Public domain.
References
Akhtar, A. (2017, September 27). How Cardi B escaped poverty to become the first female rapper in 19 years to top the charts. http://money.com/how-cardi-b-escaped-poverty-to-become-the-first-female-rapper-in-19-years-to-top-the-charts/
Cilluffo, A., Geiger, A.W., & Fry, R. (2017, July 19). More U.S. households are renting than at any point in 50 years. Pew Research Center. https://www.pewresearch.org/fact-tank/2017/07/19/more-u-s-households-are-renting-than-at-any-point-in-50-years/
Desilver, D., & Bialik, K. (2017, January 10). Blacks, Hispanics face mortgage challenges. Pew Research Center. https://www.pewresearch.org/fact-tank/2017/01/10/blacks-and-hispanics-face-extra-challenges-in-getting-home-loans/
Frey, W. H. (2018, March 26). U.S. population disperses to suburbs, exurbs, rural areas, and “middle of the country” metros. The Brookings Institution. https://www.brookings.edu/blog/the-avenue/2018/03/26/us-population-disperses-to-suburbs-exurbs-rural-areas-and-middle-of-the-country-metros/
Fry, R. (2019, October 1). The number of people in the average U.S. household is going up for the first time in over 160 years. Pew Research Center. https://www.pewresearch.org/fact-tank/2019/10/01/the-number-of-people-in-the-average-u-s-household-is-going-up-for-the-first-time-in-over-160-years/
Menasce Horowitz, J., Brown, A., & Cox, K. (2019, April 9). Views on race in America 2019. Pew Research Center. https://www.pewsocialtrends.org/2019/04/09/race-in-america-2019/
Shamsian, J. & Singh, O. (2019, October 10). How Cardi B went from a stripper to a chart-topping rapper. Business Insider. https://www.insider.com/who-is-cardi-b-bodak-yellow-2017-9
Tilly, C. (2006). The economic environment of housing: Income inequality and insecurity. In R. G. Bratt, M. E. Stone, and C. Hartman, A right to housing: Foundation for a new social agenda (pp. 20–35). Temple University Press.
U.S. Census Bureau. (2019, December 30). 2019 U.S. population estimates continue to show the nation’s growth is slowing. https://www.census.gov/newsroom/press-releases/2019/popest-nation.html
U.S. Department of Health and Human Services. (2019, May 14). Healthy homes reports and publications. Retrieved May 14, 2020, from https://www.hhs.gov/surgeongeneral/reports-and-publications/healthy-homes/index.html
U.S. Census Bureau (n.d.). 2020 population distribution in the United States and Puerto Rico. Census.Gov. Retrieved February 20, 2024, from https://www.census.gov/library/visualizations/2021/geo/population-distribution-2020.html
U.S Census Bureau. (2023). U. S. Population trends return to pre-pandemic norms as more states gain population. Census.Gov. Retrieved February 20, 2024, from https://www.census.gov/newsroom/press-releases/2023/population-trends-return-to-pre-pandemic-norms.html