
13.3 Post-Secondary Education and Families
As of January 22, 2021, there are approximately 19.6 million students enrolled in postsecondary education institutions in the United States (Hanson, 2021). This number includes both undergraduate and graduate students. You might think that the average college student is an 18-year-old right out of high school, and while these students are still in the majority, the composition of college students, especially those at community colleges, has changed markedly over time. Emerging adulthood, the time between finishing secondary education and the beginning of the markers of adulthood (such as finishing college, starting a career, marriage, and a home purchase) has been identified as a stage separate from early adulthood and middle adulthood. This trend means that college students have a wider age range than previous generations. The overall college enrollment rate for 18- to 24-year-olds decreased from 41% in 2010 to 38% in 2021, a gradual decline (National Center for Education Statistics, 2023).
Still, the majority of college students, especially in four-year schools, are in the 18- to 24-year-old age range, and a Google image search, shown in Figure 13.10, demonstrates that this is the predominant image we have of college students.
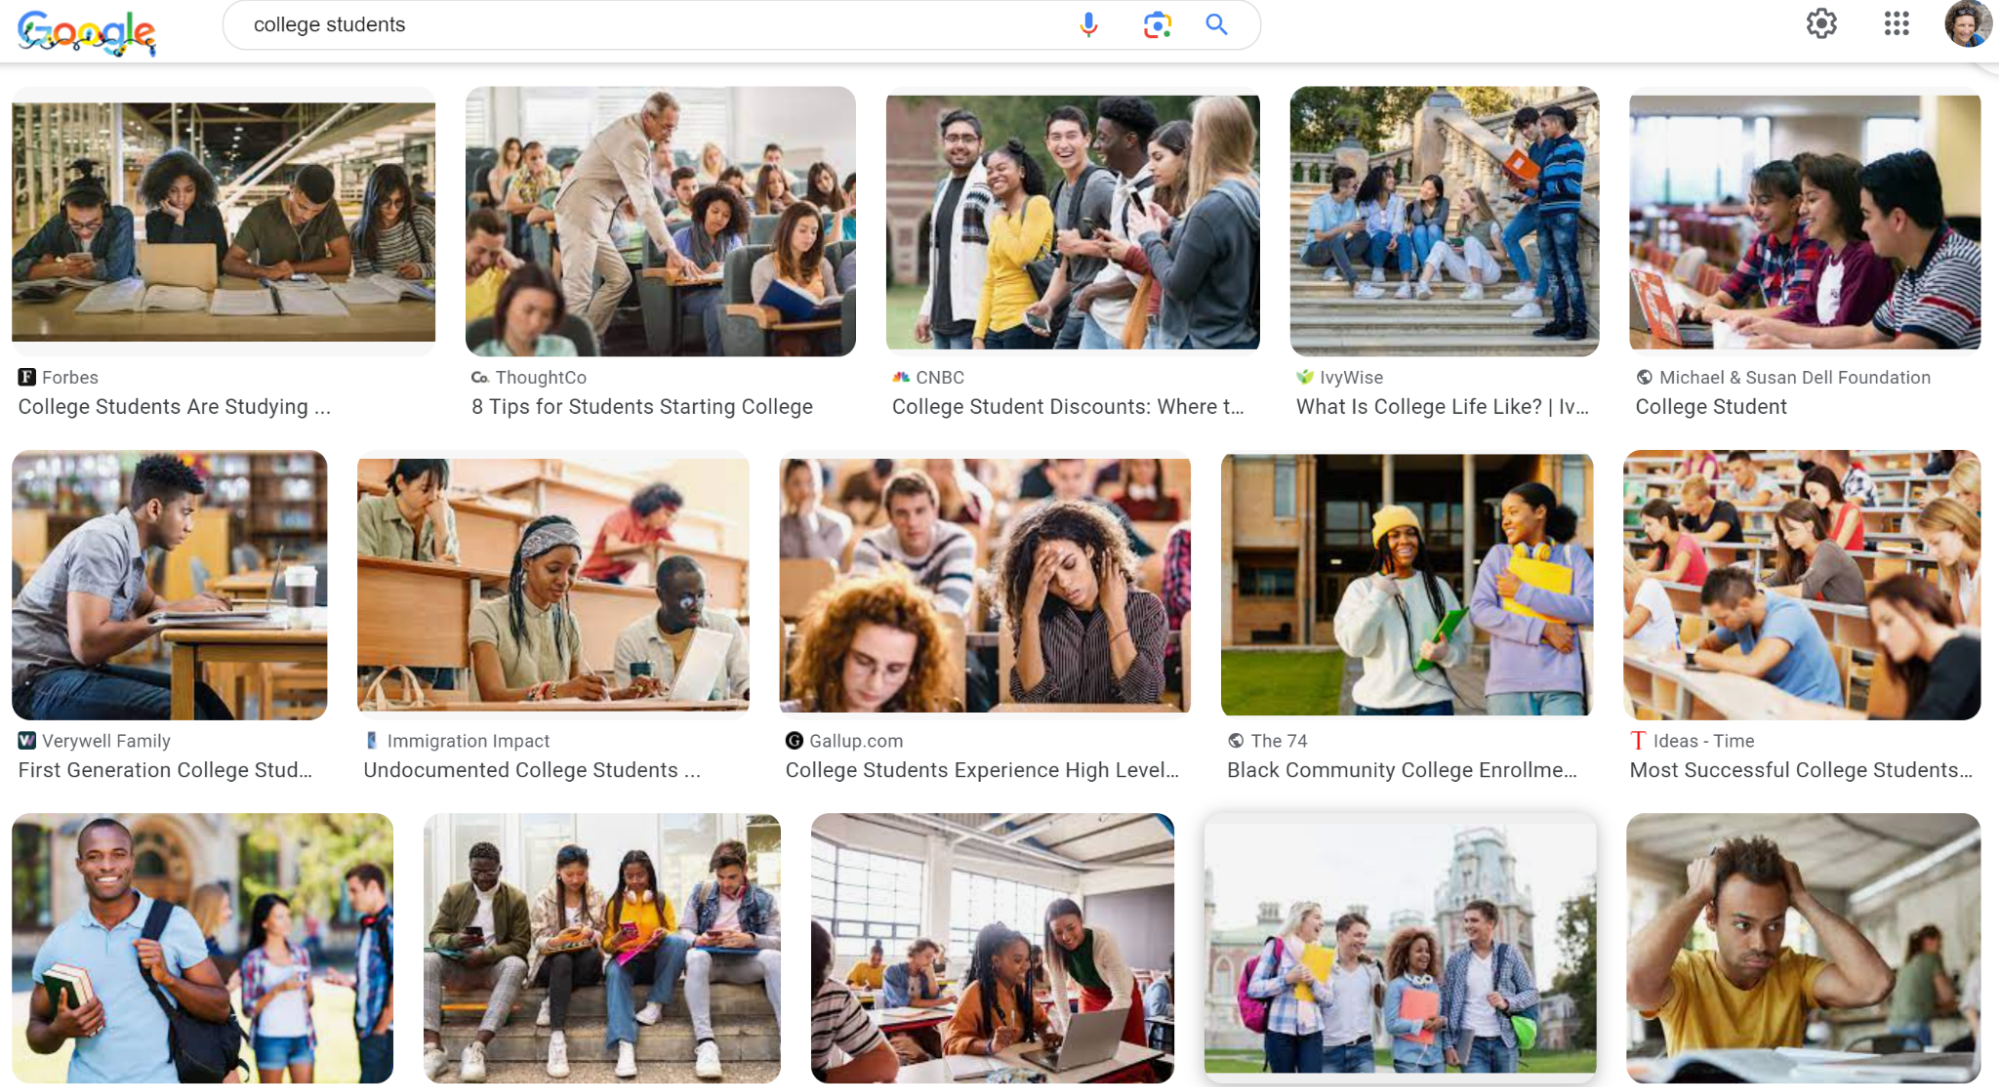
Figure 13.10. A search result for “college students” in Google Images shows mostly younger people in their late teens or early 20s.
The federal financial aid system also makes a presumption about younger college students. Requirements that students under 24 years old also submit their parents’ income when they apply for aid presume that they are still being supported by their parents. This will be discussed further in the next section.
With an increasing emphasis on post-secondary certificates and college degrees, it is helpful to know about the factors that may influence a person’s decision to enroll in postsecondary education. This could help policymakers decide on and pass effective legislation that incentivizes college enrollment and could also lead to more programs and acts designed to help those who are less likely to enroll in a degree program. For example, it has been noted that older women are less likely to enroll in postsecondary education due to the responsibility of taking care of their children. Therefore, if policymakers and education institutions are aware of this influence, they can develop programs to assist mothers who wish to enroll. One example of this may be offering a stipend to parents for use with childcare.
Differences between Certificates and Degrees
The differences between certificates, associate’s degrees, bachelor’s degrees, and advanced degrees boil down to these five factors:
- Time: How long does it take to earn the credential?
- Tuition: How many courses/units/credits will it take to obtain the credential and how much will that cost?
- Admission requirements: What the college expects your skill level to be prior to starting coursework.
- Level of study/amount of coursework: Will you study something very specific or something more general?
- Career opportunities: A certificate usually means you have completed a specialized form of training. It may demonstrate technical knowledge in a field and generally it is faster to complete than a degree. Sometimes a certificate can be a benchmark that applies toward a degree.
Associate’s degrees are commonly referred to as “two-year” degrees. There are some “career-ready” degrees such as some health and early childhood professions, information technology, and culinary arts. Associate’s degrees may also be used as a stepping stone toward some required classes for bachelor’s degrees.
Bachelor’s degrees are commonly referred to as “4-year” degrees. If you want to pursue a career or an advanced degree in teaching, engineering, architecture, business, or finance, a bachelor’s degree may be required.
Advanced degrees such as Master’s or Doctoral degrees typically require between one and six years of a combination of education, research, internships, and written publications.
Personal factors, societal influences, and social identities all seem to have influence on whether and where an individual will embark on a degree in higher education. Being a female has a positive effect on the highest educational achievement level over being a male. In terms of ethnicity, a Non-Black/Hispanic person is less likely to attend college than a Black person. If a student was home-schooled, then they are significantly less likely to attend college than if they were to attend a public high school. The higher the household income of an individual, the more likely that individual is to attend college and complete more years of schooling. All of these elements, and several others contribute to the likelihood that an individual will continue into higher education (U.S. Department of Labor Bureau of Labor Statistics, 2021). One trend noted in the age of college students is that the enrollment of students over the age of 24 is declining, while the enrollment of students under the age of 24 is increasing. One possible explanation for the decrease in enrollment for older age groups may be partially due to economic improvement (Hanson, 2021).
Determining how factors like race, age, and gender can impact an individual’s likelihood of attending college is important because research in this area can be utilized when writing policies meant to encourage enrollment for groups who are less likely to continue their education. Education is an effective way to increase human capital for a person’s self, family, and future generations. Wages and socioeconomic status follow suit and can be a tool used to lessen wealth inequality in the United States.
Family Structure and Longevity
How does education relate to family structure and longevity? First let’s look at marriage, both at likelihood to marry, and longevity of marriage.
In the 1970s, people with high school degrees and with college degrees were just as likely to get married. But that has changed over time. In 2021, while all people are marrying less, 44% of those 18 or older with a high school diploma are likely to marry, while 61% of those with a bachelor’s degree or higher are likely to marry (Mandapat et al., 2023). In addition, 78% of women with a college degree are likely to have marriages of 20 years or more (78%), compared to 40% of those with a high school education or less (Wang, 2015.). While the research tells us what is happening, it doesn’t actually tell us why it is happening. But we do know that education has a positive correlation with marriage, as shown in Figure 13.11.
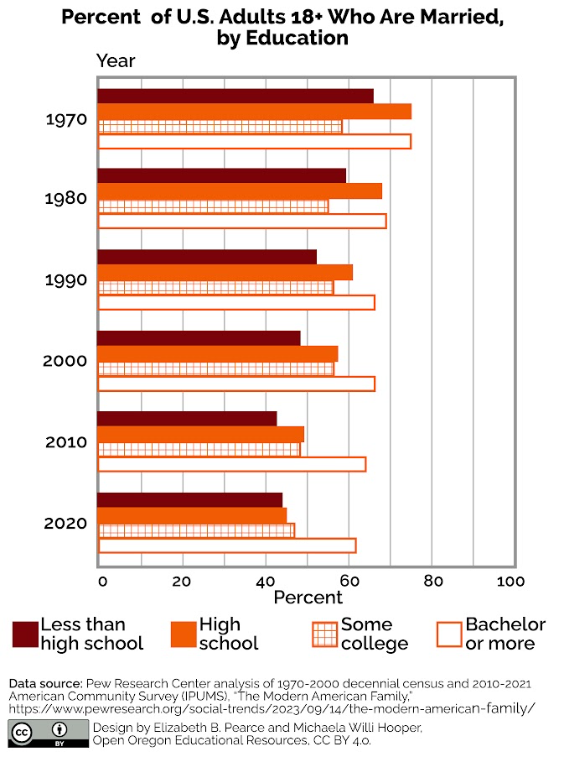
Figure 13.11. Looking at adults of 18+ years, we can see a correlation between education and likelihood of being married. The more education a person has, the more likely they are to be married. Image Description
In contrast, people seem to have fewer children the more educated that they are. In 2020, the average number of lifetime births per woman aged 40 to 44 was two births. But that average varies with education; women with high school degrees or less have an average of 2.2 children, and women with a bachelor’s degree or more average 1.8 children. All of these rates have declined since 1970 (Mandapat et al., 2023).
Figure 13.12 illustrates the link between life expectancy and education; increasingly those with a bachelor’s degree can expect to live longer lives than those without a degree. The gap between the two groups widened during the pandemic. In 2020 the life expectancy at age 25 for all adults is 58.3 years for those with a bachelor’s degree and 49.82 years for those without one (accounting for the widening mortality gap between American adults with and without a bachelor’s degree [Case & Deaton, 2023])
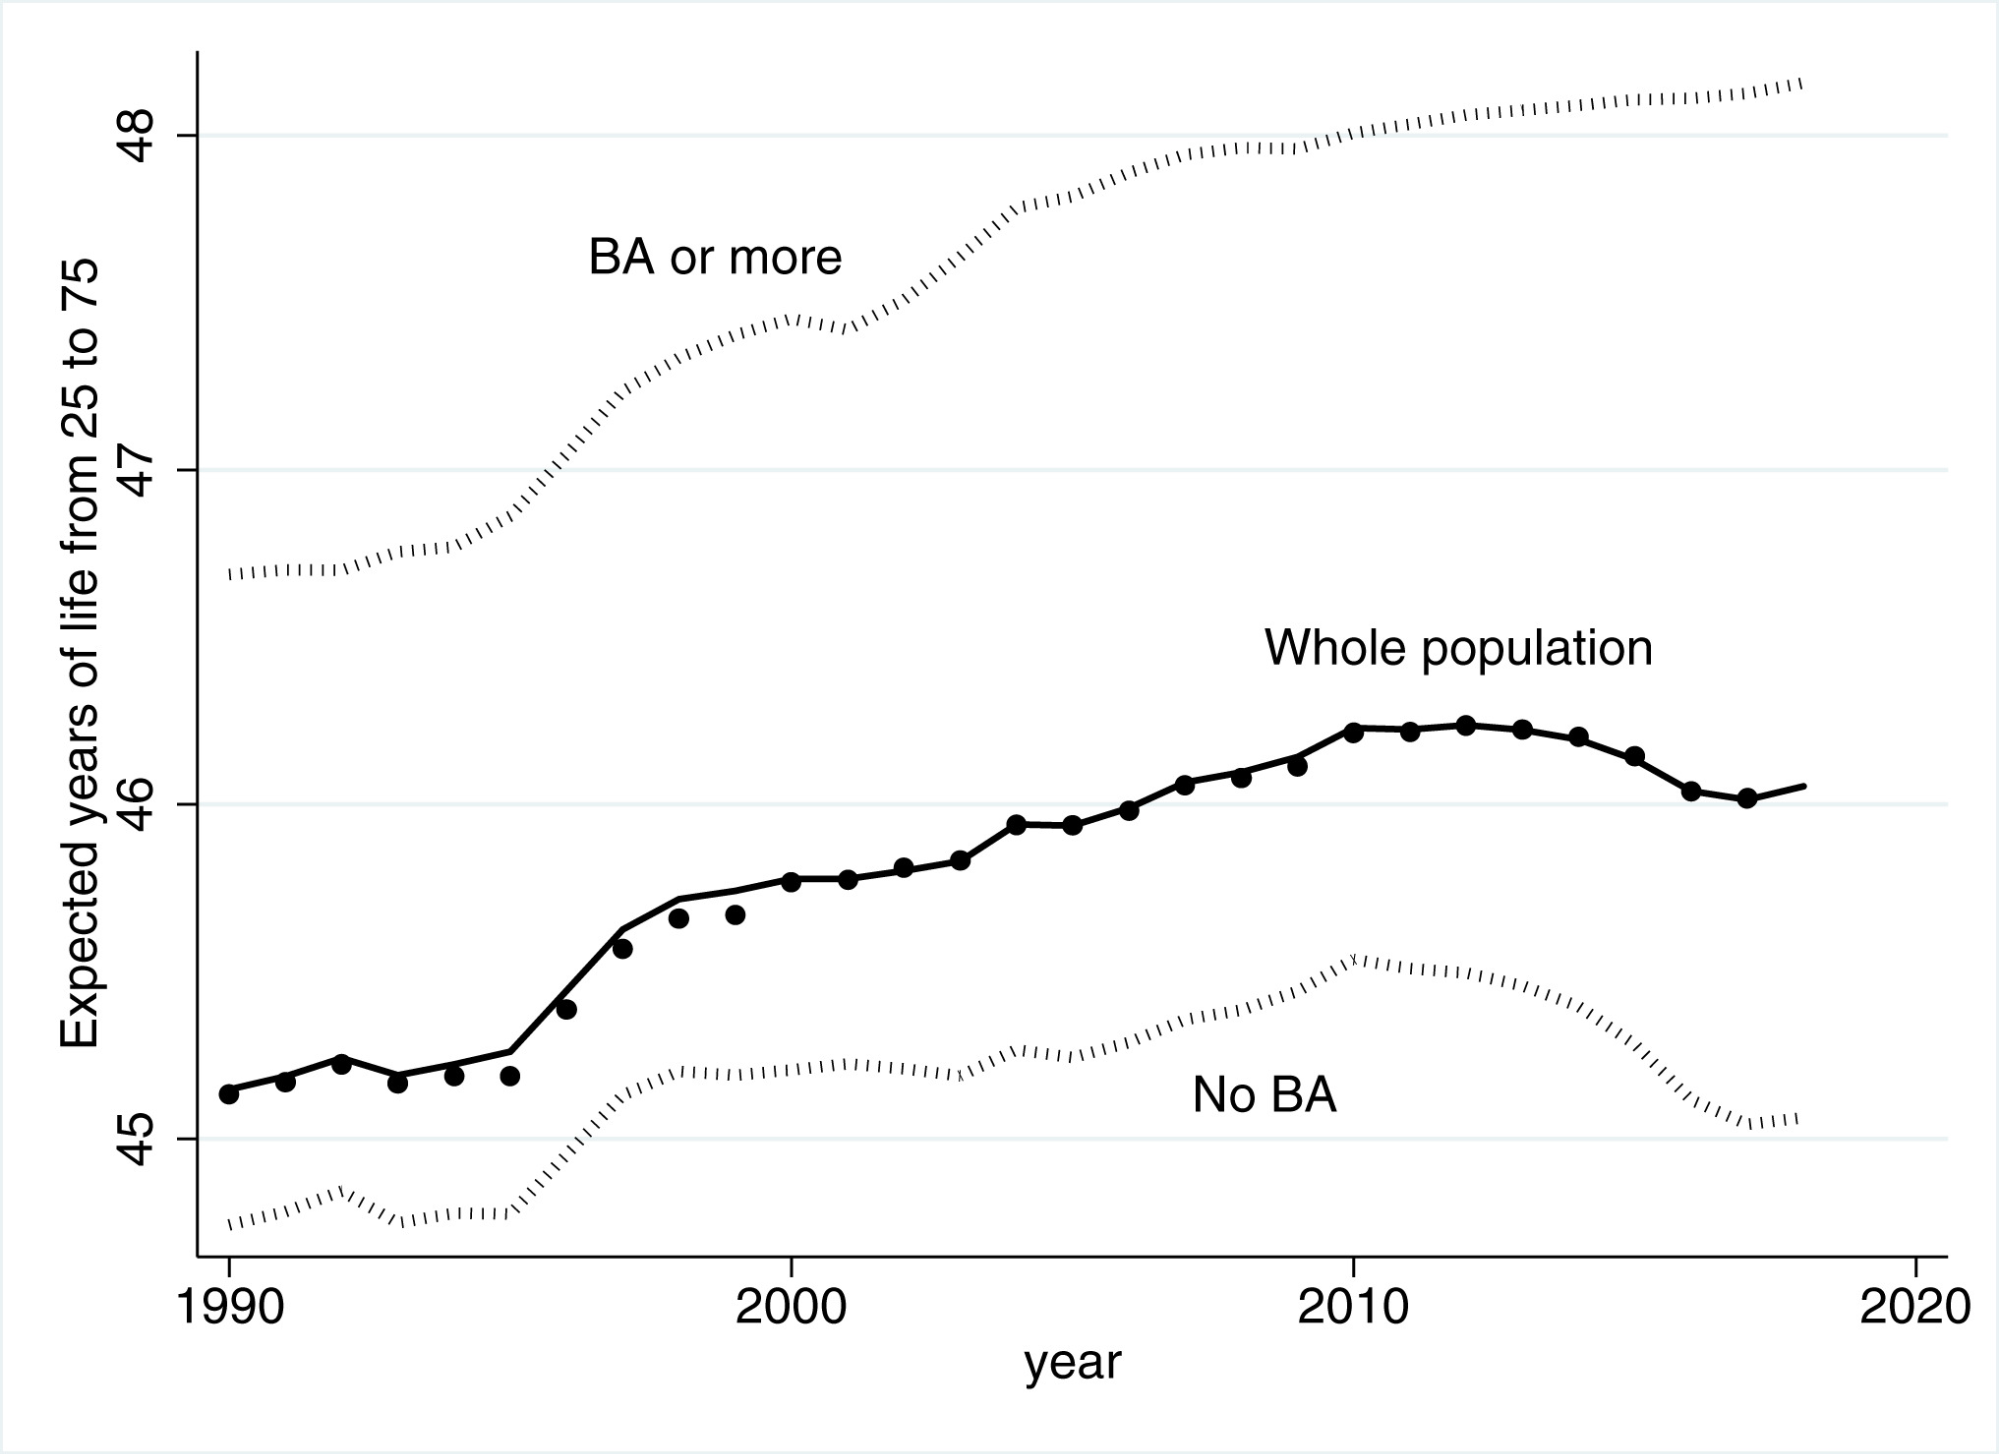
Figure 13.12. This graph shows the correlation between education and life expectancy, which is typically measured by how long people live after the age of 25. While life expectancy is dipping for those without a bachelor’s degree, it continues to rise for those with a bachelor’s degree or higher.
In this section we have discussed the relationship between family structure and longevity with education. But what about the other social factors that affect individual and family outcomes, such as ethnicity, sexuality, and socioeconomic status? As you read the following sections consider again the concept of intersectionality. Think about how social identities impact access to education and quality of education. This will help you to see how education, social identities, and family structure are all related.
College Students Who Are Also Parents
Parents who are also college students live at the intersection of two social constructions that don’t quite fit them. First, they often do not fit the demographic of the “traditional college student,” which the Stanford Center for Education Policy Analysis describes as “someone who begins college immediately after high school, enrolls full-time, lives on campus, and is ready to begin college level classes” (Deil-Amen, 2011). While community colleges have long served this student population, universities are more recently adapting to this student group and the ways that their needs differ.
Secondarily student parents may not fit the socially constructed family ideal either, at least in terms of how a paying job or career fits into their family life. They are likely to have a family where “all adults are working” meaning that whether single or coupled, someone(s) has paid employment in addition to a college career. This creates immediate conflicts in prioritization, because they are not only “balancing work and family” but likely “school, work, and family.”
The COVID-19 pandemic hit this group of families particularly hard as their multiple work, schooling, and children’s environments collided. Many students, including parents, work in lower-paying industries while going to school to better their situations for themselves and their children. Those settings and jobs were often eliminated when locations such as restaurants, bars, and other service industries were shut down. In other cases work at places such as food production and canning, grocery stores, or medical settings were still open but brought higher risk of infection. Schools from childcare settings to college settings were unpredictable in their hours and services. Student parents were, and to some extent, continue to be, in a constant state of planning, responding, and trying to survive in environments compounded by uncertainty.
Generational Inequities in Education
When we examine how our students perform in school—how many grades students attend school; whether they can read, write, reason critically, or use computers; whether they graduate from high school or end up at NASA or being brain surgeons—we see a difference between wealthy White male students and those who are not. The achievement gap refers to any significant and persistent disparity in academic performance or educational attainment between different groups of students, such as White students and students of color, for example, or students from higher-income and lower-income households (Great Schools Partnership, 2013).
The achievement gap between women and men is closing. Colleges and universities in the United States enroll at least as many women as men and more women than men appear to be graduating (Parker, 2021). However, differences in educational outcomes persist when you examine the trends using race and class. When you apply intersectional analysis to education, such as students who are poor, LGBTQ+, or in other minoritized groups, the differences in outcomes become even more pronounced. And it is clear that the socioeconomic status, as well as aspects of identity are passed down through generations of families.
Federal Student Aid and Loans
Let’s talk about how a college student’s family structure and legal ties affects federal student aid and loans. Whether or not you have qualified for federal grants and loans, the system affects you, and the authors expect that you know this quite well.
The federal aid system makes some assumptions about families: first, that parents will always pay for the education of their children if the children are younger than 24 years. Conversely, they consider a child who is 24 years or older to be “independent” and that their parents will not be contributing to their education. Making this distinction leads to the government considering the parents’ income and accumulated wealth when it comes to awarding financial aid, but only when students are younger than 24 years. Right away, we can see some flaws and inequities in this regulation. Some parents will pay for education regardless of the child’s age; others will not. Some families have accumulated wealth over generations of privilege; others may have gone without necessities to set aside savings for a health care crisis or retirement. (All wealth is not created equally). This rule does not recognize the nuances of the parent-child relationship or the privilege and oppression that contributes to the attainment of wealth and savings.
The federal aid system also differentiates between married couples and cohabiting or common law relationships. It presumes that a married couple combines their resources and that a cohabiting couple does not; so marrying a partner who has a higher income will likely lessen a financial aid award, while cohabiting with them will not.
Student debt, the remaining payments on loans that students take to afford college, is becoming an increasingly common issue for graduates and for people who do not complete a degree. College costs have increased dramatically in the past 40 years, and student debt rates have followed. Does student debt influence the likelihood of marriage? Because many wish to be financially stable before marrying, it is possible. Anecdotal reports and news stories indicate that people are delaying marriage based on student debt loads. Studying this is complicated, but one demographic review found that women were more likely to put off marriage when they had student loans to repay (Bozick & Estacion, 2014).
Educational Debt, Not Achievement Gap
Achievement gaps based on social location persist. As researchers and community members, we can note the facts, but the more important question is why? Understanding the complex causes of this persistence may help us act in ways that will close the gap. If our education is intended to be universal, all students must have equal access and outcomes not based on social identity or social location.
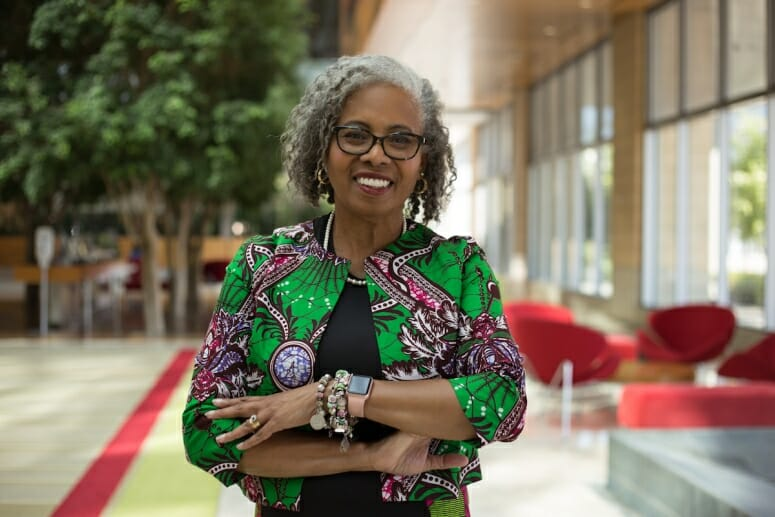
Figure 13.13. Dr. Gloria Ladson-Billings, educator and educational researcher, argues that we need to examine educational debt, rather than focusing on the achievement gap.
Gloria Lasdon-Billings, an educator and an educational researcher (Figure 13.13), is the president of the American Educational Research Association. In her presidential address of 2006, she examines the achievement gap and explores what makes the most effective teacher, particularly those teachers who can close the achievement gap for Black students. If you would like to learn more about her, read this article: Gloria Ladson-Billings: Daring to Dream in Public.
In her 2006 presidential address, Ladson-Billings argues that researchers should study educational debt rather than the achievement gap. Educational debt is the cumulative impact of fewer resources and other harm directed at students of color. This education debt includes economic, sociopolitical, and moral characteristics (Ladson-Billings, 2006).
Economically, educational debt consists of unequal spending in education over centuries. Segregation supported economic inequality in education. Today, because schools are funded based on population and property tax revenues, schools in rich neighborhoods, which are more likely to be White, spend more on each individual child’s education.
People of color are less likely to be involved in decision-making in school districts, state houses, and the federal government. For example, in 2018, 78% of school board members were White, even though 50% of all public school students are not White (Bland, 2022; National School Boards Association, 2018). Families of color are excluded from power in education.
Ladson-Billings argues that the achievement gap is a result of educational debt. Further, educational debt is caused by the wider social forces of systemic racism, poverty, and health inequities rather than the cause of the inequality itself (Ladson-Billings, 2006). If you want to learn more about the experience of educational debt, please watch “How America’s Public Schools Keep Kids in Poverty [TED Video].”
Licenses and Attributions for Post-Secondary Education and Families
Open Content, Original
“Family Structure and Longevity” by Elizabeth B. Pearce. License: CC BY 4.0.
“College Students Who Are Also Parents” by Elizabeth B. Pearce. License: CC BY 4.0.
“Federal Student Aid and Loans” by Elizabeth B. Pearce. License: CC BY 4.0.
Figure 13.10. “What Google Thinks College Students Look Like” by Elizabeth B. Pearce. License: CC BY 4.0.
Figure 13.11. “Percent of US Adults 18+ Who Are Married by Education “ by Elizabeth B. Pearce and Michaela Willi Hooper, Open Oregon Educational Resources. License: CC BY 4.0. Based on data from Pew Research Center analysis of 1970-2000 decennial census and 2010-2021 American Community Survey (IPUMS), “The Modern American Family”
Open Content, Shared Previously
“Post-Secondary Education and Families” and “Differences between Certificates and Degrees” are remixed from two sources: “Who Attends College?” by Abigail Knowles, Jon McCann, Rachel Newell, and Kyle Hurley from “Education: The Great Equalizer.” License: Creative Commons Attribution 4.0. “Choosing a College to Attend” by Alise Lamoreaux from “Blueprint for Success in College and Career.” License: Creative Commons Attribution 4.0 International License. Adaptations: edited for brevity. Additions: focus on age of college students; master’s and doctoral degrees; family; equity.
“Generational Inequities in Education” and “Educational Debt, Not Achievement Gap” adapted from “Models of Education” by Kimberly Puttman License: CC BY 4.0. Adaptations: selection of excerpts; light editing for brevity.
Figure 13.12. “Expected Years of Life 25 to 75 by BA Status” by PNAS. License: CC BY-NC-ND 4.0.
All Rights Reserved Content
Figure 13.13. “Image of Gloria Ladson-Billings” by Marcus Miles from “Gloria Ladson-Billings: Daring to Dream in Public” by Käri Knutson, University of Wisconsin-Madison. License: Fair Use.
References
Case, A. & Deaton, A. (2023, September 27). Accounting for the widening mortality gap between American adults with and without a BA. (n.d.). Brookings. https://www.brookings.edu/articles/accounting-for-the-widening-mortality-gap-between-american-adults-with-and-without-a-ba/
Bland, M. (2022). School Boards’ Diversity Problem Goes Deeper Than You Realize. Education Week. https://www.edweek.org/leadership/opinion-school-boards-diversity-problem-goes-deeper-than-you-realize/2022/04.
Bozick, R., & Estacion, A. (2014). Do student loans delay marriage? Debt repayment and family formation in young adulthood. Demographic Research, 30, 1865-1891. https://doi.org/10.4054/DemRes.2014.30.69
Deil-Amen, R. (2011, November). The Traditional” College Student: A Smaller and Smaller Minority and its implications for Diversity and Access Institutions. Paper prepared for the Mapping Broad-Access Higher Education conference, Stanford University. https://cepa.stanford.edu/conference-papers/traditional-college-student-smaller-and-smaller-minority-and-its-implications
National Center for Education Statistics. (2023). College Enrollment Rates. Condition of Education. U.S. Department of Education, Institute of Education Sciences. https://nces.ed.gov/programs/coe/indicator/cpb.
Great Schools Partnership (2013). Achievement Gap Definition. The Glossary of Education Reform. https://www.edglossary.org/achievement-gap/.
Hanson, M. (2021, January 22). College enrollment statistics [2022]: Total + by demographic. Education Data Initiative. https://educationdata.org/college-enrollment-statistic
Heffernan, Julie and Gutierez-Schmich, Tina, 2020 Oregon Safe Schools Report, Report page. (n.d.). OSSCC. https://www.oregonsafeschools.org/report-page
Ladson-Billings, G. (2006). From the achievement gap to the education debt: Understanding achievement in U.S. schools. Educational researcher, 35(7), 3-12. https://thrive.arizona.edu/sites/default/files/From%20the%20Achievement%20Gap%20to%20the%20Education%20Debt_Understanding%20Achievement%20in%20US%20Schools.pdf.
Mandapat, C. A., Parker, K., Greenwood, S., Baronavski, C. & Carlo, J. (2023, September 14). The modern American family. Pew Research Center’s Social & Demographic Trends Project. https://www.pewresearch.org/social-trends/2023/09/14/the-modern-american-family/
Parker, K. (2021). What’s behind the Growing Gap between Men and Women in College Completion? Pew Research Center. https://www.pewresearch.org/fact-tank/2021/11/08/whats-behind-the-growing-gap-between-men-and-women-in-college-completion/#:~:text=Young%20women%20are%20more%20likely,adults%20ages%2025%20to%2034.
Wang, W. (2015). The link between a college education and a lasting marriage. Pew Research Center. https://www.pewresearch.org/short-reads/2015/12/04/education-and-marriage/