
1.2 The Family: A Socially Constructed Idea
To begin our study of contemporary families in the United States, we will first define an important concept that is used for a large portion of this book: social constructions. A social construction is a mutual understanding and accepted reality created by members of a society rather than determined by biology or the natural world.
Is there anything that humans have created that holds no real value in the natural world, yet has a great deal of value assigned to it? If you are thinking of cash, you’re right on the money (Figure 1.1). Humans have determined that certain pieces of paper and metal objects are worth an agreed-upon value. One of the ways that we can tell money is a social construction is that it varies from culture to culture and over time. When you visit another country, the United States dollar bill has to be “exchanged” for money that has a different appearance and value.

Figure 1.1. Social constructions create meaning that is shared among members of society.
Social constructions also relate to behavior and activities. For example, what food would you expect to see on the menu when you go out for breakfast in the United States? What if the eating place were described as a “Mexican” restaurant? And what if you traveled to another country, like Korea? What is eaten for breakfast varies from culture to culture and even from person to person. And yet, in general, we have a socially constructed idea of what is typically breakfast food in the United States: eggs, bacon, cereal, toast, and fruit, but not vegetables, noodles, pinto beans, or hot dogs.
One of the ways that you can recognize that something is a socially constructed idea is that it differs from place to place and changes over time. In addition, whatever is part of the socially constructed idea (in this case, what typical breakfast foods are) becomes “the norm” or what is expected. While we might welcome trying some different foods for breakfast, they are not seen as the typical or expected American breakfast foods (Figure 1.2).

Figure 1.2. A breakfast taco; eggs, bacon, strawberries, and a sweet potato rosti; and steamed buns represent a variety of breakfasts that are common around the world.
What does this have to do with families? While studying families, we must continually remind ourselves that the idea of the family, and in particular the internalized belief that there is a “normal family,” is a social construction. What is a normal family? I suspect that we can each paint a picture in our heads based on the years we have been exposed to portrayals of families in institutions such as the media, schools, government, and health care.
Generally, the traditional American family has been identified as the nuclear family, most often represented as a male-and-female heterosexual married couple who is middle class, White, and with several children. When society or the individuals within a society designate one kind of family to be traditional, this may imply a value, or a preference, for this family structure with these particular social characteristics, which are the traits that are biologically determined and/or socially constructed. Examples include sex, gender, race, ethnicity, ability, age, sexuality, nationality, first language, and religion.
The nuclear family is sometimes called the Leave It to Beaver family after the popular sitcom television show that ran from 1957 until 1963 (Figure 1.3, left). A more current popular sitcom, Modern Family, which concluded its 11th and final season in 2020, features this traditional family as well, but it also includes two other families that feature people of other ethnic groups and a same-sex couple (Figure 1.3, right). Together, they form an extended family living in the same town. It is important to note, however, that our culture continues to emphasize the upper-middle-class White family image.
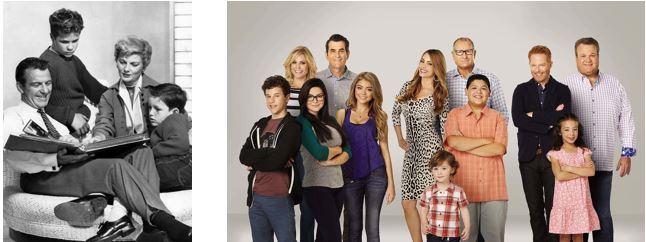
Figure 1.3. TV families in the 1950s and today.
Equity, Equality, and Fairness
You will notice that this text often refers to equity rather than equality or fairness. We define equity as everyone having what they need, acknowledging that systemic inequities have affected people differently, and working to ensure that all members of society have access to the same opportunities and outcomes. The drawing in Figure 1.4 illustrates the difference between equity and equality. Take a few minutes to view different variations of this concept as memes on social media.
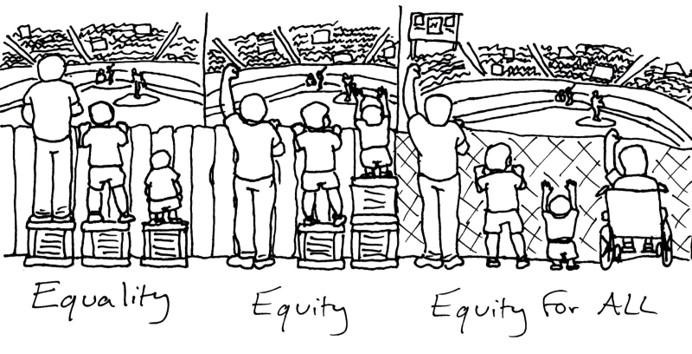
Figure 1.4. Equity means giving some people more (like an additional box to stand on) so that they can have the same experience. Barriers are removed to create true equity for all.
All families need equitable resources, but sometimes experiences and structures get in the way. In the first panel of the drawing, all participants have equal-sized boxes, but they do not all get to have an equal experience. In the second drawing, the participants can have the viewing experience because the boxes have been equitably distributed. And in the third panel, the structure that limited equitable access in the first place—the fence—has been removed so that all participants can view the game without additional resources.
In this text, we study American families with an emphasis on the current inequities in the United States. To help us understand the socially constructed nature of our view of the family and the systems that affect families, we take a comparative approach (American Sociological Association, 2020). This means that, while our focus is current American families, we will also look at how families have evolved in America, what the practices are of immigrant cultures in America, and how other countries develop systems that affect families. We also utilize empirical research, which refers to data that are collected in a variety of ways, analyzed, and presented to further our understanding.
21st-Century American Families
Scholars, as well as the general public, have multiple viewpoints about the meaning of families within society. While families have evolved, so have the ways each of us think about our own family, as well as how we think about how families should and could interact within themselves and with social structures (the organization of institutions within society); this affects the ways individuals and families interact together.
While we are studying families, it is important to note the concept of kinship, the social structure that ties people together (whether by blood, marriage, legal processes, or other agreements) and includes family relationships. While definitions vary, it is widely agreed that the term kinship is broader than the term family. Kinship acknowledges that individuals have a role in defining who is a member of their own family and how familial relationships extend across society.
What are families in the United States like today? Because we are constrained by both our personal experiences and the societal representations of “typical families,” it is important to talk about what kinds of kinship structures and changes are actually occurring. At times, the study of families has been referred to as the study of “the family.” This text avoids that terminology because we are studying many types of families.
In order to describe current American families and kinship structures, it is probably easiest to compare them with families of the past and families in other countries. Demographics—statistics related to populations and designated social characteristics—help us to understand how identities and family structures are related. Let’s see what some of the biggest trends are in terms of family structure. The following graphs and descriptions give a snapshot of demographic changes over time and current kinship patterns:
Changes in Children’s Living Arrangements
Increases in children living with a single parent and with cohabiting parents between 1960 and 2014 are shown in Figure 1.5. This chart illustrates the changes in partnering and parenting arrangements that adults have made and the ways they affect where children live. Right away, you can see that there is no longer a “typical” kind of parenting arrangement but rather a range of ways that people parent and create families.
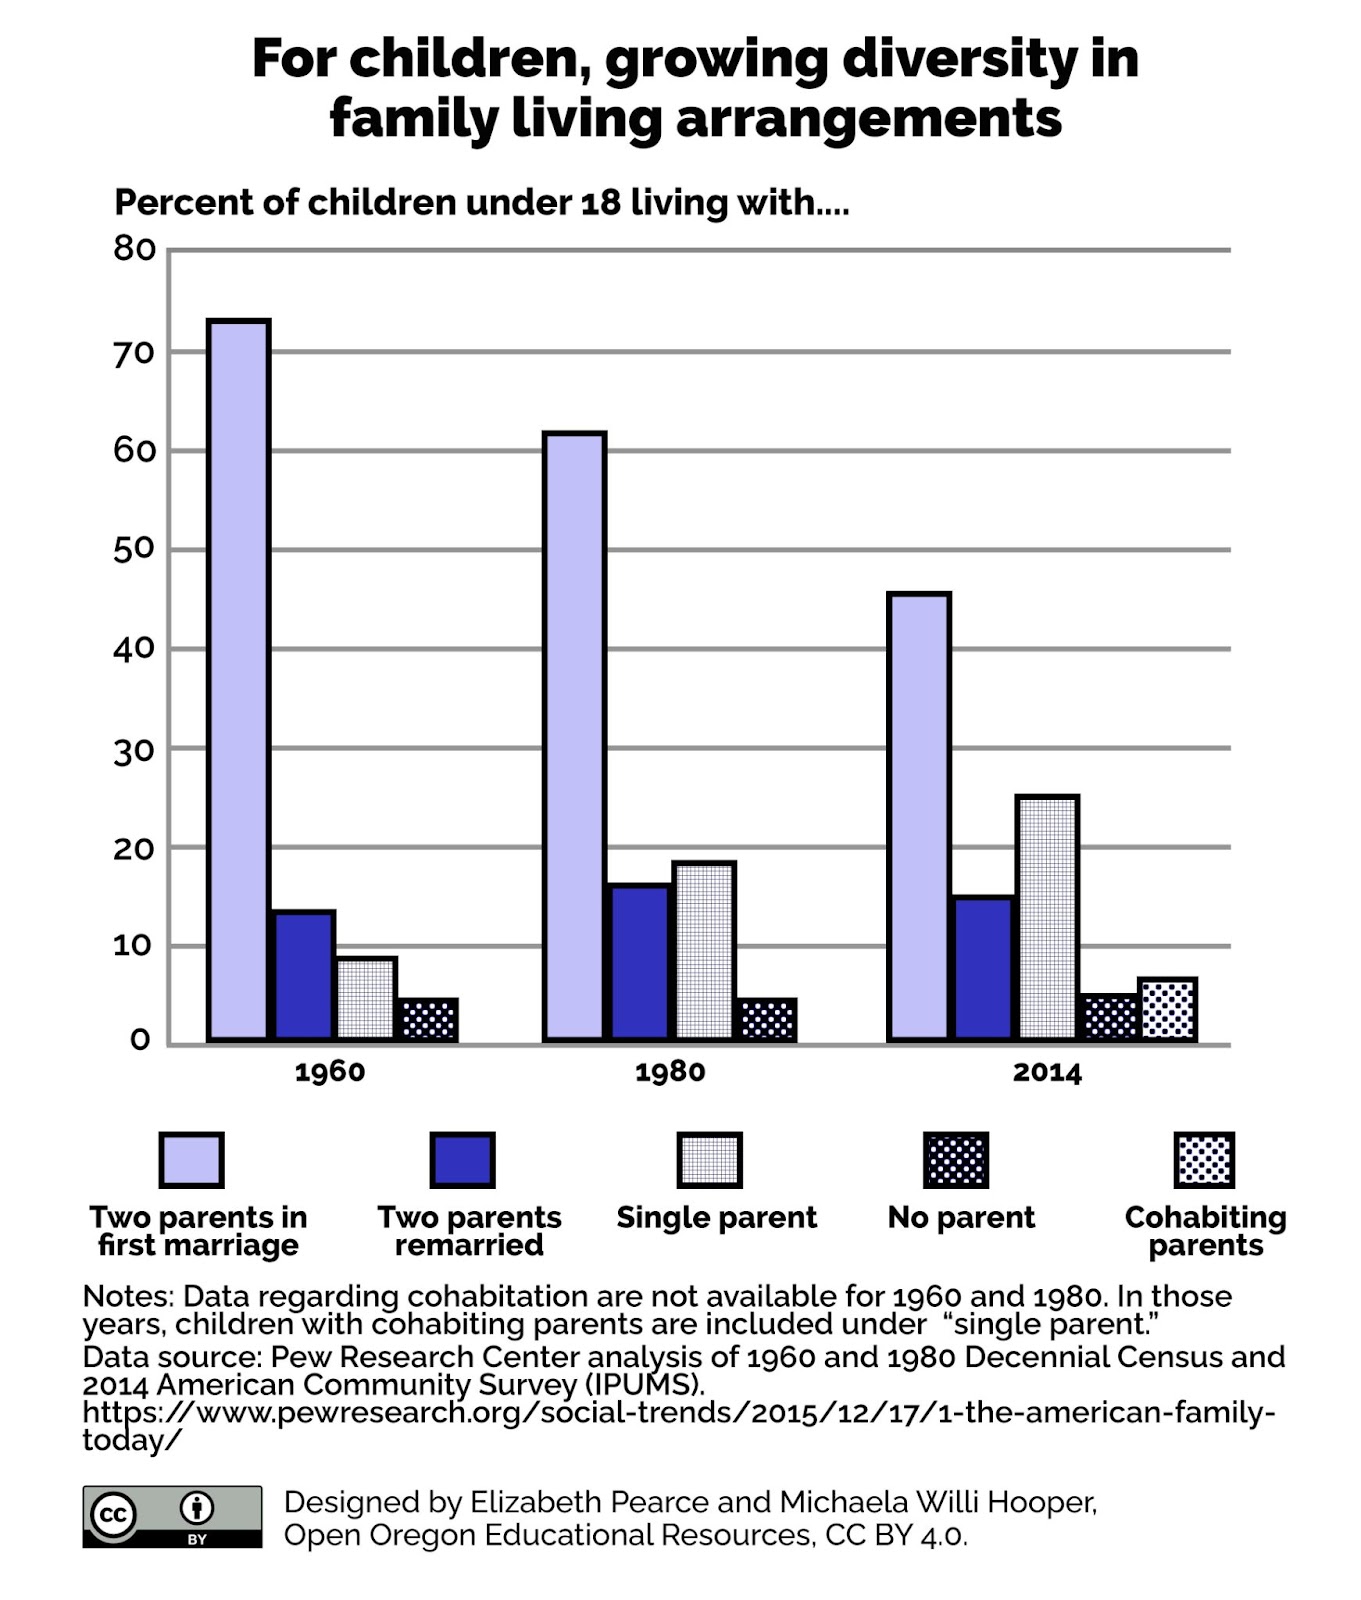
Figure 1.5. This chart shows a growing diversity in family living arrangements. Data from Pew Research Center. Image description.
Data for cohabitation was not available in 1960 and 1980 but was added in the 2014 data; children living with cohabiting parents in 1960 and 1980 were included in the group “single parents.” Can you think of any other parenting arrangements that could be added to data collected in the 2020s?
Declining Marriage
People in the United States are marrying later in life, and people who never marry are also increasing. This leads to a trend called “declining marriage.” The share of adults 18 and older who have never married has increased from 17% in 1970 to 31% in 2021 (Mandapat et al., 2023). Figure 1.6 shows the increase for both men (blue) and women (red) in the median age of first marriage between 1890 and 2022. Consider family and friends that you know who are married. How similar or different are they from the trends shown?
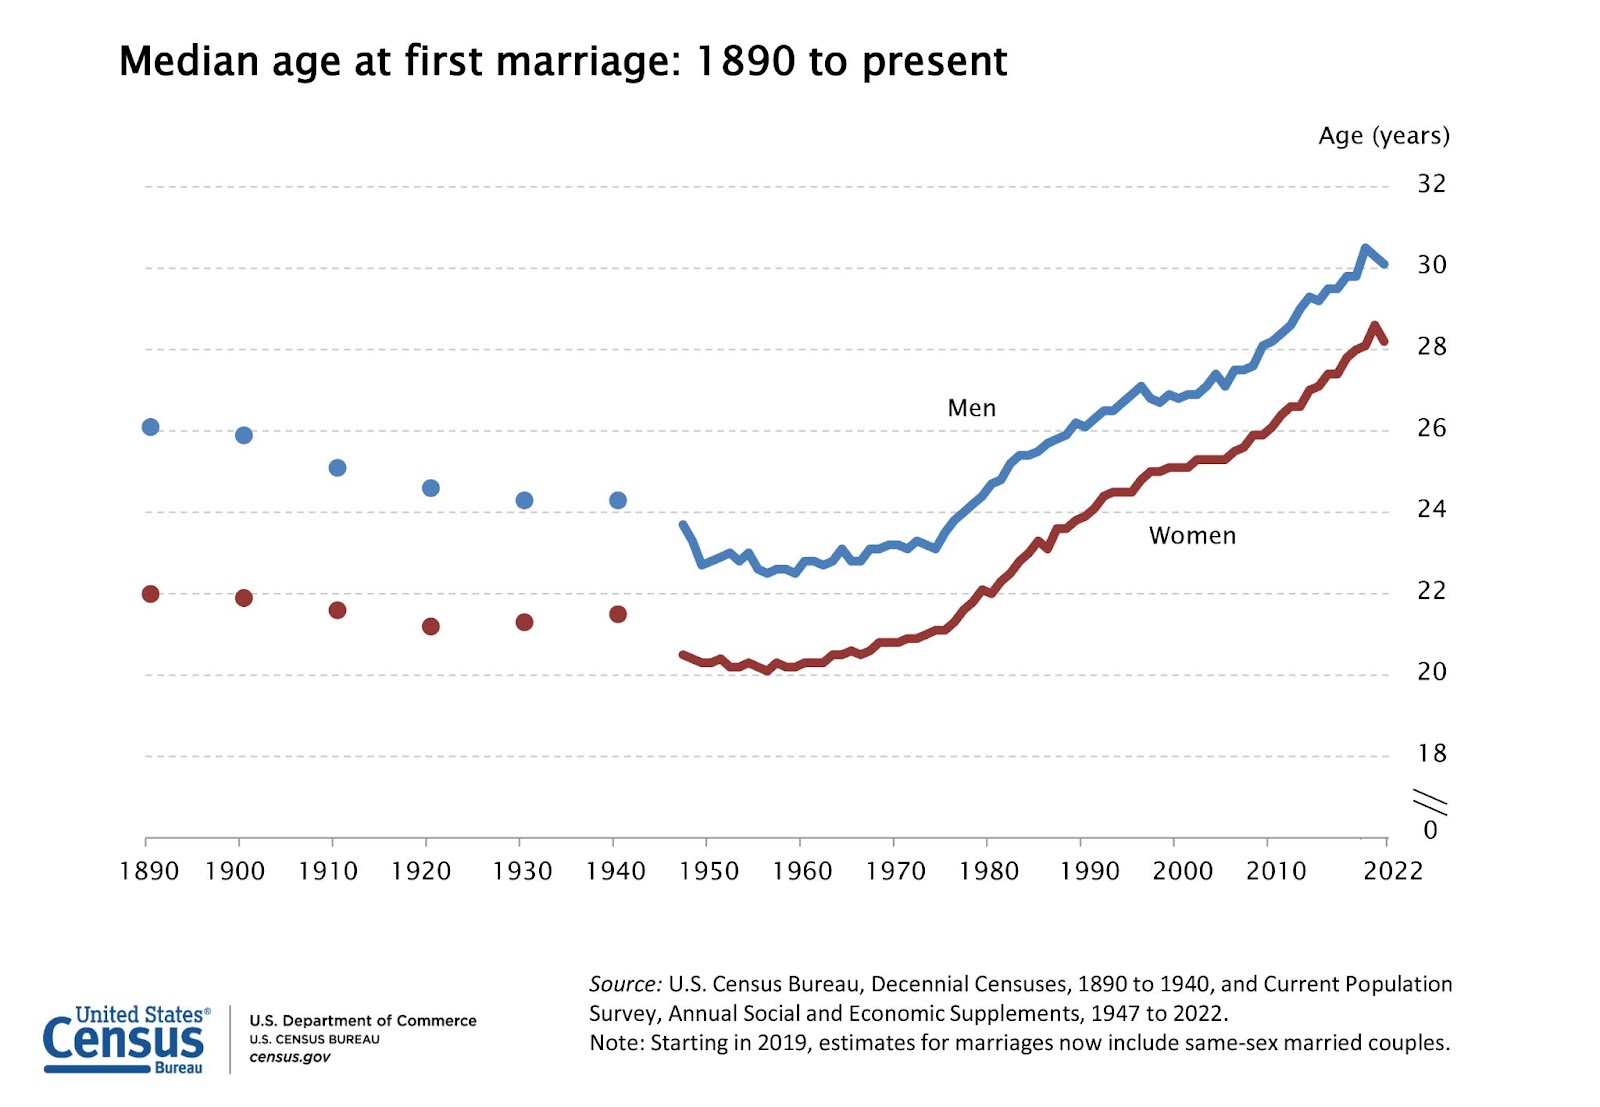
Figure 1.6. A U.S. Census Bureau graph showing the age of first marriages going up since the 1950s. Image description.
At the same time, some kinds of marriage are increasing. For example, between 1970 and 2022, the percentage of people who marry interracially and interethnically (together called “intermarried”) has increased from 4% to 16% (Mandapat et al., 2023). And since same-sex marriage became legal in 2015, these marriages have increased from 0.7% to 1.1% in 2022.
Declining Divorce
Although you may often hear that the divorce rate is increasing, it has actually been declining since 1990. But remember, that marriage is declining as well! In the chart in Figure 1.7, you can see that the marriage rate (red) is declining a bit faster than the divorce rate (white), which is one of the factors that makes it appear as if divorce is increasing. It’s actually declining, just at a slower rate than marriage itself is declining.
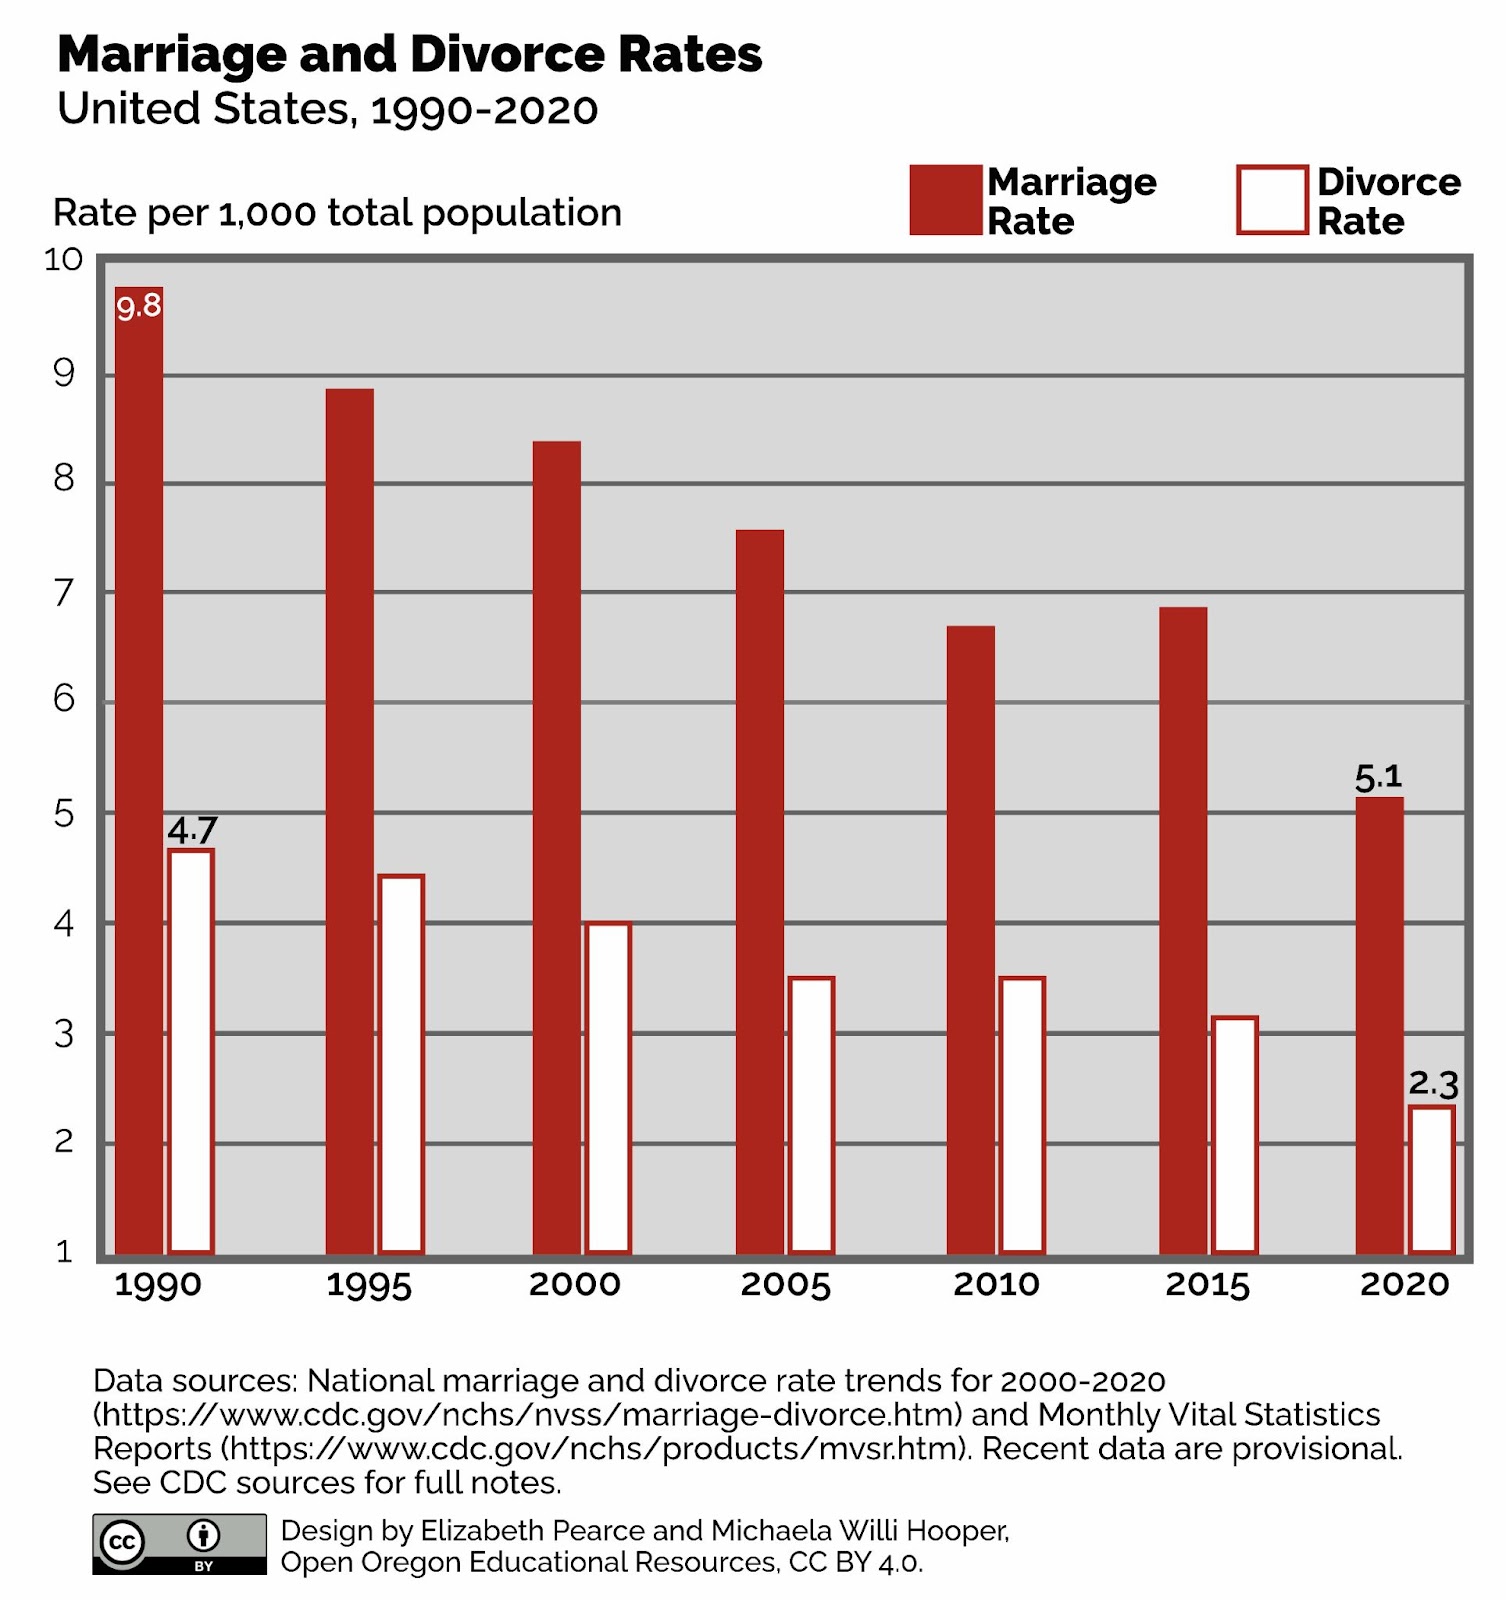
Figure 1.7. Marriage and divorce rates have gone down since the 1990s. Data from Statistical Abstract based on the U.S. Census. Image description.
In Chapter 3, which focuses on the intimate relationships that people form with one another, we will look at both marriage and divorce rates more closely.
Declining Fertility Rates and Birth Rates
There are fewer babies being born in the United States. The decline is measured following the “Baby Boom” years between approximately 1946 and 1964, as shown in Figure 1.8.
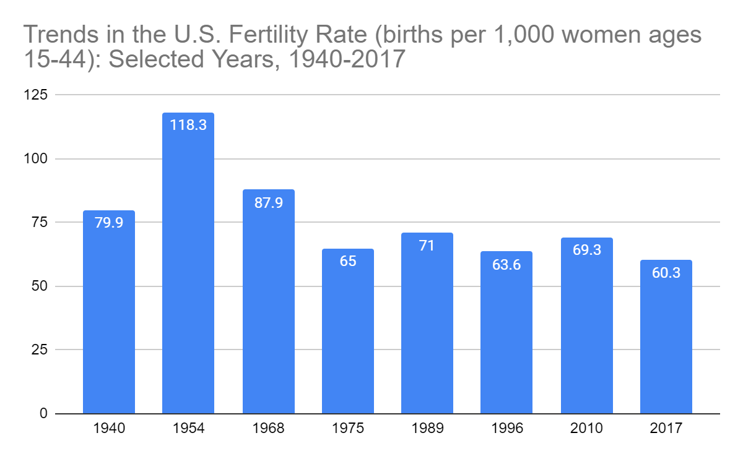
Figure 1.8. Fertility rates in the United States have declined since peaking in 1954.
There are several factors within these declining rates, including that people who want to have children are less likely to be able to have children. Why is this? We will look at related social, economic, and biological factors in Chapter Four.
Multigenerational Households
Multigenerational living includes families with two or more adult generations living together as well as families that have grandchildren under age 25 and grandparents living together. Figure 1.9 illustrates the trend of multigenerational living in the United States (Pew Research, 2018).
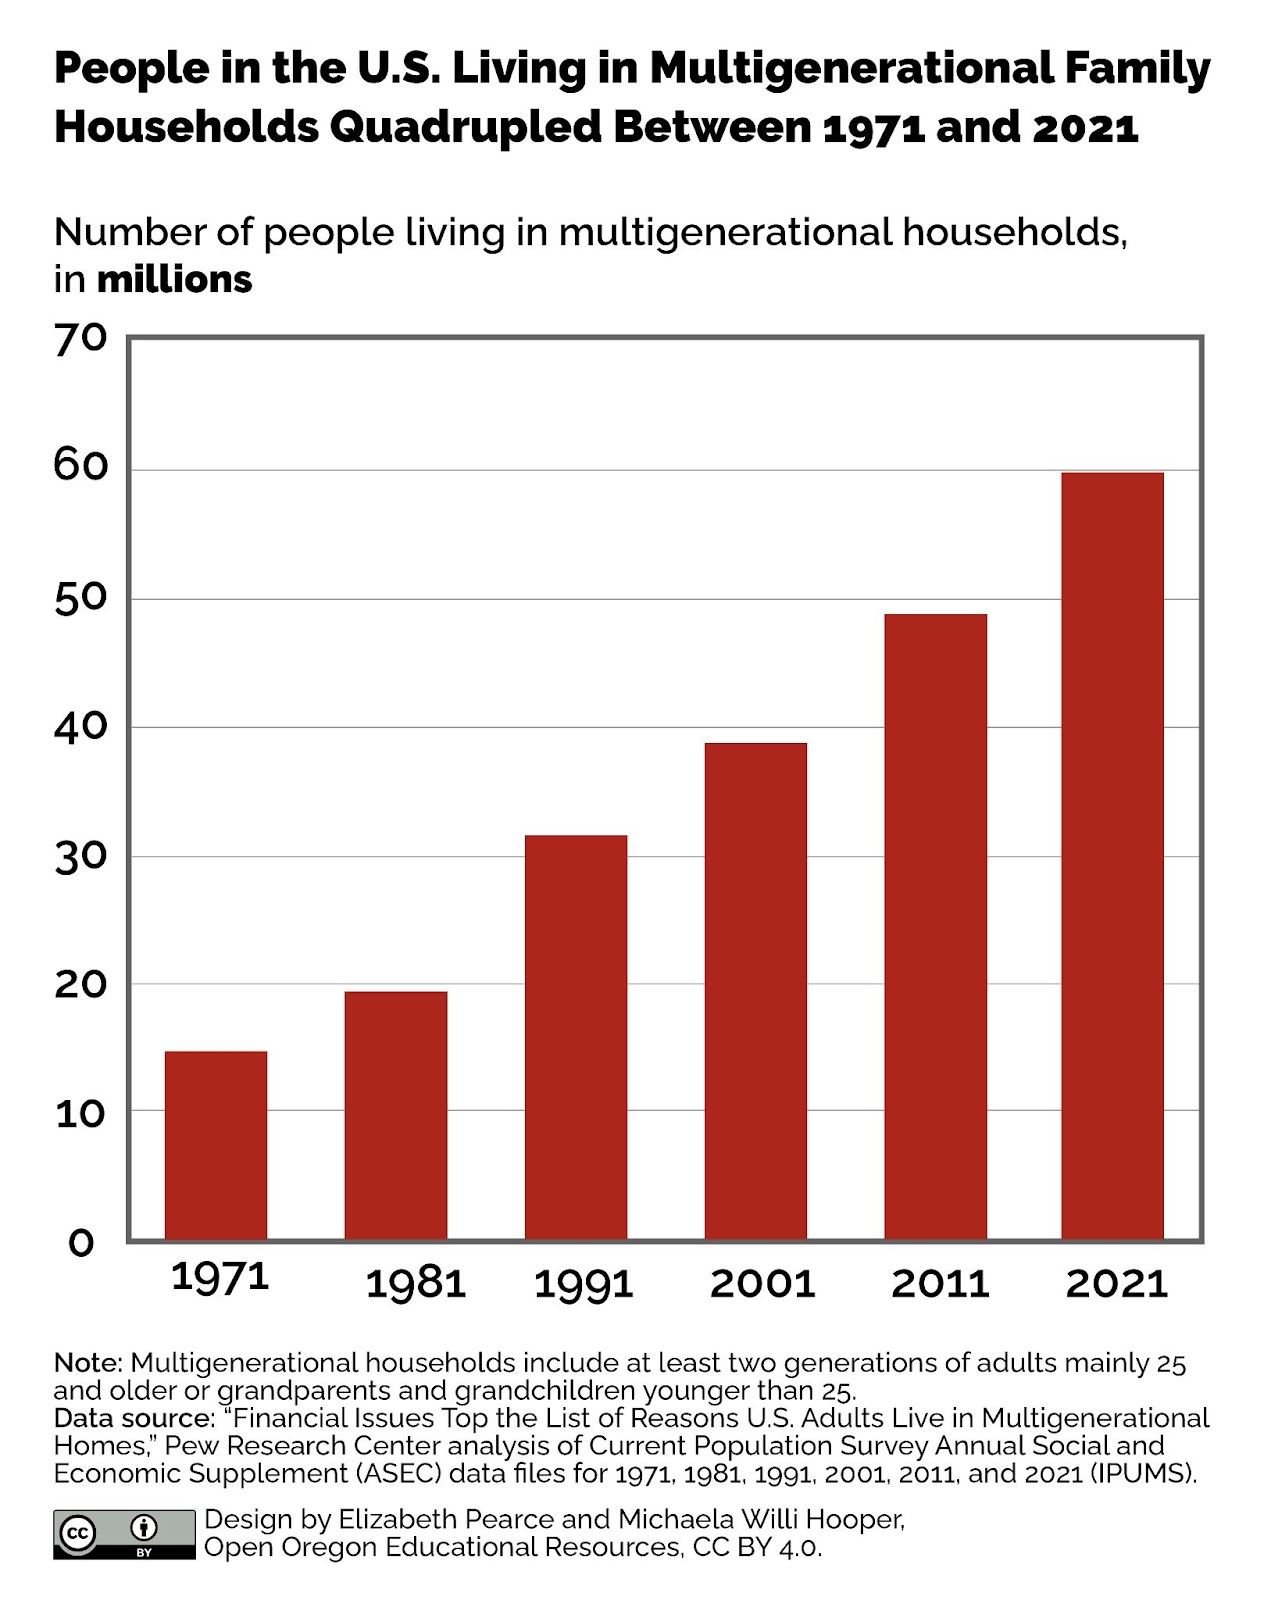
Figure 1.9. The number of Americans who live in multigenerational households continues to increase. This graph is based on data from the U.S. Census Bureau and the 2000–2016 American Community Survey. Image description.
This style of living hit a low of 12% of all families in the United States in 1980. Since then, multigenerational living has increased in most racial and ethnic groups, age groups, and genders. What factors do you think may have contributed to this increase?
Longer Working Lives
Beneficial trends such as longer life expectancy and being healthier longer affect people’s decisions to work longer. Less beneficial trends such as concern about having adequate health care coverage, fewer jobs offering associated pensions, and the increasing number of workers who have multiple part-time jobs also affect this trend. These factors, along with the increases in the cost of living, have contributed to the middle class shrinking.
The graph in Figure 1.10 shows differentiation by gender and by education level, but there is also differentiation related to wealth, income, and kind of employment. Look at the difference between 1992 (light blue, left) and 2004 (red, right). Notice that for both genders, and with all education levels, people are expecting to work longer.
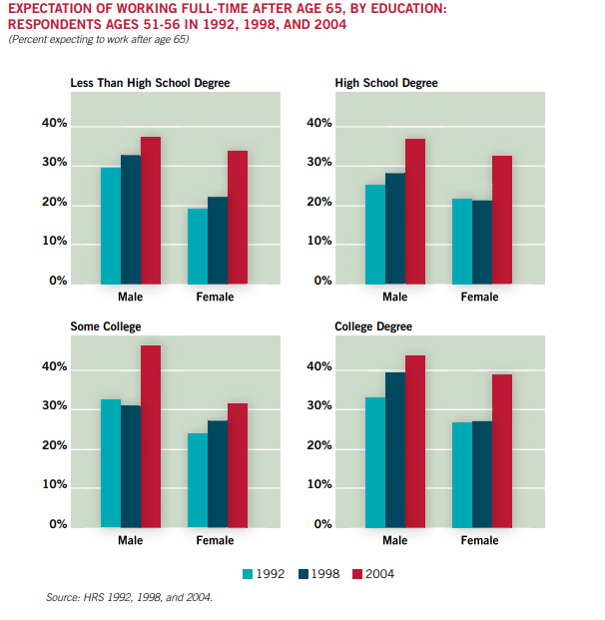
Figure 1.10. People are expecting to work longer. Evidence shows that people actually are working longer as well.
The number of older workers increased between 11% in 1987 to 19% in 2023 (Braga, 2023). This is similar to the levels of older workers in the 1960s. Expectations do not always match experience, and there is some evidence that older workers are forced out of stable, well-paying jobs at a significant percentage, as you can see in Figure 1.11.
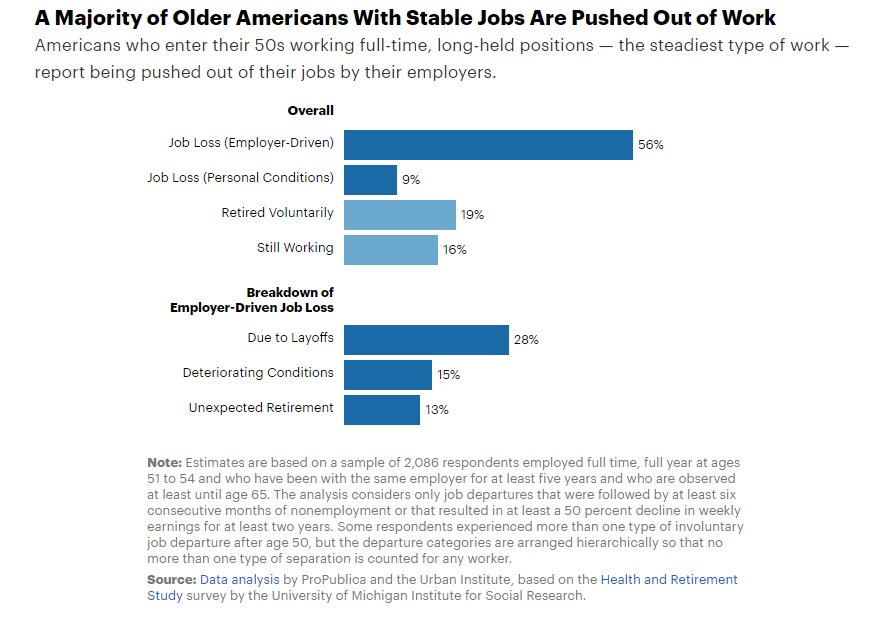
Figure 1.11. The results of a 2018 survey conducted by ProPublica of 2,086 people aged 51 to 54 years showed that many people retired even though they didn’t want to (Gosselin, 2018).
Older workers are also earning higher wages than they did in previous generations. Younger workers still earn more, but the gap is closing. For comparison, in 1964 the average annual income of workers aged 65 and older was 19% of the average income for people aged 24 to 64 years. By 2023, the average annual earnings of older workers were 80% of the earnings of younger workers (Braga, 2023).
Theoretical Perspectives on Families
In this text, the authors describe multiple accepted theories and perspectives, with an effort to include diversity of thinking. These theories don’t necessarily conflict with one another. Rather, they offer different views of how families interact within themselves and within society.
Family as Haven, Fulfillment, and Encumbrance
Sociologist Maxine Baca Zinn examines the ways that ideas and images of families influence family expectations and interactions. Specifically, she describes family as haven, family as fulfillment, and family as encumbrance (Zinn et al., 2011).
The family as haven describes the contrast that has historically been made between home spaces and workspaces in the United States. The idea that we live in a “heartless world” where individuals cannot expect to be treated with compassion isolates those caring characteristics from the home and family. The family became the place of warmth, tenderness, and morality in contrast to a world of commerce and competition, especially as society became more industrialized. It became a place where protection was offered.
The idea of family as fulfillment emerged in the later part of the 20th century as expectations increased for individual family roles as well as the home and family environment. For example, more intensive parenting to raise well-developed children became more idealized and was seen as fulfilling for parents. In addition, the family as a whole was not seen just as an escape from the harsh world but also as a place for enjoyment, creating meaning, and rejuvenation.
The family as encumbrance recognizes the ways in which the family ideals encompass responsibilities, effort, and stagnation. Monogamous marriage and parenting can be monotonous. This can get in the way of self-actualization and freedom to have the fullest experience of self. While both the family as fulfillment and as encumbrance incorporate the societal ideals of reaching one’s full potential, they represent two differing ways that the family can be viewed and experienced.
The Private and Public Functions of Families
Sociologist Andrew Cherlin uses the lens of private and public functions to view families. Notably, American society today is more concerned with the private function of families, which focuses on the intimate relationships of family members. Being a part of a loving relationship that will last forever, or an indefinite amount of time, is seen as a core part of being a family member (Cherlin, 2016).
In the past, and today in other cultures and countries, families focused more on the public function, such as the production of children, who could contribute to the well-being of both the family and society. This perspective is similar to what would be called “public goods” (or the products produced and used by the public) in an economic model. The most common public good in American families is our children, but caring for the elderly or adults with disabilities could also be considered a public good. Volunteering and contributing to places of worship, charitable organizations, and other nonprofit agencies is another way to perform the public function.
As public institutions, families support, contribute to, and benefit from the overall social structure, which describes the organization of institutions within a society and affects the ways individuals and families interact. Although our society currently focuses on the private function, families implicitly perform both; these functions are complementary to one another. In this text we will raise awareness of the public function.
The focus on the private function of families and on self-actualization as an important part of life may relate to the United States’ identity as an individualistic society (Morin, 2019). In America, there is a focus on what individuals can achieve, with value placed on accomplishments that are gained without the support of society. Many other countries have collectivist societies that emphasize social support for all, so that all members of the group are able to meet their goals and needs.
Licenses and Attributions for The Family: A Socially Constructed Idea
Open Content, Original
“The Family: A Socially Constructed Idea” by Elizabeth B. Pearce. License: CC BY 4.0.
Figure 1.4. “Equality, Equity, Equity for All” by Katie Niemeyer. License: CC BY 4.0. Based on ideas originally illustrated by Angus Maguire and Craig Froehle.
Figure 1.5. “For Children, Growing Diversity in Family Living Arrangements” by Elizabeth B. Pearce and Michaela Willi Hooper, Open Oregon Educational Resources. License: CC BY 4.0. Based on data from Pew Research Center.
Figure 1.7. “Marriage and Divorce Rates United States, 1990–2020” by Elizabeth B. Pearce and Michaela Willi Hooper. License: CC BY 4.0. Data from National Marriage and Divorce Rate Trends for 2000–2020 and the Monthly Vital Statistics Reports, CDC. Recent data are provisional. See sources for full notes.
Figure 1.8. “Trends in the U.S. Fertility Rate.” License: CC BY 4.0. Based on data compiled by childtrends.org.
Figure 1.9. “One in Five Americans Live in a Multigenerational Household” by Elizabeth B. Pearce and Michaela Willi Hooper, Open Oregon Educational Resources. License: CC BY 4.0. Based on data from “Financial Issues Top the List of Reasons U.S. Adults Live in Multigenerational Homes,” Pew Research Center analysis of Current Population Survey Annual Social and Economic Supplement (ASEC) data files for 1971, 1981, 1991, 2001, 2011, and 2021 (IPUMS).
Open Content, Shared Previously
Figure 1.1. Photograph by Jason Leung. License: Unsplash License.
Figure 1.2. “Breakfast Burrito” by JBrazito. License: CC BY-NC 2.0. “Sunday Brunch: Sweet Potato Rosti, Bacon, Fried Egg & Strawberries” by SaucyGlo. License: CC BY 2.0. “Chinese Breakfast” by Daniel Y. Go. License: CC BY-NC 2.0.
Figure 1.6. “Median Age at First Marriage: 1890–Present” by the U.S. Census Bureau. Public domain.
Figure 1.10. “Expectation of Working Full Time after Age 65” from the Health and Retirement Study by the National Institute on Aging. Public domain.
Figure 1.11. “A Majority of Older Americans with Stable Jobs Are Pushed Out of Work” by Peter Gosselin/ProPublica. License: CC BY-NC-ND 2.0.
All Rights Reserved Content
Figure 1.3. Modern Family photograph © American Broadcasting Company. License: Fair Use. Adaptations: juxtaposed with Leave it to Beaver photograph, which is in the public domain.
References
American Sociological Association. (2020). Comparative/historical approaches. https://www.asanet.org/topics/comparativehistorical-approaches
Cherlin, A. (2016). Public and private families. McGraw-Hill.
Fry, R. & Braga, D. (2023, December 14). Older workers are growing in number and earning higher wages. Pew Research Center’s Social & Demographic Trends Project. https://www.pewresearch.org/social-trends/2023/12/14/older-workers-are-growing-in-number-and-earning-higher-wages/
Gosselin, P. (2018, December 28). If you’re over 50, chances are the decision to leave a job won’t be yours. ProPublica. https://www.propublica.org/article/older-workers-united-states-pushed-out-of-work-forced-retirement
Johnson, A.G. (2006). Privilege, power, and difference (2nd ed.). McGraw-Hill.
Mandapat, C. A., Kim Parker, Shannon Greenwood, Chris Baronavski and John Carlo. (2023, September 14). The modern American family. Pew Research Center’s Social & Demographic Trends Project. https://www.pewresearch.org/social-trends/2023/09/14/the-modern-american-family/
Morin, A. (2019, August 19). Individualistic cultures and behavior. Verywell Mind. https://www.verywellmind.com/what-are-individualistic-cultures-2795273
Pew Research Center. (2015, December 17). The American family today. https://www.pewsocialtrends.org/2015/12/17/1-the-american-family-today/
Pew Research Center. (2018, April 5). Record 64 million Americans live in multigenerational households. https://www.pewresearch.org/fact-tank/2018/04/05/a-record-64-million-americans-live-in-multigenerational-households/
Zinn, M. B., Eitzen, D. S., & Wells, B. (2011). Diversity in Families (9th ed.). Allyn & Bacon.