
10.3 The Poverty Line and Food Costs
How is poverty defined? While there are multiple measures, a common and shared one is the poverty threshold, also known as the poverty line. While poverty will affect all of the families related to all of the topics in this text, we will discuss it here because it was originally tied to the cost of food, specifically an “economy food plan.” In 1963, the poverty line was designated at three times the economy food plan, and it was assumed “that the housewife will be a careful shopper, a skillful cook, and a good manager who will prepare all the family’s meals at home” (Fremstad, 2019).
When U.S. officials became concerned about poverty during the 1960s, they quickly realized they needed to find out how much poverty we had. To do so, a measure of official poverty, or a poverty line, was needed. A government economist, Mollie Orshanky, first calculated this line in 1963 by multiplying the cost of a very minimal diet by three, as a 1955 government study had determined that the typical American family spent one-third of its income on food. Thus a family whose cash income is lower than three times the cost of a very minimal diet is considered officially poor.
This way of calculating the official poverty line has not changed since 1963, although the amount is adjusted by inflation. It is thus out of date for many reasons. For example, many expenses, such as heat and electricity, childcare, transportation, and health care, now occupy a greater percentage of the typical family’s budget than was true in 1963. In addition, this official measure ignores a family’s non-cash income from benefits such as food stamps and tax credits. As a national measure, the poverty line also fails to take into account regional differences in the cost of living. All these problems make the official measurement of poverty highly suspect. As one poverty expert observes, “The official measure no longer corresponds to reality. It doesn’t get either side of the equation right—how much the poor have or how much they need. No one really trusts the data” (DeParle et al., 2011).
This is a good time to ask yourself, if you looked at food as a percentage of your budget, would it be the equivalent of 33%? That’s how the poverty line is still calculated.
The poverty line is adjusted annually for inflation and takes into account the number of people in a family: the larger the family size, the higher the poverty line. In 2010, the poverty line for a nonfarm family of four (two adults, two children) was $22,213. A four-person family earning even one more dollar than $22,213 in 2010 was not officially poor, even though its “extra” income hardly lifted it out of dire economic straits. Poverty experts have calculated a no-frills budget that enables a family to meet its basic needs in food, clothing, shelter, and so forth; this budget is about twice the poverty line. Families with incomes between the poverty line and twice the poverty line (or twice poverty) are barely making ends meet, but they are not considered officially poor (Figure 10.4).
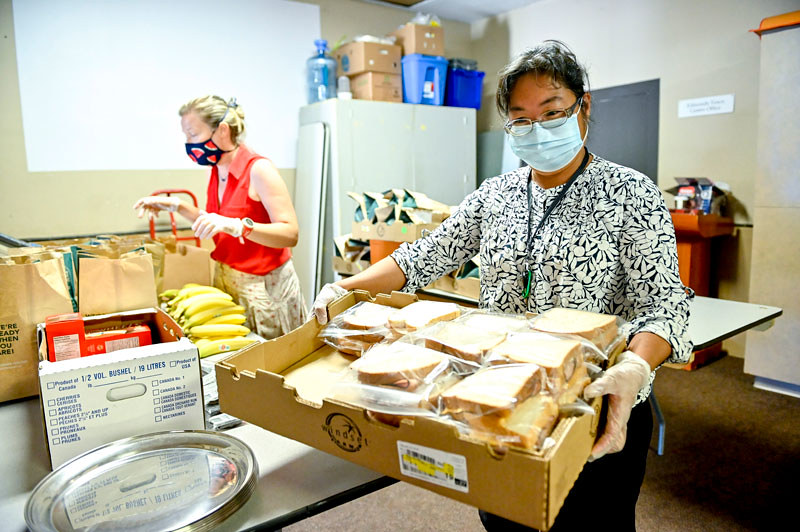
Figure 10.4. Ironically enough, although poverty is measured by an income that is lower than three times the cost of a minimal diet, many families above the poverty line still struggle to get enough food.
When we talk here about the poverty level, then, keep in mind that we are talking only about official poverty and that there are many families and individuals living in near poverty who have trouble meeting their basic needs, especially when they face unusually high medical expenses, motor vehicle expenses, college debt, or the like. For this reason, many analysts think families need incomes twice as high as the federal poverty level just to get by (Wright et al., 2011). They thus use twice-poverty data (i.e., family incomes below twice the poverty line) to provide a more accurate understanding of how many Americans face serious financial difficulties, even if they are not living in official poverty.
Food Security and Food Insecurity
The U.S. Department of Agriculture (USDA), the department responsible for developing and executing federal laws related to farming, forestry, rural economic development, and food in the United States, identified food insecurity as a measurable problem in 1995. The USDA introduced new language to describe ranges of severity of food insecurity in 2006. The methods used to assess households’ food security remained unchanged. Here are the current definitions of food security and food insecurity (Economic Research Service, 2019):
Food Security
- High food security: no reported indications of food access problems or limitations.
- Marginal food security: one or two reported indications, typically of anxiety over food sufficiency or shortage of food in the house. Little or no indication of changes in diets or food intake.
Food Insecurity
- Low food security (food insecurity without hunger): reports of reduced quality, variety, or desirability of diet; little or no indication of reduced food intake.
- Very low food security (food insecurity with hunger): reports of multiple indications of disrupted eating patterns and reduced food intake.
According to the USDA, hunger “refer(s) to a potential consequence of food insecurity that, because of prolonged, involuntary lack of food, results in discomfort, illness, weakness, or pain that goes beyond the usual uneasy sensation.” Nationally, food insecurity has been a problem as long as it has been measured and the rate has changed very little; the number of food insecure families was 12% in 1995 and was still 11.1% in 2018. Let’s look more closely at Oregon, where food insecurity has been one of the toughest challenges to overcome as shown in Figure 10.5. According to the Oregon Public Health Division, Oregon ranks 13th in the nation for food insecurity among children, and 21st for adults. While efforts have been made to combat hunger in Oregon, it is still a big problem for the state. According to USDA data, more than one in seven of Oregon households were food insecure between 2014 and 2016 (Bauer, 2018). If you’d like to see a visual of these data, click here. Renters in Oregon had food insecurity rates as high as one in four between 2015 and 2017 (Edwards, 2018).
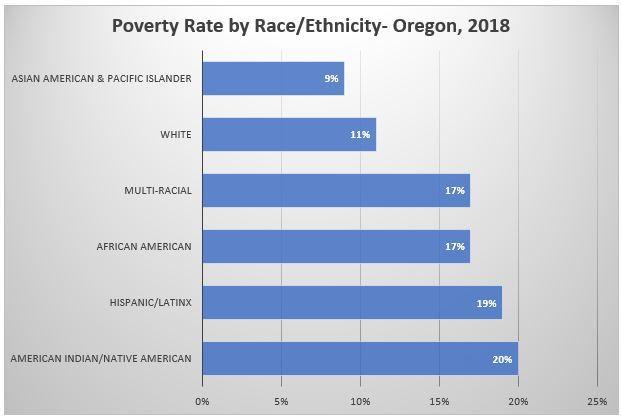
Figure 10.5. This graph shows the Oregon poverty rate by race/ethnicity in 2018.
The Oregon Center for Public Policy says that over 527,000 people in Oregon suffer from food insecurity (Bauer, 2018).
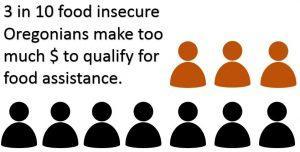
Figure 10.6. 30% of food insecure Oregonians in 2016 had too much income to qualify for SNAP assistance.
To put that into perspective, the population of Portland, our largest city, is around 647,800 people. Overall, minorities and single mothers are disproportionately impacted by food insecurity; food insecurity is strongly linked to socioeconomic status.
While there are programs to help families who are food insecure, there are still families who are food insecure who do not qualify for any food assistance (Figure 10.6).
In Focus: Food Insecurity at Linn-Benton Community College
In a survey conducted by the Hope Center at Temple University, Linn-Benton Community College (LBCC) in Albany, Oregon, was one of 400 community colleges queried about food and housing insecurity over the past five years. LBCC students participated in 2019, the fifth year of the study. The survey was sent to 5,700 students and 558 students responded.
Forty-eight percent of students reported experiencing food insecurity within the last 30 days, slightly higher than the nation-wide average of community college students (Figure 10.7).
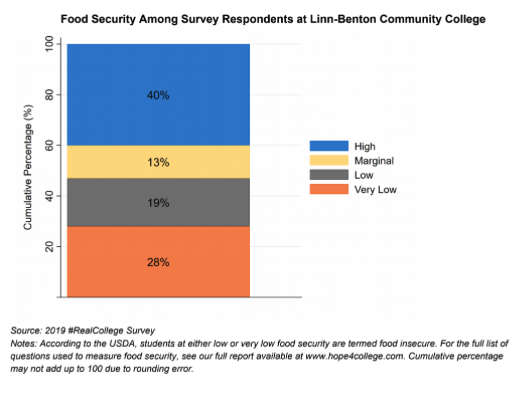
Figure 10.7. Forty-seven percent of student respondents at LBCC are food insecure.
Sixty-six percent of the students that participated in the survey reported experiencing either food insecurity, housing insecurity, or houselessness within the past year (Baker-Smith et al., 2020). Various measures of food insecurity ranged in response from 5% to 49% of LBCC students (Figure 10.8).
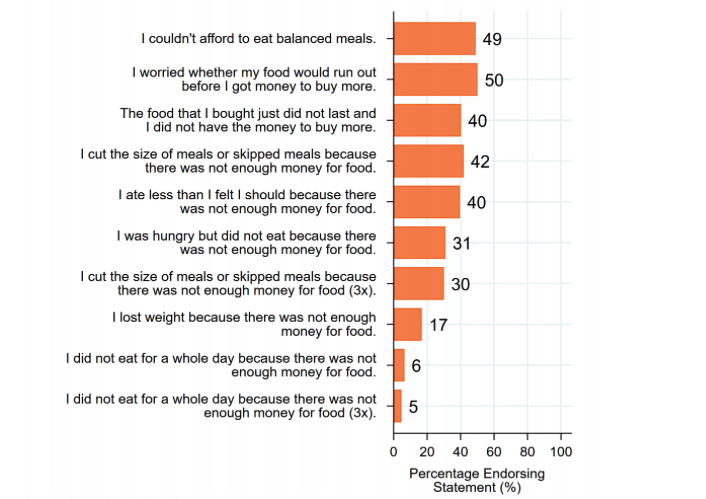
Figure 10.8. Food insecurity is faced in a variety of ways by survey respondents at LBCC.
Food Stamps
Many people in the United States rely on SNAP to provide food for their families. The Supplemental Nutrition Assistance Program (SNAP), also known as food stamps, is a federal program that in some states is supplemented with local funds whose goal is to supplement nutrition and the food budget of families who are moving toward self-sufficiency. According to the 2018 American Community Survey, 12.4% of people in the United States use food stamps and the majority of those families have at least one person working, with ⅓ of recipients having two family members working (U.S. Census Bureau, 2020). Oregon has one of the highest usage rates in the country at a rate of 14%. If you are interested in national data about SNAP, you can see a map of SNAP usage across the country.
Many people on SNAP still have trouble making ends meet. Many people find themselves stuck in a seemingly endless cycle of poverty, despite striving for self-sufficiency. Read or listen here to a 3-minute summary of an interview with a woman in 2000 when she used food stamps and then in 2012 when she was interviewed again.
Fraud is often mentioned as a concern when it comes to food stamps, but when recipient and vendor fraud is totaled it is estimated at less than 1% of all funds disbursed. That means that more than 99% of the funds are used correctly (Constable, 2018). The USDA maintains a webpage that reports on their efforts to stop fraud and to recoup delinquent funds. These authors advocate for the focus to shift toward solving the social problems of poverty and hunger, rather than letting the small amount of fraud distract the country from these efforts.
People struggling to feed themselves and their families face other challenges as well. Accepting governmental assistance and charity is stigmatized. Some families feel too embarrassed to seek or accept needed resources. Constant stress related to food insecurity and choosing which bills to pay contributes to mental health challenges. Do you or someone you know have experience with using SNAP? Click here to read Voices from “Hunger in Oregon” for short descriptions from Oregonians who have used this program.
Licenses and Attributions for The Poverty Line and Food Costs
Open Content, Original
“In Focus: Food Insecurity at Linn-Benton Community College” by Elizabeth B. Pearce. License: CC BY 4.0.
Figure 10.5. “Poverty Rate by Race/Ethnicity, Oregon, 2018.” Based on data from the American Community Survey/Kaiser Family Foundation. License: CC BY 4.0.
Figure 10.6. “Share of Food Insecure Oregonians with Too Much Income to Qualify for SNAP Assistance, 2016.” Based on data from the Oregon Center for Public Policy. License: CC BY 4.0.
Open Content, Shared Previously
“The Poverty Line and Food Costs” is adapted by Elizabeth B. Pearce and Amy Huskey from Social Problems: Continuity and Change by Anonymous. License: CC BY-NC-SA 4.0.
Figure 10.4. “Funding Helps People Facing Food Insecurity” by Province of British Columbia. License: CC BY-NC-ND 2.0.
All Rights Reserved
Figure 10.7. “Food Security among Survey Respondents at Linn-Benton Community College” in #2019 RealCollege Survey: Linn-Benton Community College by The Hope Center. Used with permission.
Figure 10.8. “Food insecurity among survey respondents at Linn-Benton Community College” in #2019 RealCollege Survey: Linn-Benton Community College by The Hope Center. Used with permission.
References
Baker-Smith, C., Coca, V., Goldrick-Rab, S., Looker, Richardson, B., & Williams, T. (2020, February). Hope Center. https://hope4college.com/wp-content/uploads/2020/02/2019_RealCollege_Survey_Report.pdf
Bauer, J. (2018, May 17). Oregon Lags in Fighting Food Insecurity (Figure 10.5). Oregon Center for Public Policy. https://www.ocpp.org/2018/05/17/oregon-food-insecurity-lag/
Constable, S. (2018, April 4). The facts about food stamp fraud. Forbes. https://www.forbes.com/sites/simonconstable/2018/04/04/the-facts-about-food-stamp-fraud/
DeParle, J., Gebeloff, R., & Tavernise, S. (2011, November 4). Bleak portrait of poverty is off the mark, experts say. New York Times, p. A1.
Economic Research Service. Department of Agriculture. (2019, September 4). Definitions of food security. Retrieved March 7, 2020, from https://www.ers.usda.gov/topics/food-nutrition-assistance/food-security-in-the-us/definitions-of-food-security/
Edwards, M. (2018, December). Widespread declines, yet persistent inequalities: Food insecurity in Oregon and the U.S. Oregon State University School of Public Policy. https://liberalarts.oregonstate.edu/sites/liberalarts.oregonstate.edu/files/sociology/oregonhungerreportdec2018.pdf
Fremstad, S. (2019, September 16). The official U.S. poverty rate is based on a hopelessly out-of-date metric. Washington Post. https://www.washingtonpost.com/outlook/2019/09/16/official-us-poverty-rate-is-based-hopelessly-out-of-date-metric/
U.S. Census Bureau. (2020, July 21). Most families that received SNAP Benefits in 2018 had at least one person working. https://www.census.gov/library/stories/2020/07/most-families-that-received-snap-benefits-in-2018-had-at-least-one-person-working.html
Weston, P. (2020, April 28). “This is no damn hobby”: The “gangsta gardener” transforming Los Angeles. The Guardian. https://www.theguardian.com/environment/2020/apr/28/ron-finley-gangsta-gardener-transforming-los-angeles
Wright, V. R., Chau, M., & Aratani, Y. (2011). Who are America’s poor children? The official story. New York, NY: National Center for Children in Poverty.