
13.2 Education and Employment
It is difficult to imagine a more important, or at least as time-consuming, aspect of family life, than education and employment, in the United States. Education is compulsory for children in the United States, although federal, state, and local policies govern when that begins and when that ends. Kindergarten is mandatory in 17 states and the District of Columbia (Barrientos, 2023). The age that students may leave schooling varies between 14 and 18 years old. In addition, many children attend childcare for both full day and part-day settings (sometimes called “preschool”) between birth and starting kindergarten or first grade. And college has become an increasingly important part of life in the United States. In this section we will use an equity lens to view what options and choices that families have and how their decisions impact generational outcomes.
We will also look at employment, or work, through an equity lens. Most importantly, we will examine all work, whether paid or unpaid. In 2022 individuals employed in full-time paid work tend to spend 8.42 hours working each weekday. Those that hold multiple jobs spend more hours working than people who have one job. Increasingly, people in the United States need to hold multiple jobs to make ends meet (U.S. Department of Labor Bureau of Labor Statistics, n.d.). But what about unpaid work, such as housework, caring for family members, volunteering, and other needed work, such as planning and budgeting for a family? We will look closely at who does that work, and how much time it takes. Lastly, we will examine the relationship between the education that a family has access to, and how this affects future employment, wealth, and health outcomes for children and families.
Education: Birth through Secondary Education
In this section we will consider what options for care and education are available to families between birth and early adulthood. We will look through an equity lens at childcare and secondary education, or K–12.
Childcare
Childcare is generally presumed to mean “non-maternal” or “non-parental care of young children.” A big question for many is whether regular non-parental care benefits, harms or is neutral to children’s development.
The most comprehensive attempt to answer this question was undertaken by the National Institute of Child Health and Human Development (U.S. Department of Health and Human Services) between 1991 and 2006. In this study over 1,000 children and families participated in research conducted between the birth of the child and approximately ninth grade. This study is by far the most complete look at quantity, quality, and types of childcare to date (Figure 3.1).
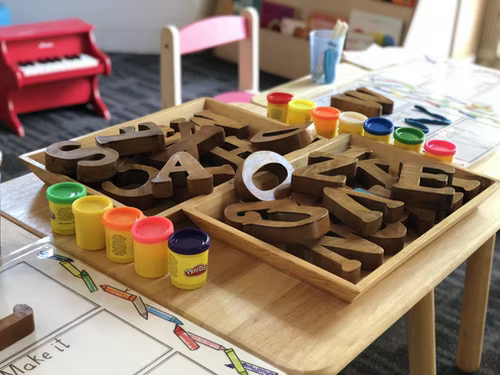
Figure 13.1. Both home and childcare environments can contain high-quality materials which support children’s learning and development.
The National Institute of Child Health and Human Development (NICHD) Study of Early Childhood and Youth Development provides a great deal of basic information about childcare, along with detailed findings. The most significant findings were a correlation between a child’s cognitive, language, and social development, their parents’ characteristics, and the quality of the childcare that they experienced. Quality is related to positive caregiving, as described below (National Institute of Child Health and Human Development, 2019).
The more standards a childcare setting meets, the more positive the caregiving. The more positive the caregiving, the higher the quality of care and the better the children’s outcomes.
For instance, for young children in care with smaller groups of children cared for by trained caregivers with higher levels of education in a setting with a low adult-to-child ratio, the care provided tends to be warm, attentive, and intellectually stimulating. Children who receive such care are better off developmentally.
In contrast, when groups are large, when there are many children to care for but few caregivers, and the training/education of caregivers is limited, the care provided tends to be of lower quality, and children’s development is less advanced.
Overall, the study found that children in childcare did not develop differently than children who were cared for by their parents. While there were some small advantages to being in childcare, parent and family characteristics were more strongly correlated. Quality childcare was correlated with these advantages as well (National Institute of Child Health and Human Development, 2019).
What about longer-term development and childcare? It has been found that quality, number of hours in childcare, and type of childcare are all associated with children’s social-emotional and cognitive-academic functioning in the short, middle, and long term. Associations between early childhood care quality and academic achievement were found, with higher-quality childcare predicting higher academic achievement in early childhood, middle childhood, and adolescence (NICHD ECCRN, 2002b, 2005a; Belsky et al., 2007; Vandell et al., 2010).
Number of hours in childcare were more related to problem behaviors in early and middle childhood (NICHD ECCRN, 2002b, 2005a) and greater risk-taking and impulsivity at age 15 (Vandell et al., 2010). These problems faded out by the end of high school, but the effects related to higher grades and admission to more selective colleges held steady (Vandell et al., 2016).
What about family life as an adult who attended childcare? Childcare seems to offer an advantage to all children, but especially children from low-income families. The effects of high-quality childcare reduce educational and wage disparities for low-income children in adulthood (Bustamante et al., 2022).
Lack of Quality Childcare Impacts U.S. Families
All of these studies that show positive effects of childcare include one qualifier: It must be “quality” childcare. Quality costs money. As noted above, quality indicators include more adults, smaller groups of children, and teachers who are educated and have access to training. This contributes to what Early Education leader Gwen Morgan pictured in Figure 3.2, called “the childcare trilemma.” She advocated for higher quality of care, better wages for teachers, and affordability for parents. She stated that a systemic solution was needed so that childcare programs could have all three in order for children to develop well in childcare settings (“The Childcare Trilemma,” n.d.).
Figure 13.2. Gwen Morgan coined the term “childcare trilemma,” which identified the tension between parents being able to afford quality childcare and workers being paid a living wage.
A weakness of the NICHD study was its limited involvement of children from families with lower socioeconomic statuses. There has been, however, extensive research about the federally funded Head Start program, which serves low-income families. The majority of Head Start programs are part day and targeted at three- and four-year-olds, although there are some infant-toddler programs (Early Head Start) and an even smaller number of full-day programs. These programs do not work well for parents who are in the paid workforce and need more childcare coverage. Unfortunately, not all families who are eligible for Head Start are enrolled, primarily due to lack of funding. It is estimated that about 40% of all eligible children are actually served (Blair, 2013).
It can be said that quality childcare can have the potential to improve or maintain a child’s development and outcomes. The NICHD estimated that fewer than 10% of children are in such high-quality settings and that fewer than 10% of children are in the lowest quality settings, with very little positive caregiving. The majority of the children in the United States are in childcare that might be described as “fair—between ‘poor’ and ‘good’”(National Institute of Child Health and Human Development, 2019).
The lack of quality childcare in the United States presents issues of equity. As it has become more necessary for all adults in a household to work, the demand for childcare has increased. While there are some programs that help parents to pay for childcare, this varies widely across states and even within communities. The quality and quantity of childcare is also highly variable. The COVID-19 pandemic has exacerbated these problems. While some families are able to access quality childcare that they can afford, many families are left out. This is unlikely to change without a systemic look at the trilemma: workforce needs, attention to quality childcare, and livable wages for childcare teachers.
Family Choices in K–12 Education
One central tenet of the U.S. education system is that all people in our country deserve access to education, regardless of the language you speak, how much money you make, where you live, or the color of your skin. Some other countries employ tracking, which means that certain individuals are channeled into certain educational “tracks” based on their perceived capabilities for future success. Tracking limits access to education for certain groups of people. In the United States, all children and youth have access to K–12 educational opportunities.
While the United States does not “track” students in the ways some other countries do, we do still engage in some forms of tracking. For example, you may have heard of—or even experienced—ability grouping. This term refers to placing students in homogeneous groups by ability levels. In secondary school, tracking may result in college prep, honors, or AP-level courses. Historically, these different curricula were developed when more Black and working-class students were entering schools, and elite educational opportunities were reserved for upper-middle-class students, who were often White, wanting to attend college (Staff, 2004). Therefore, tracking “quickly took on the appearance of internal segregation,” which is a problem as racial discrimination in education is illegal. So, while U.S. educational systems do not force a student into a specific educational track for a specific career at an early age like some countries do, tracking by ability level is still a harmful practice in many U.S. schools. Teachers need to be aware of potential biases toward students in certain tracked groups (i.e., AP students are “good” and college prep students are “bad”).
The reality is that education in the United States is not equal, and this section will help you understand how and why. Parents are faced with a different range of decisions when it comes to where their children will go to school, and much of this has to do with income. As this section will show, where you live matters. Schools vary greatly in terms of funding and resources. Many parents will select a home rental or purchase, based on the reputation of the school district it is in. And families with greater wealth have the option to choose a private school instead.
The majority of schools in the United States fall into one of two categories: public or private. A public school is any school that is maintained through public funds to educate children living in that community or district without cost to families. The structure and governance of a public school varies by model, but they all share the characteristics of being free and open to all applicants within a defined boundary. A private school is a school that is privately funded and maintained by a private group or organization, not the government, usually by charging tuition. Private schools may follow a philosophy or viewpoint different from public schools; for example, many private schools are governed by religious institutions.
There are a variety of public school models, including traditional, charter, magnet, virtual, alternative, and language immersion. Private school models include traditional, religious, parochial, Montessori, Waldorf, virtual, boarding, and international schools. Some school models may be public or private. Figure 13.3 includes a breakdown of several school models, their funding sources, and key characteristics.
| School Model | Public or Private | Enrollment | Key Characteristics |
|---|---|---|---|
| Traditional Public | Public | Open/school boundary lines | State and local governance, policy, and curriculum. |
| Magnet | Public | Open across school district/application or lottery | Specializes in a program (art, science, math, etc.), promotes diversity across a district. |
| Alternative | Public | Students that cannot attend traditional school due to a variety of factors | State and local governance, policy, and curriculum. Small class sizes and alternative scheduling. Individualized support. |
| Language Immersion/ Bilingual |
Both | Open across school district/application | A portion of instruction is taught in a language other than English. Students are immersed in a second language for part of instruction. |
| Charter | Both | Open across school district/application or lottery | Has more autonomy from local and state authority as long as the school meets charter mission and performance measures. |
Figure 13.3. This table shows some common kinds of publicly funded schools. There are also a variety of private schools that vary greatly from region to region in the United States.
One type of school not listed in the table is homeschool. Homeschooling is a type of schooling that would not fall into either the public or private category. Homeschooling is defined as a child not enrolling in a public or private school but receiving an education at home. Each state has its own rules and regulations that families must follow and report on if homeschooling
In addition to the schools being separated by their funding source, schools are defined by their process of enrollment. The majority of public schools operate on two basic enrollment guidelines: boundary or open. Districts with enrollment policies using school boundary lines allow all students within a geographic area to enroll in the school. If a school has an open enrollment policy, then the school will also allow students from other geographic areas within the district to enroll if space permits. School boundary lines are often highly politicized. Schools are publicly rated, and this affects everything from property values to the quality of teachers recruited. Ratings may be based on data sources like the school report card, which may include data on teacher education levels, teacher retention, student demographics, student performance on standardized tests, and student and teacher attendance rates. However, ratings also can be culturally biased: one nonprofit rating site called GreatSchools, which often is integrated into online realtor websites as families are choosing where to move, redid their rating formula in 2017 after it realized that their previous rating system prioritized schools in predominantly White neighborhoods (Barnum & LeMee, 2019.)
Some public school models, including charter, magnet, and language immersion, may have more students desiring to apply than there is space. In these schools, applications or lotteries may be used. An application system allows the schools to choose students based on characteristics, such as grades, demographic diversity, or geographic area.
The federal government is responsible for providing around 9% of a school’s budget. While this may not seem like very much, in 2013, that amounted to $71 billion in federal funding (U.S. Census Bureau, 2015). In 1965, Congress passed the Elementary and Secondary Education Act. In this act, Title I, Part A (Title I) provides federal assistance to schools with large percentages of students from low-income, under-resourced families. These funds are to help ensure that all students are able to meet the state academic standards. Schools that receive these funds are often known as Title I schools or districts. The goal of distributing funds in this way is to make schools more equitable; however, these funds only account for 9% of a school’s funding. The other 91% comes from state and local funding.
State and local school funding is based on complex funding formulas, with income often sourced from taxes on income, property, or sales. In general, most states use one or a combination of three different types of funding formulas: a student-based formula, a resource-based formula, or a hybrid formula. In 2020, 38 states used a student-based or hybrid funding formula. Across the nation, each state sets its own education budget, thus creating variance in funding and equitable education across states.
This funding disparity is further widened at the local level. Local funding makes up around 45% of a school’s budget. In 47 states, funding for education is raised through property taxes (EdBuild, n.d.). Thus, schools within wealthy districts will raise more funds than schools in economically disadvantaged areas. The federal funds distributed to low-income areas through Title I do not make up for the inequities in funding.
In Focus: Funding Inequities
Funding public schools based on local property taxes can perpetuate issues of inequity when it comes to accessing resources needed for high-quality education. This NPR article explains how predominantly White school districts can receive up to $23 billion more than districts that serve predominantly students of color. Watch the video in Figure 13.4 to learn more about how systemic racism impacts school funding.
Figure 13.4. Systemic Racism Explained [YouTube Video]. This video will help you understand how policies and laws implemented a century ago impact today’s children.
As you view this film, are you reminded of what you read about redlining in Chapter 8?
With so many school models available in the United States, how do families choose which type of school their child should attend? School choice is a complex issue for families to navigate. What may be best for one student is not always best for another. The choices for students also vary by geographic and socioeconomic boundaries. Many families make school decisions based on the following factors:
- Transportation and distance to chosen school
- Cost or tuition of school
- Curriculum and programs available
- Religious affiliation
- Fit for the individual student
Families in some areas of the United States also have greater access to the different models of schools presented than others. Small rural towns may only have one school within the immediate area.
One reason that school choice has become so politicized is the use of school vouchers. School vouchers are usually a government-supplied coupon that can be used to offset tuition at an eligible private school. School voucher policies and programs today vary across localities and are present in over 30 states. Students who receive vouchers enroll in a private school, which receives those funds. The voucher may cover tuition in full or offset it significantly.
Vouchers are funded by one of the following: tax revenues, tax credits, or by private organizations (Epple et al., 2017). The majority of states that use tax revenues to fund their vouchers provide vouchers to under-resourced students.
When a student uses a voucher to attend a private school, this changes the funding formulas for a local school. This student is no longer included in the funding formula for the local or state educational agency. This means that the local and state budget is lowered because one less student is being counted in that funding formula. School vouchers are provided and promoted to give under-resourced students school choice, but not all students have equal opportunities.
Public schools allow and are required by law to provide services for all students. While policies prohibit private schools from discriminating against students based on race, many religious private schools may consider religious affiliation, sexual orientation, and disability in their admission decisions. Private schools are not exempt from discrimination laws, but the application process allows them to choose which students to admit. For example, a private school receiving government funds must provide students with disabilities with accommodations, unless these accommodations change the philosophy of the academic program or create “significant difficulty or expense.” A large portion of private schools do not hire teachers trained to provide accommodations; thus, they do not have the resources to serve students with disabilities. Vouchers are not beneficial for students with disabilities that cannot attend private schools, but vouchers also hinder these students further by diverting funds from the public schools, who do provide these services.
In these next two sections we will discuss several groups of students who may face discrimination in schools. Imagine yourself as a parent sending your child to school for the first time, or to a new school. What kinds of additional challenges might families face when they wonder “Will my child fit in? Will my child be accepted?”
Neurodiverse and Neurotypical Students
Neurodiversity is a term that means that brain differences are naturally occurring variations in humans. The neurodiversity perspective sees brain differences rather than brain deficits. Instead of viewing differences as disordered or needing to be cured, a neurodiverse perspective sees differences as welcome variants of the human population (Walker, 2021).
People whose brains are wired differently than expected are called neurodivergent. Neurodivergent people have significantly better capabilities in some categories, and significantly poorer capabilities in other categories (Doyle, 2020). You may hear many labels and diagnoses that make up neurodivergence: attention-deficit/hyperactivity disorder (ADHD), autism, dyslexia, dyscalculia, learning difference, and many more words as described in Figure 13.5.
Figure 13.5. What is Neurodiversity? [YouTube Video]. As you watch the first five minutes of this video, consider the experience of this neurodiverse person. How does inequality in education show up for her?
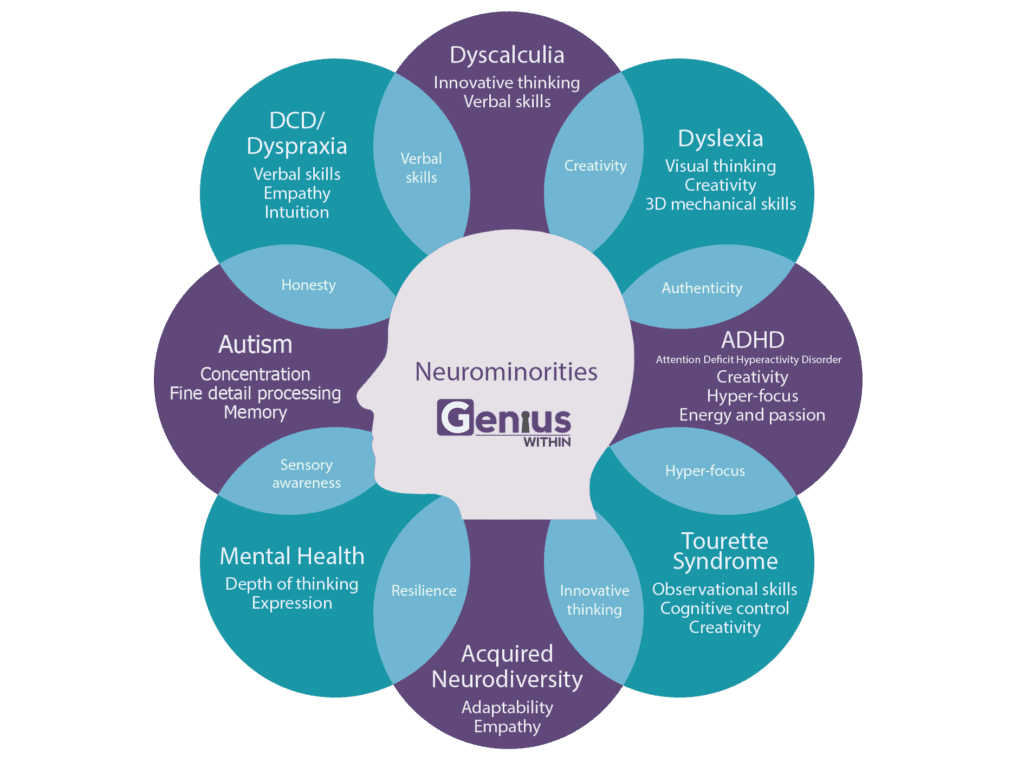
Researcher David Pollack provides a model of neurodivergence in Figure 3.6, which relates several of the labels we listed at the beginning of this section. People experience many different and overlapping learning differences as part of being neurodivergent.

Figure 13.6. Neurodiversity is complicated. Image description.
In the 1990s, adults with these labels began to push back against these categorizations. Their alternate claim was that these conditions should be considered as normal human variants of neurology. Patient-centered care advocate Valerie Billingham coined the phrase, “nothing about me, without me” (Billingham, 1998). She was talking about the need to include the patient at the center of decision-making around patient health and patient treatment choices.

Figure 13.7. This note provides some of the positive experiences of neurodiversity. Image description.
This phrase is used widely today by autism awareness activists, who have expanded the meaning to include the idea that people who are neurodivergent should be the ones describing their own experiences. The letter in Figure 13.7 provides one example of this. People with autism are the ones who should make choices about what they need to fully participate in school and in life. They should propose the laws, policies, and practices that make their participation possible.
Some experts see neurodiversity itself is a civil rights challenge. They argue that society privileges people who are considered neurotypical. Not only are neurodiverse people stigmatized with a label that implies disease, or symptom or medical problem, social institutions themselves are unequal. They propose that we strive for “neuro-equality (understood to require equal opportunities, treatment and regard for those who are neurologically different)” (Fenton & Khran, 2007). Likewise, Nick Walker, a queer, transgender, autistic scholar, writes (Walker, 2021):
The neurodiversity paradigm starts from the understanding that neurodiversity is an axis of human diversity, like ethnic diversity or diversity of gender and sexual orientation, and is subject to the same sorts of social dynamics as those other forms of diversity—including the dynamics of social power inequalities, privilege, and oppression.
Rainbow Flags and Black Lives Matter
In 2021, the school board of the small town of Newberg, Oregon, voted to ban the display of Black Lives Matter and Gay pride symbols at school and found themselves in the national spotlight. The video in Figure 13.8 describes the school board’s reasoning and the community’s reaction. This local experience is not unique. In school boards, state legislatures, and national forums students, teachers, parents, and community members discuss these questions. For example, on March 28, 2022, Florida governor Ron DeSantis signed the Parental Rights in Education Bill, which prohibits teachers from teaching about sexual orientation or gender identity in kindergarten through third grade.
Figure 13.8. Newberg’s Ban on Pride Flags at Schools Gets National Attention [YouTube Video]. The Newberg School Board banned Black Lives Matter and LGBTQ+ pride symbols in 2021.
The debate over these decisions reflects a larger social problem for another unique group: LGBTQ+ students, as shown in Figure 13.9. LGBTQ+ is an acronym that stands for lesbian, gay, bisexual, transgender, queer, and more.

Figure 13.9. People who are queer, Black, and disabled in front of a rainbow flag. These students face bullying, discrimination, homelessness, and violence because of their gender and sexual identities.
When we look at experience in school, most research shows that queer youth are more likely to drop out of high school and less likely to attend college than their straight, cisgender peers (Sansone, 2019). When we look at the recent data for Oregon in the 2020 Safe Schools report, LGBTQ+ youth were twice as likely to be bullied or harassed at school (Heffernan & Gutierez-Schmich, 2020).
The Safe Schools report takes an intersectional approach by examining gender identity, sexual orientation, and race and ethnicity. The report finds that the more of these marginalized identities a student holds, the more likely they are to be bullied or to be threatened by a weapon at school (Heffernan & Gutierez-Schmich, 2020). A person who is transgender or nonbinary, queer, Native American, or mixed race is far more likely to have thought about ending their life or tried to end their life, even as early as eighth grade. The weight of this evidence is compelling. Our LGBTQ+ students experience bullying, discrimination, and violence at school and in the wider world.
States are increasingly requiring or banning inclusion of LGBTQ+ related curriculum. As of the end of 2023, six states explicitly required inclusion in the state curricular standards, and seven states explicitly censored discussion of LGBTQ+ people or issues in all school curriculum. The majority of states (29) neither require nor ban such curriculum and discussions (Movement Advancement Project, n.d.). As of the end of 2023, over 300 bills have been introduced that prohibit K–12 educators from talking about race, racism, color, and American history, as well as gender and sexuality (Pen America index of educational gag orders, n.d.). All families, not just those who have members that are Black, multiracial, LGBTQ+, should consider how this attempt to create invisibility of some students and history erasure will affect families and communities.
Licenses and Attributions for Education and Employment
Open Content, Original
“Education and Employment,” “Childcare,” and “Lack of Quality Childcare Impacts Families” by Elizabeth B. Pearce. License: CC BY 4.0.
Open Content, Shared Previously
“Childcare” (the last 3 paragraphs) is excerpted from Vandell, D. L., & Gülseven, Z. (2023). The study of early child care and youth development (Seccyd): Studying development from infancy to adulthood. Annual Review of Developmental Psychology, 5(1), 331–354. https://doi.org/10.1146/annurev-devpsych-120621-035345. Adaptations: excerpting three paragraphs; editing for brevity and reading level.
Figure 13.1 . Photograph by Gautam Arora on Unsplash.
“Family Choices in K–12 Education” adapted from “Schools in the United States” in “Foundations of American Education: A Critical Lens” by Melissa Wells and Courtney Clayton. License: CC BY-NC-SA. Adaptations: shortening for brevity; increasing the focus on families and equity.
“Neurodiverse and Neurotypical Students” and “Rainbow Flags and Black Lives Matter” adapted from “Education as a Social Problem” by Kim Puttman in “Social Problems” [manuscript in press], Open Oregon Educational Resources. License: CC BY 4.0. Adaptations: excerpting two sections; editing for brevity; addition of an overview of legislation related to curricular bans in K–12 education.
Figure 13.7 Photo by walkinred. License: CC BY-SA 2.0 .
“College and University Education” and “Differences between Certificates and Degrees” are remixed from two sources: “Choosing a College to Attend” by Alise Lamoreaux in “Blueprint for Success in College and Career.” License: CC BY 4.0. “Education: The Great Equalizer” by Abigail Knowles, Jon McCann, Rachel Newell, and Kyle Hurley in “Education: The Great Equalizer” by John Kane. License: CC BY 4.0. Adaptation: selected excerpts; editing for brevity and relationship to family life. Additions: narrative, statistics, and images related to the age of college students.
Figure 13.3. “Public School Models by Funding, Enrollment, and Key Characteristics” is from “Schools in the United States” in “Foundations of American Education: A Critical Lens” by Melissa Wells and Courtney Clayton. License: CC BY-NC-SA.
Figure 13.4. “Systemic Racism, Explained” by act.tv. License: Standard YouTube License.
Figure 13.5. “What Is Neurodiversity?” by The Counseling Channel. License: Standard YouTube License.
All Rights Reserved Content
Figure 13.2 “Remembering Gwen Morgan” c. NAEYC., 2015, All rights reserved. Used under fair use.
Figure 13.6. Neurodiversity Is Complicated © Genius Within CIC. Source: Dr. Nancy Doyle, based on the highly original work of Mary Colley. All rights reserved. Used with permission.
Figure 13.8. “Newberg School BLM and Pride are Banned” by KGW News. License Terms: Standard YouTube License.
Figure 13.9. Photograph by Chona Kasinger, Disabled And Here. License: CC BY 4.0.
References
Barnum, M. & LeMee, G. L. (2019, December 5). Looking for a home? You’ve seen GreatSchools ratings. Here’s how they nudge families toward schools with fewer Black and Hispanic students. Chalkbeat. https://www.chalkbeat.org/2019/12/5/21121858/looking-for-a-home-you-ve-seen-greatschools-ratings-here-s-how-they-nudge-families-toward-schools-wi/
Barrientos, J. (2023, June 2). 50-state comparison: State k-3 policies. Education Commission of the States. https://www.ecs.org/50-state-comparison-state-k-3-policies-2023/
Belsky J, Vandell DL, Burchinal M, Clarke-Stewart KA, McCartney K, et al. 2007. Are there long-term effects of early child care? Child Dev. 78(2):681–701
Blair, J. (2013, November 25). Only 42 Percent of Eligible Children Participate in Head Start. Edweek. https://www.edweek.org/policy-politics/only-42-percent-of-eligible-children-participate-in-head-start/2013/11
Billingham, V. (1998). Through the Patient’s Eyes [conference presentation]. Salzburg Global Conference in Salzburg, Austria. https://www.salzburgglobal.org/multi-year-series/general/pageId/6381.
Bustamante A, Dearing E, Zachrisson HD, Vandell DL. 2022. Adult outcomes of sustained high-quality early childcare and education: Do they vary by family income? Child Dev. 93(2):502–23
Doyle, N. (2020). Neurodiversity at Work: A Biopsychosocial Model and the Impact on Working Adults. British Medical Bulletin 135 (1), 108–25. https://doi.org/10.1093/bmb/ldaa021.
EdBuild. (n.d.). Home. http://edbuild.org
Fenton, A. & Krahn, T. (2007) Autism, Neurodiversity and Equality Beyond the “Normal.” Journal of Ethics in Mental Health 2 (2): 6. https://jemh.ca/issues/v2n2/documents/JEMH_V2N2_Theme_Article2_Neurodiversity_Autism.pdf.
Lash, M., & McMullen, M. (2008). The child care trilemma: How moral orientations influence the field. Contemporary Issues in Early Childhood, 9(1), 36-48.
Movement advancement project (n.d.) LGBTQ curricular laws. Retrieved December 10, 2023, from https://www.lgbtmap.org/equality-maps/curricular_laws
National Institute of Child Health and Human Development (2019, June 10). NICHD study of early child care and youth development (Seccyd) historical/for reference only. https://www.nichd.nih.gov/research/supported/seccyd
NICHD ECCRN (Natl. Inst. Child Health Human Dev. Early Child Care Res. Netw.). 2002b. Early child care and children’s development prior to school entry: results from the NICHD Study of Early Child Care. Am. Educ. Res. J. 39(1):133–64
NICHD ECCRN (Natl. Inst. Child Health Human Dev. Early Child Care Res. Netw.). 2005a. Early child care and children’s development in the primary grades: follow-up results from the NICHD Study of Early Child Care. Am. Educ. Res. J. 42(3):537–70
PENAmerica (2021, November). Educational gag orders. https://pen.org/report/educational-gag-orders/
Sansone, D. (2019). LGBT students: New evidence on demographics and educational outcomes. Economics of Education Review, 73(C). https://econpapers.repec.org/article/eeeecoedu/v_3a73_3ay_3a2019_3ai_3ac_3as0272775719302791.htm
Schanzenbach, D. W. & Bauer, L. (2016, August 19). The long-term impact of the Head Start program. The Brookings Institution. https://www.brookings.edu/articles/the-long-term-impact-of-the-head-start-program/
Staff, E. W. (2004, September 21). Tracking. Education Week. https://www.edweek.org/leadership/tracking/2004/09
U.S. Census Bureau (2015, June 2). Public Elementary-Secondary Education Finance Report, 2013 Data. https://www.cbpp.org/states-provide-nearly-half-of-school-funding
U. S. Department of Health and Human Services, Administration on Children and Families (2021, December 23). Poverty Guidelines and Determining Eligibility for Participation in Head Start Programs. https://eclkc.ohs.acf.hhs.gov/ersea/articulo/poverty-guidelines-determining-eligibility-participation-head-start-programs
U.S. Department of Labor, Bureau of Labor Statistics. (n.d.). Average hours employed people spent working on days worked by day of week, 2022 annual averages; United States Department of Labor, U.S. Bureau of Labor Statistics, https://www.bls.gov/charts/american-time-use/emp-by-ftpt-job-edu-h.htm
U. S. Department of Labor, Bureau of Labor Statistics (2019). National Longitudinal Survey of Youth 1997 cohort, 1997-2017 (rounds 1-18). Center for Human Resource Research (CHRR), The Ohio State University. Columbus, OH.
Vandell DL, Belsky J, Burchinal M, Steinberg L, Vandergrift N, NICHD Early Child Care Research Network. 2010. Do effects of early childcare extend to age 15 years? Child Dev. 81:737–56
Walker, N. (2021). Neurodiversity: Some Basic Terms and Definitions [blog post]. Neuroqueer: The Writings of Dr. Nick Walker. https://neuroqueer.com/neurodiversity-terms-and-definitions/.