
9.2 The Aging Population
Since its creation in 1790, the U.S. Census Bureau has been tracking age in the population. Age is an important factor to analyze along with accompanying demographic figures, such as income and health. The population pyramid in figure 9.2 shows projected age distribution patterns for the next several decades. As you go from the “pyramid” shape in green (representing 2010) to the fatter “bullet” shape in dark purple (representing 2030) and on to the “rectangle” shape in lighter gray-purple (representing 2050), you can see that the population has many more people surviving into the older categories. This squaring up of the population means that the average age of the population is growing older, and the ratio of children and younger adults to older adults is decreasing.

Statisticians use data to calculate the median age of a population—that is, the number that marks the halfway point in a group’s age range. In the United States, the median age is about 40 (U.S. Census Bureau, 2022). That means that about half of the people in the United States are under 40 and about half are over 40. This median age has been increasing, which indicates the population as a whole is growing older.
This demographic change has enormous implications in terms of economics, health, and social needs. This also means that many more professionals are needed who are familiar with the needs of older adults—not only geriatricians (medical professionals who focus on the health of older adults) but gerontologists, who study the other aspects impacted by aging, including economics, social services, mental health, and spirituality.
Demographic Changes Over Time
Demographically, the U.S. population over 65 years old increased from 3 million in 1900 to 33 million in 1994 (Hobbs, 1994) and to 36.8 million in 2010. This is a greater than tenfold increase in the over-65 population, compared to a mere tripling of both the total population and of the population under 65 years old (Hobbs 1994).
There are several reasons why the United States is aging so rapidly. One of these is life expectancy: the average number of years a person born today may expect to live. When we review Census Bureau statistics grouping Americans by age, it is clear that in the United States, at least, we are living longer. In 2010, there were about 80,000 centenarians (age one hundred or higher) in the United States alone. They make up one of the fastest-growing segments of the population (Boston University School of Medicine, 2014). People over 90 years of age now account for 4.7 percent of the older population, defined as age 65 or above. This percentage is expected to reach 10 percent by the year 2050 (U.S. Census Bureau, 2011). As of 2013, the U.S. Census Bureau reports that 14.1 percent of the total U.S. population is 65 years old or older.
It is interesting (and somewhat alarming) to note that not all people in the United States age equally. Different ethnicities and socioeconomic groups can expect different outcomes as they age. The latest data from the National Institutes of Health estimates the average life expectancy of Asian Americans at 85.7 years, 82.2 years for the Latino population, 78.9 for Whites, 75.3 for the Black population, and a mere 73.1 years for American Indian/Alaskan Natives (NIH, 2022). The major cause of this difference is the likely accumulation of inequities throughout life that impact people’s health as they age. We discuss this in more detail later in the chapter.
Consequences of an Aging World
From 1950 to approximately 2010, the global population of individuals aged 65 and older increased by a range of 5 to 7 percent (Lee, 2009). This percentage is expected to increase and will have a huge impact on the dependency ratio: the number of citizens who are unable to work due to age or disability compared to those who can work. (Bartram & Roe, 2005).
As the population ages, family structures change. There are two major factors influencing the structure of the family. Traditionally, we refer to our ancestral chart as our family tree. Its branches get wider with every generation. However, along with living longer lives, people are having fewer children. This has changed family structure to what Vern Bengtson, a well-known gerontologist, referred to as a beanpole family structure. Each generation is living longer, with fewer members in each, resulting in a longer, thinner chart rather than the traditional tree shape. This means each family has fewer members to rely on when help is needed.
As health care improves and life expectancy increases across the world, elder care will become an emerging issue. With fewer working-age citizens available to provide home care and long-term assisted care for older adults, the costs of elder care are likely to increase (Wienclaw, 2009).
Worldwide, the expectation governing the amount and type of elder care varies from culture to culture. For example, in Asia the responsibility for elder care lies firmly on the family (Yap et al., 2005). This is different from the approach in most Western countries, where older adults are considered independent and are expected to tend to their own care. Western countries are more likely to rely on formal caregivers (professionals paid to provide such services) rather than informal caregivers (friends or family members who provide unpaid care).
Within the United States, not all demographic groups treat aging the same way. While most people in the United States are reluctant to place their older relatives into out-of-home assisted care, demographically speaking, the groups least likely to do so are Latine, African Americans, and Asians (Bookman & Kimbrel, 2011). A 2018 data review (Themeer et al., 2018) showed that Black and Latine families are much less likely to use nursing homes, and that this division became bigger when socioeconomic differences were taken into account. However, it may not be just cultural or economic differences. This data may also reflect the lack of facilities with bilingual staff or culturally appropriate foods.
Globally, the United States and other developed nations are fairly well equipped to handle the demands of an increasing aging population. However, developing nations face similar increases without comparable resources. Poverty among older adults is a concern, especially among women. This trend can be seen in many developing nations due to the number of older women in those countries who are single, illiterate, and not a part of the labor force (Mujahid, 2006).
An aging population impacts society in many ways. The loss of workers will have economic impacts, and families may be stretched to provide care for older family members. The availability of at-home caregivers has decreased, as most families require two incomes to stay above the poverty line. Also, the availability of social services and assistance can vary by region. In Oregon, for example, the more populous Willamette Valley tends to have many resources available to residents. However, many areas in rural Eastern Oregon have few or no resources available. Older adults who live in rural areas, therefore, are much more vulnerable to changes in their ability to care for themselves. It is hoped that electronic resources can begin to fill some of these needs. Current research includes the role of telemedicine visits, electronic health monitoring, and even robotic pets and caregivers.
Grandparents as a Primary Resource
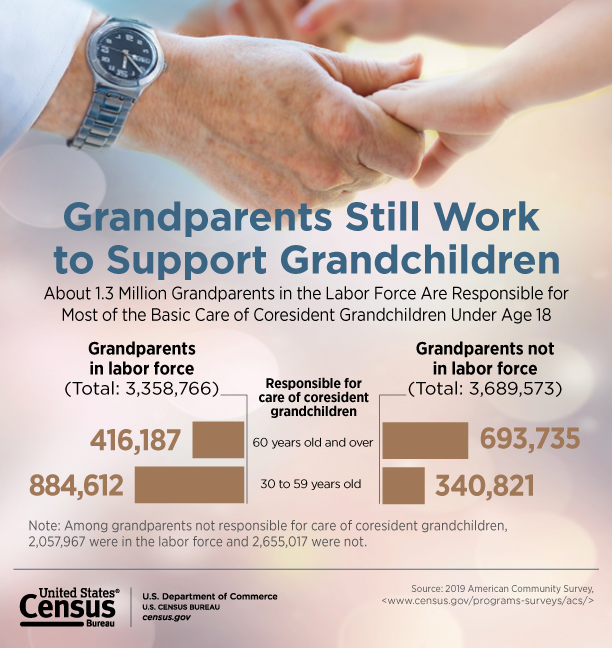
People in the United States, in general, are living longer, and living healthier and more active lives. Families are having fewer children, and grandchildren are more widely spaced apart by age. This creates a capacity for both more active grandparenting than in previous generations, as well as the possibility of actual parenting of grandchildren and other caregiving relationships. It is believed that the combination of families having fewer children and living longer has led to more involvement by grandparents with their grandchildren, resulting in the increase in multigenerational families (where more than two generations live together) and grandfamilies (where grandparents or great-grandparents provide the primary care for their grandchildren). Simply put, people are living long enough to see their grandchildren be born and to be an active part of their lives. Figure 9.3 shows the percentage of grandparents who are responsible for the primary care of grandchildren.
Simultaneously, rates of single parents and divorced parents have increased. These parents may call on their own parents for financial support, childcare, shared housing, or other needs. In addition, social problems such as addiction and mass incarceration contribute to the need for more adults to be involved in parenting. Older adults, including grandparents, are more frequently involved in caregiving and supporting children and grandchildren than ever before. It is important to note that it is not only middle class or wealthy grandparents who are helping out; poor and working class grandparents are struggling to help out their children and grandchildren.
Multigenerational households are on the rise after reaching a low of 12 percent in 1980. In 2016 roughly one in five adults (20 percent) lived in a multigenerational household, with an increase being attributed to the economic recession that started in 2009 (Cohn & Passel, 2018). The National Association of Realtors reports that multigenerational home purchases increased during the COVID-19 pandemic by four percentage points (Ventiera, 2020). These trends point out the connection between economic change, life expectancy, and living arrangements that affect family relationships.
Licenses and Attributions
“The Aging Population” from “Who Are the Elderly? Aging in Society” in Introduction to Sociology 2e by Tonja R. Conerly, Kathleen Holmes, Asha Lal Tamang, OpenStax. License: CC BY-SA 4.0. Edited by Yvonne M. Smith for style and addition of current data. Revised by Martha Ochoa-Leyva.
“Grandparents as Primary Resource” is by Elizabeth B. Pearce and licensed CC BY-SA 4.0. Edited to add current data.
Figure 9.2. “Age and Sex Structure of the Population for the United States: 2010, 2030, and 2050” by Grayson K. Vincent and Victoria A. Velkof, U.S. Census Bureau, is in the public domain.
Figure 9.3. Grandparents Still Work to Support Grandchildren by U.S. Census Bureau is in the public domain.
