
4.5 Probability and System Reliability
There are many scenarios which can be though of as a collection of events in which, in order to realize a desired outcome, the events must happen one after the other. Consider passing through several intersections on your way to work. Arriving on time depends on whether or not you have to wait at a light. Passing through intersections, one after the other in order, is an example of events in series. Typically, however, we have options as we drive to work. Suppose as you drive to work, an intersection is blocked by a traffic accident, so you take an alternate route, passing though different intersections, and you make it to work. When you can pass through one set of intersections or a different set of intersections, you have a system of events in parallel. We have already discussed the core ideas involving probability calculations, but it will helpful to summarize our formulas again as they relate to events in series or in parallel.
Series of Events: All Events Must Happen in Order (AND)
If A and B are two dependent events defined on a sample space, then
P(A AND B ) = P(A  B ) = P(B )P(A |B ).
If A and B are independent events, then P(A |B ) = P(A ) and we have
P(A AND B ) = P(A B ) = P(A )P(B ).
Parallel Events: Some Events or Other Events Must Happen (OR)
If A and B are defined on a sample space, then
P(A OR B ) = P(A  B ) = P(A) + P(B ) – P(A B ).
If A and B are mutually exclusive events, then P(A B) = 0.
P(A OR B ) = P(A B) = P(A) + P(B) – P(A B) becomes P(A B ) = P(A) + P(B ).
Example 1: Jiashao Bridge

Bridges connecting cities across large spans of water have greatly reduced commute times and distances. However, large traffic volume brings greater risk for major accidents blocking traffic. The 10.1 kilometer long Jiashao Bridge in China is the longest and widest multi-tower cable-stayed bridge in the world. Accidents were tracked by location along the bridge. In one direction, on any given day, each of the 2-kilometer sections (A, B, C, D, and E) has a different probability of an accident: 0.016, 0.015, 0.013, 0.014, and 0.018, respectively.
- Describe the what must happen to get from one side of the bridge to the other without encountering an accident. Is this an example of events in parallel or in series? Explain.
- Calculate the probability of getting across the bridge without an accident. Assume independence.
Answers:
- To get from one side of the bridge to the other, there can be no accident in any of the 2-kilometer sections. Because a vehicle must pass through each section, one-by-one in order, this events are in series. We want no accident in section A and no accident in section B and no accident in section C, etc., for all five sections. The event “not having an accident” is the complement of event “having an accident.” The complementary events are A’, B’, C’, D’, and E’ with corresponding probabilities of 0.984, 0.985, 0.987, 0.986, and 0.982.
- Because we assume independence, the probability of getting across the bridge without an accident is calculated as P(A’ B’ C’ D’ E’)= P(A’)P(B’)P(C’)P(D’)P(E’) = (0.984)(0.985)(0.987)(0.986)(0.982) = 0.926. We conclude there is a 92.6% chance of getting across the bridge on any given day without an accident.
Example 2: Roller Chain Failure

A roller chain consists of a series of cylindrical rollers connected by links. The roller chain is a key part of the production process in any industry, and it allows raw materials and items to move between different areas of production. When there is a failure during manufacturing, it can cause costly delays. The most common cause of a roller chain failure is overloading the chain with too high a load.
Suppose two parts of a manufacturing process system are connected by a 10-link roller chain. Under a normal load the probability of any one link failing is 0.002 but under excess load, the probability of any one link failing increases to 0.01. Calculate the probability the roller chain fails under both situations.
Answer: Each link in the roller chain can be thought of as independent and if any one link fails, then the chain fails. Failing and not failing are complementary events, so we can calculate the probability of roller chain failure by considering the complementary event. Under a normal load the probability of a single link not failing is 0.998. The links together form a series of events, so P(roller chain failure) = 1 – P(roller chain not failing) = 1 – (0.998)10 ≈ 0.02. Under excess load, P(roller chain failure) = 1 – P(roller chain not failing) = 1 – (0.99)10 ≈ 0.10. Approximately 2% of the operation time the chain will fail under a normal load, however, it will fail about 10% of the time under excess load.
Reliability
Reliability analysis is an area of systems engineering that estimates the ability of the system to function without failure. Consider a system of circuits, switches, or components in parallel, in series, or in a combination of both. The reliability of the system is defined as the probability that the system does not fail. There are certainly systems which would require advanced mathematics to analyze. In this section we will focus on small systems in series, parallel, or both.
Example 3: Parallel Electrical Supplies
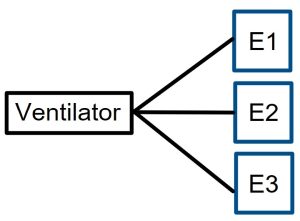 A patient in critical condition needs a ventilator in order to survive. Due to a severe storm, the hospital electrical supply (E1) is in danger and may fail with probability 0.4. Two additional generators are set up (E2 and E3), so that as long as one of the three sources of electricity is working, the patient will be fine. Each generator functions properly with a probability of 0.85. Notice, this configuration sets up redundancy for safety.
- Find the reliability of this system.
- If the main electrical source fails for several days and the patient must rely on the system of two generators, find the new reliability.
Answers:
- This system is in parallel. The system will fail only if all three electrical supplies fail. As long as any one, two, or three sources produce electricity, the system functions. We assume the hospital electrical supply and each generator function independently. The reliability is calculated as 1 – P(E1 fail and E2 fail and E3 fail) = 1 – P(E1 fail)P(E2 fail)P(E3 fail) = 1 – (0.4)(0.15)(0.15) ≈ 0.991.
- This system is in still parallel with just the two generators. The system will fail only if both electrical supplies fail. As long as any one or two sources produce electricity, the system functions. The reliability is calculated as 1 – P(E2 fail and E3 fail) = 1 – P(E2 fail)P(E3 fail) = 1 – (0.15)(0.15) ≈ 0.9775. The reliability has decreased
There are systems in which even a small failure of a component can lead to a total breakdown of the system. If an operation is critical, the system needs to build in a tolerance for component failure to maintain proper operation of the system. When there is component breakdown, the system may function at a reduced capacity. We experience reduced capacity caused by partial failures, for example, in daily life when components fail and there are Internet slowdowns, traffic congestion, or slower call center response times.
There are fault-tolerance computer systems which are designed to handle various failures. Redundancy of components is often a way to accomplish a fault-tolerant system. Early such systems were developed for military use. NASA developed long-life and no maintenance (LLNM) systems for space projects, such as Project Apollo. The computers used in Voyager 1 and 2, which were launched in 1977 and are still in operation today, consisted three systems, each having dual-redundancy. There were two Computer Command Systems, two Flight Data Systems, and two Attitude Articulation Control Systems. They could detect errors and bring up redundant components if needed.
Example 4: Component Failure and Desired Reliability
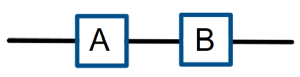 Consider a system consisting of two components in series, A and B. These are older components with probability of function estimated at 0.7 and 0.8, respectively.
- Calculate the reliability of the older system, that is, calculate the probability the system functions.
- Suppose it is critical that this system has a reliability of 0.9, that is, it must function 90% of the time. If we replace both components with newer, more reliable identical parts, what must their individual reliability be?
- What if it is not possible to obtain the individual component reliability needed from question 2 to achieve a 90% system reliability? Create redundancy by including an identical parallel subsystems, with all new and identical components.
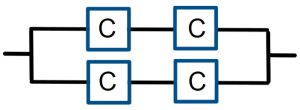 What must the reliability of each identical component be in order for the redundant system to function with a reliability of 90%?
Answers:
- The system in series will function only when components A and B both function at the same time. We can assume the components function independently and we know P(A) = 0.7 and P(B) = 0.8 are the probabilities of each component functioning. P(A and B) = P(A B) = P(A)P(B) = (0.7)(0.8) = 0.56. This older system in series has a 56% reliability.
- Replace both old components with identical new components. Let’s call the new components each C, which have identical but unknown reliability. P(C) is the unknown probability the component functions. If we want the system to have a reliability of 0.90, then P(C and C) = P(C C) = P(C)P(C) = 0.90. This is a quadratic equation, with [P(C)]2 = 0.90, so P(C) =
 ≈ 0.9486. So, we would have to install components which have approximately 95% reliability.
 - The updated redundant system contains duplicate subsystems in parallel. P(C) is the unknown probability a component functions. This redundant system will fail only when both subsystems fail. The probability each individual subsystem fails is 1 – P(C)P(C). Thus, the probability the system fails is [1 – P(C)2]2 = 0.10. Solving for P(C) =
 ≈ 0.827. The redundant system requires individual components to have only about 83% reliability.
Examples 5: Heater, Pump, and Turbines
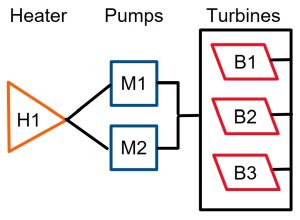 Consider a system composed of one heater (H1), two pumps (M1 and M2), and three turbines (B1, B2, and B3). The two pumps work in parallel, so the system operates if at least one pump operates. The turbine sub-system operates if at least two of the turbines operate. All together, the heater, pump, and turbine sub-system are connected in a series, so they all must work properly in order for the entire system to work. Each component is a different age and will fail independently of the others with the following probabilities: P(H1 Fail) = 0.05, P(M1 Fail) = 0.01, P(M2 Fail) = 0.20, P(B1 Fail) = 0.06, P(B2 Fail) = 0.11, and P(B3 Fail) = 0.15.
- Find the reliability of the system.
- How much will the reliability go up if pump M2 is replaced with a new one with probability of failure 0.01?
Answers:
- Let’s consider each component separately. The probability the heater works is P(H1 Works) = 1 – 0.05 = 0.95.
The probability pump M1 works or M2 works is P(M1 Works or M2 Works) = P(M1 Works) + P(M2 Works) – P(M1 Works and M2 Works) = (1 – 0.01) + (1 – 0.20) – (1 – 0.01)(1 – 0.20) = 0.99 + 0.80 – (0.99)(0.80) ≈ 0.998.
The turbine sub-system works if any two turbines work or if all three work. There are four ways this can happen.
P(B1 Work and B2 Work and B3 Work) = (1 – 0.06)(1 – 0.11)(1 – 0.15) ≈ 0.711
P(B1 Fail and B2 Work and B3 Work) = (0.06)(1 – 0.11)(1 – 0.15) ≈ 0.045
P(B1 Work and B2 Fail and B3 Work) = (1 – 0.06)(0.11)(1 – 0.15) ≈ 0.088
P(B1 Work and B2 Work and B3 Fail) = (1 – 0.06)(1 – 0.11)(0.15) ≈ 0.125
Thus, because each of these events is mutually exclusive, we add probabilities to see the turbine sub-system works with a probability of 0.969.
The system reliability is (0.95)(0.998)(0.969) ≈ 0.9187. - If pump M2 is replaced with a new pump, then the probability M1 works or the new M2 works is P(M1 Works or New M2 Works) = P(M1 Works) + P(New M2 Works) – P(M1 Works and New M2 Works) = (1 – 0.01) + (1 – 0.01) – (1 – 0.99)(1 – 0.99) = 0.99 + 0.99 – (0.99)(0.99) ≈ 0.9999.
None of the other components changed, so the updated reliability of the system is (0.95)(0.9999)(0.969) ≈ 0.9205, which offers a slight increase in reliability over 0.9187.
Sources
Peiyan Chen, Feng Chen, Young-Ji Byon, Xiaoxiang Ma, Bowen Dong, Ming Zhu, “Assessment on the crash risk factors of a typical long-span bridge using oversampling-based classification method and considering bridge structure movement,” International Journal of Transportation Science and Technology, Volume 10, Issue 4, 2021, Pages 329-341, ISSN 2046-0430, https://doi.org/10.1016/j.ijtst.2020.10.003.
Svoboda, Antonin, “From Mechanical Linkages to Electronic Computers: Recollections from Czechoslovakia,” in Metropolis, N., J. Howlett, and Gian-Carlo Rota, A History of Computing in the Twentieth Century, Academic Press, New York, 1980, pp. 579-586.
“The Brains of the Voyager Spacecraft: Command, Data, and Attitude Control Computers,” Chantelle Dubois, July 09, 2017, All About Circuits, available online at https://www.allaboutcircuits.com/news/voyager-mission-anniversary-computers-command-data-attitude-control/, last accessed March, 20, 2024.
A system in series has events occurring one after the other and functions properly only when all the events or components function properly.
A system of events in which there are at least two ways to achieve an outcome and fails only when both ways fail.

Feedback/Errata