
12.3 Xbar R Control Chart Examples
We have worked through the overarching ideas in the theory and creation of the Xbar and R Control Charts. In general, the process requires the following steps:
- Decide on the process to be monitored, determine the rational subgroups, and collect data.
- Create the R Chart and analyze.
- Determine and correct any special causes for points in the R Chart that are violations of the WECO Rules.
- Omit the out-of-control points and recreate a new R Chart.
- When the R Chart is in control, compute and create the Xbar Chart without the previously omitted data.
- Determine and correct any special causes for points in the Xbar Chart which violate the WECO Rules.
- Collect more data and continue to monitor Xbar and R.
Example 1: Patient Record Processing Time
The coding manager at Metropolis Hospital is interested in setting up control charts to monitor the processing time of inpatient records. The manager defined processing time as the total time it takes, in minutes, to code and abstract a record. To get started, the manager looked up the standards about the mean and standard deviation of inpatient processing times but found none. Subsequently, the manager decided to estimate the process parameters using sample data. Table 1 shows the data the manager sampled from 30 random days in 2018. On each day the manager sampled 5 records.
| Sample Number |  |
 |
 |
 |
 |
 |
 |
| 1 | 28 | 32 | 34 | 32 | 33 | 6 | 31.8 |
| 2 | 31 | 27 | 31 | 28 | 30 | 4 | 29.4 |
| 3 | 15 | 31 | 20 | 34 | 15 | 19 | 23 |
| 4 | 33 | 32 | 31 | 31 | 30 | 3 | 31.4 |
| 5 | 26 | 27 | 34 | 29 | 34 | 8 | 30 |
| 6 | 34 | 27 | 32 | 30 | 31 | 7 | 30.8 |
| 7 | 25 | 34 | 33 | 33 | 25 | 9 | 30 |
| 8 | 32 | 32 | 35 | 26 | 32 | 9 | 31.4 |
| 9 | 28 | 33 | 35 | 29 | 30 | 7 | 31 |
| 10 | 25 | 32 | 29 | 28 | 50 | 25 | 32.8 |
| 11 | 33 | 32 | 30 | 35 | 35 | 5 | 33 |
| 12 | 34 | 29 | 21 | 32 | 26 | 13 | 28.4 |
| 13 | 27 | 30 | 31 | 31 | 35 | 8 | 30.8 |
| 14 | 27 | 28 | 28 | 34 | 34 | 7 | 30.2 |
| 15 | 29 | 33 | 33 | 25 | 32 | 8 | 30.4 |
| 16 | 27 | 26 | 27 | 25 | 35 | 10 | 28 |
| 17 | 29 | 33 | 32 | 30 | 35 | 6 | 31.8 |
| 18 | 29 | 27 | 29 | 25 | 34 | 9 | 28.8 |
| 19 | 33 | 27 | 32 | 33 | 44 | 17 | 33.8 |
| 20 | 32 | 27 | 28 | 29 | 28 | 5 | 28.8 |
| 21 | 35 | 32 | 34 | 32 | 27 | 8 | 32 |
| 22 | 28 | 33 | 28 | 40 | 30 | 12 | 31.8 |
| 23 | 34 | 32 | 32 | 30 | 32 | 4 | 32 |
| 24 | 35 | 25 | 25 | 28 | 34 | 10 | 29.4 |
| 25 | 28 | 25 | 26 | 31 | 27 | 6 | 27.4 |
| 26 | 27 | 33 | 33 | 34 | 34 | 7 | 32.2 |
| 27 | 33 | 31 | 29 | 27 | 10 | 23 | 26 |
| 28 | 32 | 31 | 35 | 31 | 29 | 6 | 31.6 |
| 29 | 30 | 27 | 35 | 33 | 28 | 8 | 30.6 |
| 30 | 32 | 25 | 33 | 25 | 29 | 8 | 28.8 |
- Determine the UCL, CL, and LCL for the R Chart.
- Create the R Chart, determine if it is in control based on Rule 1 of WECO Rules, and suggest a course of action.
- Assume the special cause of variation was found and corrected. Carry out your plan, create a new R chart, and determine if it is in control based on Rule 1 of WECO Rules.
Solutions:
- For the R Chart, because the rational subgroup has a sample size of
 = 5, the control limits require
  = 0 and
  = 2.114. Using Table 1,
  = 9.2333.
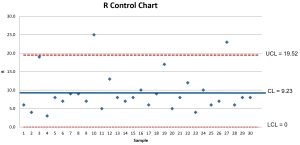
LCL = = (0)(9.2333) = 0
CL = = 9.23
UCL = = (2.114)(9.2333) = 19.52
 - The R Chart for this process shows two points greater than the UCL and one point very close to the UCL. The R Chart shows the process variation is out of control and two points should be examined, namely points 10 and 27 to determine the special cause of variation.
- Points 10 and 27 were eliminated. The new is 8.1786.
LCL = = (0)(8.1786) = 0
CL = = 8.18
UCL = = (2.114)(8.1786) = 17.29
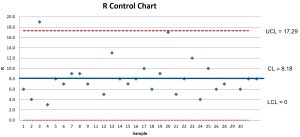
The R Chart shows variation is still out of control. A special cause of variation should be found.
Example 2 – Post Intervention Patient Record Processing Time
The coding manager has discovered and eliminated all the special causes of the out of control variation in processing times. It required employee retraining and an adjustment to the process. New data has been collected to monitor the processing time of inpatient records. The manager defined processing time as the total time it takes, in minutes, to code and abstract a record. To get started, the manager looked up the standards about the mean and standard deviation of inpatient processing times but found none. Subsequently, the manager decided to estimate the process parameters using sample data. Table 1 shows the data the manager sampled from 30 random days in 2018. On each day the manager sampled 5 records.
| Sample Number | |
|
|
|
|
|
|
| 1 | 28 | 32 | 34 | 32 | 33 | 6 | 31.8 |
| 2 | 31 | 27 | 31 | 28 | 30 | 4 | 29.4 |
| 3 | 27 | 26 | 26 | 28 | 26 | 2 | 26.6 |
| 4 | 33 | 32 | 31 | 31 | 30 | 3 | 31.4 |
| 5 | 26 | 27 | 34 | 29 | 34 | 8 | 30 |
| 6 | 34 | 27 | 32 | 30 | 31 | 7 | 30.8 |
| 7 | 25 | 34 | 33 | 33 | 25 | 9 | 30 |
| 8 | 32 | 32 | 35 | 26 | 32 | 9 | 31.4 |
| 9 | 28 | 33 | 35 | 29 | 30 | 7 | 31 |
| 10 | 25 | 26 | 29 | 28 | 25 | 4 | 26.6 |
| 11 | 33 | 32 | 30 | 35 | 35 | 5 | 33 |
| 12 | 34 | 29 | 21 | 32 | 26 | 13 | 28.4 |
| 13 | 27 | 30 | 31 | 31 | 35 | 8 | 30.8 |
| 14 | 27 | 28 | 28 | 34 | 34 | 7 | 30.2 |
| 15 | 29 | 33 | 33 | 25 | 32 | 8 | 30.4 |
| 16 | 27 | 26 | 27 | 25 | 35 | 10 | 28 |
| 17 | 29 | 33 | 32 | 30 | 35 | 6 | 31.8 |
| 18 | 29 | 27 | 29 | 25 | 34 | 9 | 28.8 |
| 19 | 33 | 27 | 32 | 33 | 33 | 6 | 31.6 |
| 20 | 32 | 27 | 28 | 29 | 28 | 5 | 28.8 |
| 21 | 35 | 32 | 34 | 32 | 27 | 8 | 32 |
| 22 | 28 | 33 | 28 | 40 | 30 | 12 | 31.8 |
| 23 | 34 | 32 | 32 | 30 | 32 | 4 | 32 |
| 24 | 35 | 25 | 25 | 28 | 34 | 10 | 29.4 |
| 25 | 28 | 25 | 26 | 31 | 27 | 6 | 27.4 |
| 26 | 27 | 33 | 33 | 34 | 34 | 7 | 32.2 |
| 27 | 28 | 26 | 27 | 27 | 25 | 3 | 26.6 |
| 28 | 32 | 31 | 35 | 31 | 29 | 6 | 31.6 |
| 29 | 30 | 27 | 35 | 33 | 28 | 8 | 30.6 |
| 30 | 32 | 25 | 33 | 25 | 29 | 8 | 28.8 |
- Create and analyze an R Chart. Make a recommendation.
- Create and analyze an Xbar Chart. Make a recommendation.
Solutions:
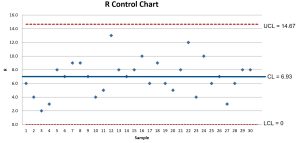
- For the R Chart, because the rational subgroup has a sample size of = 5, the control limits require = 0 and = 2.114. Using the table, = 6.9333.
LCL = = (0)(6.9333) = 0
CL = = 6.93
UCL = = (2.114)(6.9333) = 14.67
The R Chart shows the variation is in control, so an Xbar Chart can be constructed.
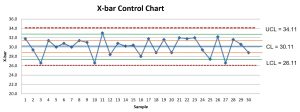
- For the Xbar Chart, because the rational subgroup has a sample size of = 5, the control limits require
 = 0.577. From Table 2, we calculate = 6.9333 and
  = 30.1067.
LCL = = 26.11
CL = = 30.11
UCL = = 34.11
The Xbar Chart shows the process mean is in control, so an Xbar Chart can be constructed.
- Calculate the
 and
and  control limits for the Xbar Chart and use the WECO Rules to determine if the process mean is in control. For control limits we find
  .
. . Similarly, we find the control limits as
  .Each control limit is plotted.
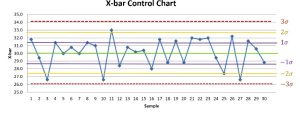
There are no points above the upper
 or below the lower control limits. There are no cases of two of three consecutive points landing above the
  or below the
  control limits. There are no cases of four of the last five points landing above
  or below
  control limits. Never to eight consecutive points land on the same side (above or below) the center line. After examining all the WECO Rules, the Xbar Chart is in control.
Source
Applications of Control Charts for Quality Improvement in Health Care, by Jerome Niyirora, CC By-NC-SA 4.0

Feedback/Errata