
9.5 Hypothesis Z-Test for a Single Proportion
Hypothesis testing for proportions will proceed much as it did for means, so as we continue to investigate hypothesis testing, focus on the parameter under consideration and assumptions that can be made. These will lead you to the appropriate hypothesis test statistic.
When we find a random sample and note the number of successes or failures, we are dealing with a binomial random variable, as long as each item is independent. Therefore, when our research question involves the population proportion, we will base the hypothesis test on the sample proportion. As we have discussed, for a large sample size, the Central Limit Theorem can be used to specify the distribution of the sample proportion.

You might recall, when we were creating the confidence interval for the population proportion, we needed the population proportion in order to specify the margin of error, which was impossible because it was exactly the thing we were trying to estimate! Because the sample proportion had to be used instead, which introduced additional variation, the Agresti-Coull Method was created to produce a more reliable confidence interval. We will not have this same problem when we need to conduct a hypothesis test for a proportion. Because the null distribution is formed by assuming the null hypothesis is true, the value of the population proportion in the null hypothesis will be used to completely specify the mean and standard deviation of the test statistic.
What about for a small sample? If the sample size is small, you might wonder if there is a t-test for a single proportion. The short answer is that the t-test is not appropriate. Recall that a requirement to use the Student’s t-distribution is that the population from which the sample was taken must be normal or approximately normally distributed. When the parameter of interest is a proportion, the underlying population is actually binomial. How will we know if we can actually rely on the normal distribution? A good rule of thumb is to use a normal approximation as long as we can assume independence and verify  and
and  are both greater than 10.
Z-Test for a Single Population Proportion
When performing a hypothesis test involving a single population proportion  the underlying sampling distribution of the
  is the normal distribution, as long as there is simple random sample of independent Bernoulli trials with
  and
and  both greater than 10.
For hypothesis tests involving:  ,
,  , or
, or  ,
,
We assume  is true, so the null distribution is
  .
.
The test statistic (z-score) is  .
.
Probability associated with the test statistic can be found from the standard normal distribution because  . Equivalently, the p-value can be found using the null distribution directly.
If  , calculate the p-value as the sum of the areas in the tails cut off by
  and
and  .
.
If  , calculate the p-value as the area to the right of the test statistic, .
If  , calculate the p-value as the area to the left of the test statistic, .
Steps to Conducting a Hypothesis Test for a Single Proportion:
- After considering the research question, define the null and alternate hypothesis statements.
- Assume the null hypothesis is true and define the null distribution, stating how assumptions have been met.
- Under the assumptions that the null hypothesis is true, calculate the test statistic.
- Compute the p-value and create a drawing to support the calculation.
- Form a conclusion and write it in the context of the research question.
Example 1 – Smelling Parkinson’s Disease
A 72-year-old retired nurse from Scotland, with a condition giving her a hypersensitivity to smell, claimed she could smell Parkinson’s disease after noticing her husband started having a musky odor and was subsequently diagnosed with the disease. Neuroscientists were skeptical but decided to put her claims to the test. She was tasked with smelling 12 t-shirts, 6 of which were from people who had Parkinson’s disease, and 6 were from nonaffected people. She concluded 7 of the t-shirts indicated Parkinson’s disease. She correctly identified the disease in all six of the shirts from people with Parkinson’s disease. She categorized one of the t-shirts from the nonaffected people as actually having Parkinson’s disease, which initially seems like an error, however that person was diagnosed with Parkinson’s disease less than a year later.
- Create hypothesis test statements for this study.
- If you can carry out a hypothesis test, then do so, or explain why you cannot.
Solution:
- Whether or not she can correctly identify a t-shirt as being from an individual with the disease or from a nonaffected individual is what is being assessed with this test. If a person with no ability to smell the disease were to randomly guess, then they would have a 50% chance of being successful. This hypothesis test would be about the proportion of time, , this person makes a correct identification. Her claim is that she has an ability to detect the disease, so the alternate hypothesis will be that the proportion of correct identifications is greater than 50%.


- Because this is a test involving proportions, the underlying assumption is that this is a random sample of independent trials. We would have to rely on the researchers to have conducted such an experiment. The issue is with the sample size. In this case
 = 12 and
  = 0.5, so
  , neither of which is greater than 10. The sample size is too small to reliably rely on the normal distribution.
Note: You might wonder what should be done if a hypothesis test based on the normal distribution cannot be run. There are small sample nonparametric tests which do not rely on a particular population. This will not be covered in this text but they are not very robust. You can run a simulation. However, researchers used these initial results to dive into researching biomarkers based on a disease’s olfactory signature. You can read more in the Scientific America article from October 11, 2022.
Example 2 – E-Cigarette Use Among High School Students
The Centers for Disease Control and Prevention (CDC) found that in 2022, 14.1% of high school students reported recent (within the past 30 days) use of e-cigarettes. In 2023, a survey of 300 randomly selected high school students nationally found 30 used e-cigarettes. Is there evidence to suggest the proportion of high school students who use e-cigarettes has declined? Use a 5% significance level? Conduct a hypothesis test using the five steps.
Solution:
- The research question involves the proportion of high school students who use e-cigarettes, so this is a test of a proportion. The alternate hypothesis will state that the proportion of high school students who use e-cigarettes is less than 0.141. The opposite of this claim will be the null hypothesis, that is, the proportion of high school students who use e-cigarettes is greater than or equal to 0.141.
: 
 :
: 
- The study involved a random sample of 300 high school students, with =
 . Due to the large random sample size, the fact that
  , and
, and  , we will be able to use the normal distribution, with
  and the z-test statistic.
 - The test statistic is
 .
. - The p-value is the probability of observing a sample proportion as extreme as we did under the assumption that the null hypothesis is true. With a statistical program it is simple to conduct a hypothesis test using the value of the z-test statistic or, equivalently, with the null sampling distribution directly. Both options are presented in Figure 1.
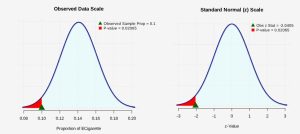
Figure 1: P-value The p-value is the probability of observing a z-test statistic of
= -2.0405 or more extreme. Because this is a one-tailed (left-tailed) test, the p-value will be calculated by finding the probability as  0.02065 or approximately 2.1%.
Alternatively, and equivalently, the probability under the null hypothesis of observing a sample mean of = 0.10 hours or more extreme can be calculated directly as  using the null distribution, giving the same p-value.
 - Assuming the null hypothesis is true, the probability we would observe a sample mean as extreme as the one we observed is 0.021. There is a 2.1% chance of observing a sample as least as extreme as we did, which is less than the 5% level of significance. Because the p-value is smaller than the 5% level of significance, we conclude that we do have enough evidence to reject the null hypothesis. The data do support the claim that e-cigarette use among high school students has declined. The observed sample proportion is statistically significant.
Relationship Between Confidence Intervals and Hypothesis Testing
Confidence intervals and hypothesis tests are similar in that they are both methods of statistical inference and they both rely on an approximated sampling distribution. Confidence intervals use data from a sample to estimate the population parameter, while hypothesis testing sets a hypothesized parameter and use data from a sample to test the hypothesis. Two-tailed hypothesis tests in general go hand-in-hand with two-tailed confidence intervals. In this text, we did not discuss one-sided confidence intervals, although they exist.
Confidence intervals contain a range of reasonable estimates of the population parameter. A 100(1 –  )% confidence interval contains those values for a parameter for which the p-value of a hypothesis will be greater than . This is true for tests involving the mean. However, for the proportion, the confidence interval method had to be adjusted, so this relationship between the confidence interval for a proportion and a hypothesis test for a proportion is only approximately true.
Sources
Kwon, D. (2024, May 2). A supersmeller can detect the scent of Parkinson’s, leading to an experimental test for the illness. Scientific American. https://www.scientificamerican.com/article/a-supersmeller-can-detect-the-scent-of-parkinsons-leading-to-an-experimental-test-for-the-illness/
CDC Newsroom. (2016, January 1). CDC. https://www.cdc.gov/media/releases/2022/p1007-e-cigarette-use.html

Feedback/Errata