
1.1 Introduction: Sampling and Data

Learning Objectives
By the end of this chapter, the student should be able to:
- Recognize and discuss key terms used in statistics.
- Apply various types of sampling methods to data collection.
- Interpret frequency tables.
You are probably asking yourself the question, “When and where will I use statistics?” If you read any newspaper, watch television, or use the Internet, you will see statistical information presented. There are statistics about crime, sports, education, politics, health care, and real estate. Websites gather data on users with every click of the mouse. What do they do with the data? Typically, when you read a newspaper article or watch a television news program, you are given information collected through some sampling method and summarized. With this information, you may make a decision about the correctness of a statement, claim, or fact. For each of us, learning about statistics and statistical processes can help us to make the best educated guess with the information we have.
A fundamental aspect of science and engineering is the collection and analysis of data. How can we use data collected, which is actually a sample from a larger population of possible values, to make decisions or make processes better and more reliable? A future engineer or scientist will undoubtedly use statistics and analyzing and interpreting data will play an increasingly important role in work and daily life. The fields of economics, engineering, business, psychology, and biology, require at least one course in statistics, just to name a few!
Since you will be given statistical information, you need to know some techniques for analyzing the information thoughtfully. Included in this chapter are the basic ideas, vocabulary, and concepts of probability and statistics. You will soon understand that statistics and probability work together. You will also learn how data are gathered and why data gathering methods are so important. Take a look at the following diagram which shows the relationship between statistical concepts and approaches.
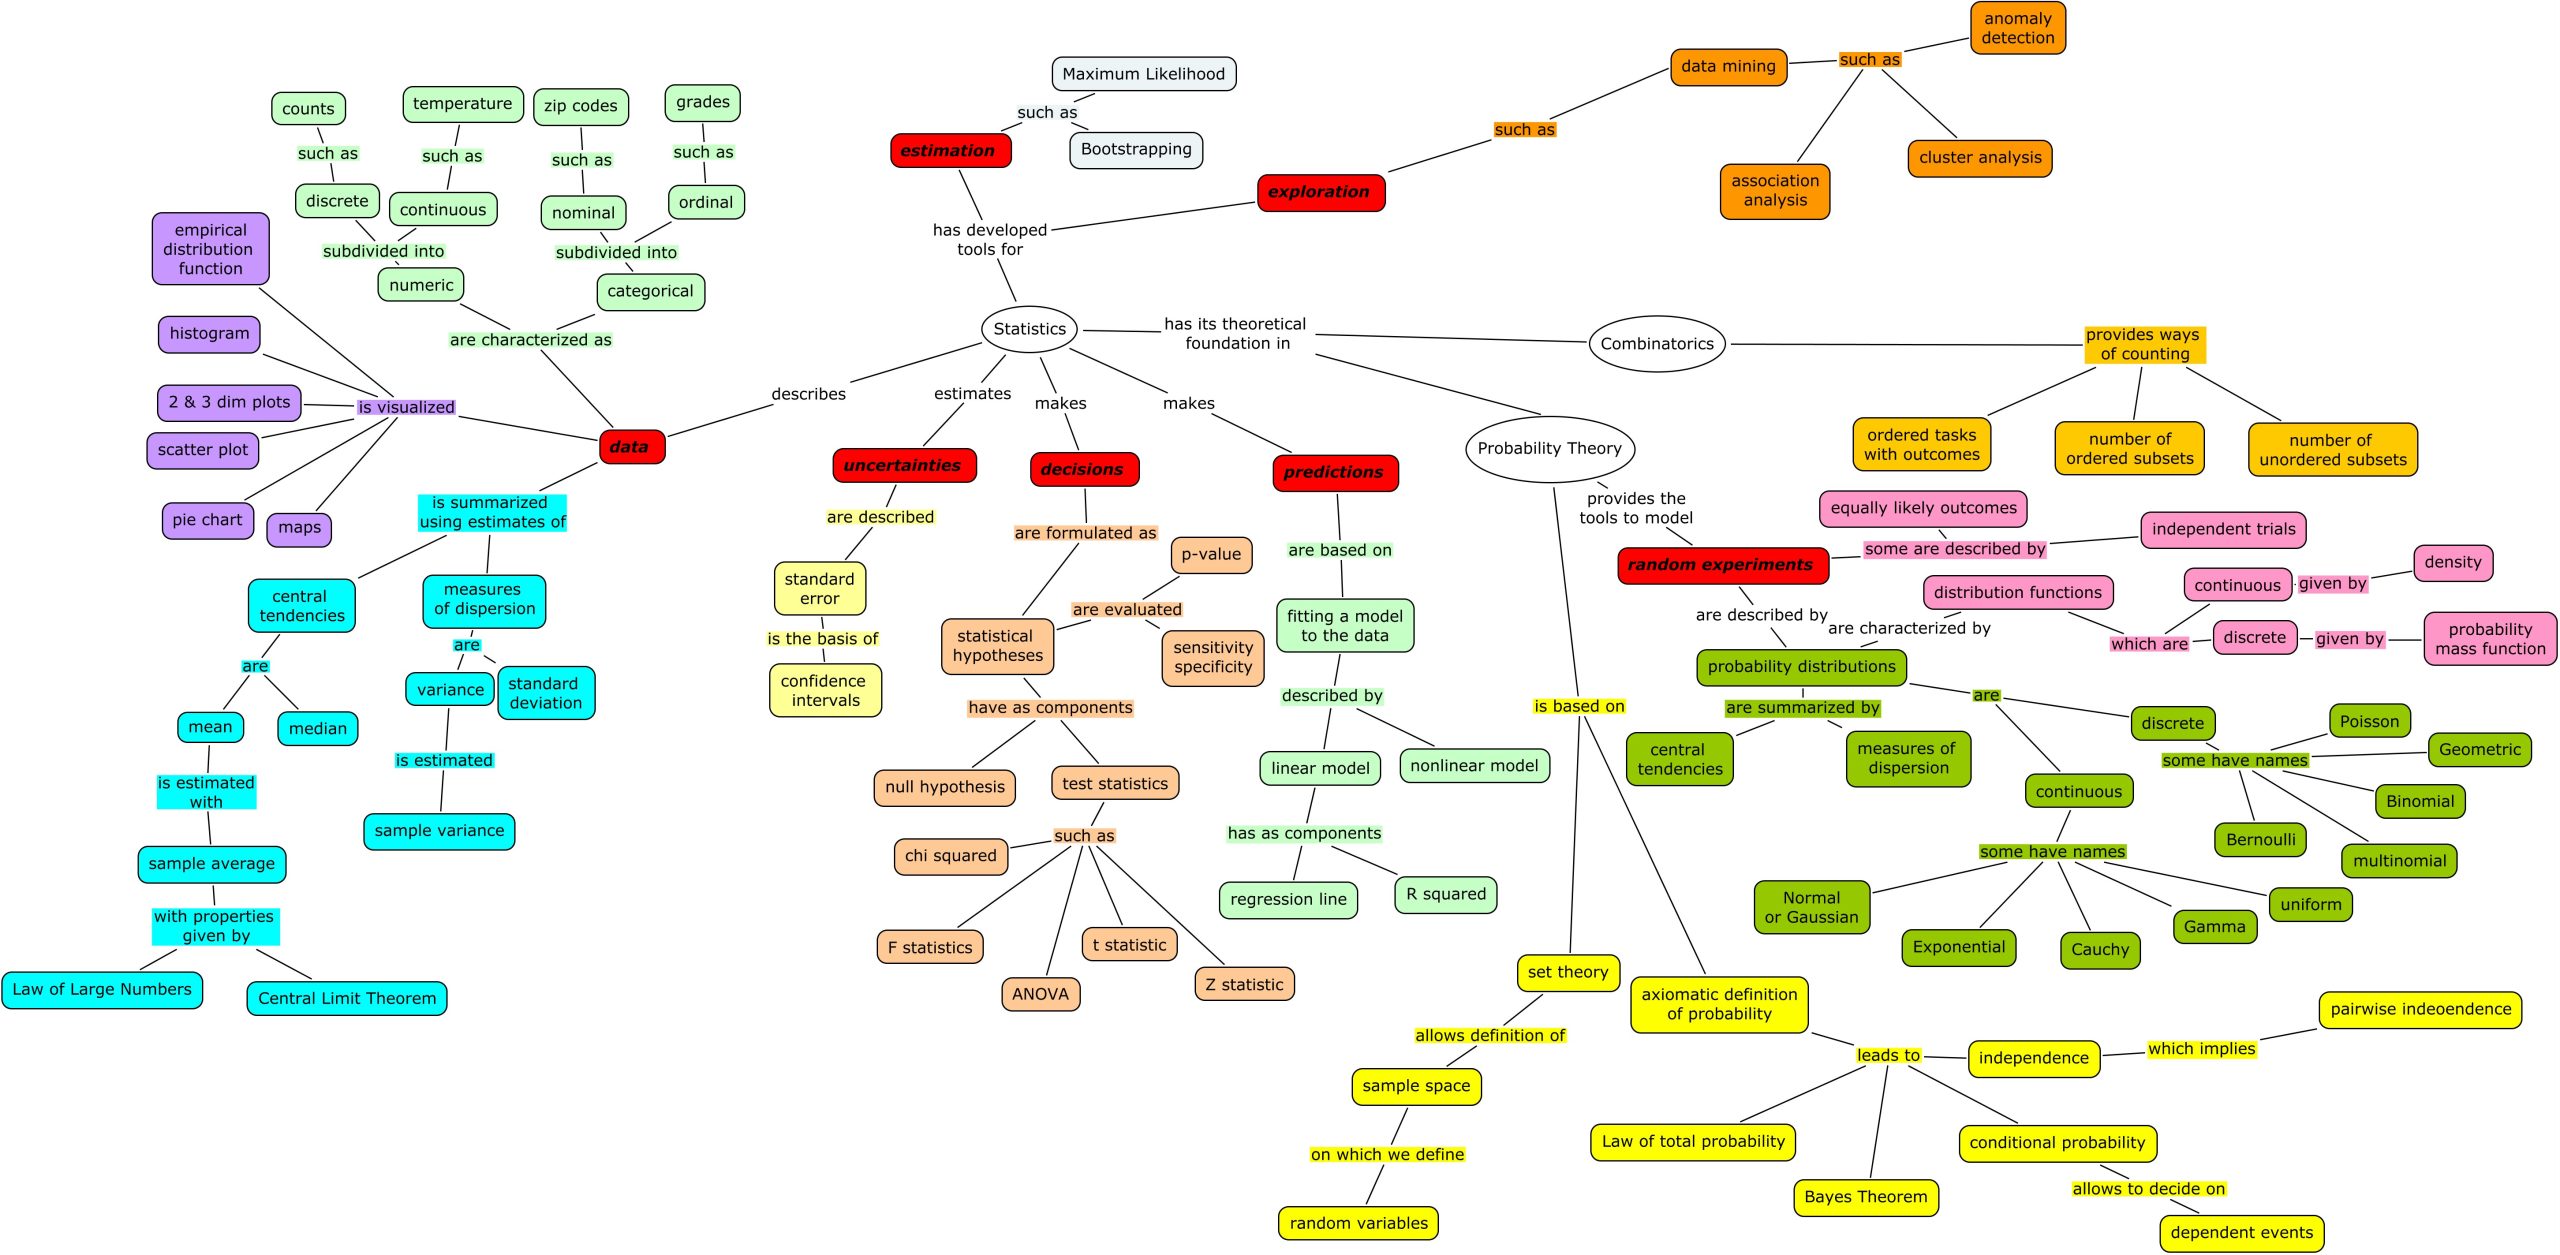
Sources
Statistics Overview Diagram: Neuhauser, C. (2019). Statistics Overview. Numb3r5 Count!, QUBES Educational Resources. doi:10.25334/XTE7-QC92

Feedback/Errata