
1.2 Statistical Thinking and Key Terms
What is Statistics?
The science of statistics deals with the collection, presentation, analysis, and interpretation of data. We see and use data in our everyday life. Some of you have encountered data and wondered what can be concluded. All of us have come across statistics in the media, especially when someone wants to inform us, sell us something, or get us to vote a certain way! A weather report might specify the average annual rainfall. A news story about voting preferences likely offers a statement of the margin of error. If you have ever wondered what these ideas really mean, then you are in the right class! Because experiments, opinions, and reactions vary, statistics has to deal with uncertainty and variability.
Example 1: Statistical Thinking
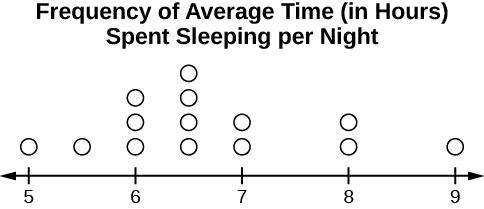
Students in a classroom listed the average time (in hours, to the nearest half-hour) they sleep per night. The sleep time data as well as a simple graph (called a dot plot) of the data has been created. A dot plot consists of a number line and dots (or points) positioned above the number line.
Sleep Data: 5; 5.5; 6; 6; 6; 6.5; 6.5; 6.5; 6.5; 7; 7; 8; 8; 9
Take a look at the data and the dot plot as you think about the following questions:
- How many students were in the class? What does one dot represent? What measurement units are associated with each dot?
- If you did the same data collection in a class of 8-year-old children, with the same number of students, do you think the results would be the same? Why or why not?
- Where do your data appear to cluster? How might you interpret the clustering? Is there much variation in the results and what does that mean? Are there any data values that are unusually large or small?
Questions like these focus your attention on different aspects of the data. The questions asked direct how you analyze and interpret your data. With this example, you have begun your study of statistics!
In this course, you will learn how to organize and summarize data. Organizing and summarizing data is called descriptive statistics. Two ways to summarize data are by graphing and by using number summaries (for example, finding an average). After you have studied probability and probability distributions, you will use formal methods for drawing conclusions from data. The formal methods are called inferential statistics. Statistical inference uses probability to determine how confident we can be that our conclusions are correct.
Effective interpretation of data and inference is based on good procedures for producing data and thoughtful examination of the data. The goal of statistics is not to perform numerous calculations using formulas, but to gain an understanding of your data through a thoughtful use of numeric summaries and graphical displays. The calculations can be done using a calculator or a computer. The conceptual understanding, however, must come from you. If you can thoroughly grasp the basics of statistics, you can be more confident in the decisions you make in life, as a consumer, as a voter, and as an employee.
What is Probability?
Probability is a mathematical tool used to study randomness. It deals with the chance (the likelihood) of an event occurring in the future. When expressed numerically, probability is a number between 0 and 1 (including 0 and 1), that gives the likelihood that a specific event will occur in the future. An event with a probability of 0 will not happen but an event with a probability of 1 will happen for sure. What about probabilities somewhere between 0 and 1?
Suppose you toss a fair coin four times, the outcome may not be exactly two heads and two tails. We cannot say for sure what the outcome will be. However, if you toss the same coin 4000 times, and look at the collective result, the outcomes will be close to half heads and half tails. The expected theoretical probability of heads in any one toss is  or 0.5. Even though the outcomes of a few repetitions are uncertain, there is a regular pattern of outcomes when there are many repetitions. There is a dependability of probability in the long run. After reading about the English statistician Karl Pearson, who tossed a coin 24,000 times with a result of 12,012 heads, one of the authors of this book tossed a coin 2000 times. The results were 996 heads! The fraction
  is equal to 0.498 which is very close to 0.5, the expected probability.
The theory of probability began with the study of games of chance such as poker. Predictions take the form of probabilities. To predict the likelihood of an earthquake this year, rain this week, or the result of a roll of a six-sided die, we use probabilities. Sometimes we base probability on experimentation and observed events. This is called empirical probability. Doctors use probability to determine the chance of a vaccination causing the disease that the vaccination is supposed to prevent. A stockbroker uses probability to determine the likely rate of return on a client’s investments. You might use probability to decide to buy a raffle ticket, or not. In your study of statistics, you will use the power of mathematics through probability calculations to analyze and interpret your data.
Key Statistical Terms
In statistics, we generally want to study a population. You can think of a population as a collection of persons, things, or objects under study. To study the population, we select a sample, which is a subset of the population. The idea of sampling is to select a portion (or subset) of the larger population and study that portion (the sample) to gain information about the population. Data are the result of sampling from a population. Data is a set of observations gained from the sample.
Because it takes a lot of time and money to examine an entire population, sampling is a very practical technique. If you wished to compute the overall grade point average at your school, it would make sense to select a sample of students who attend the school. The data collected from the sample would be the students’ grade point averages. In presidential elections, opinion poll samples of 1000 to 2000 people are taken. The opinion poll is supposed to represent the views of the people in the entire country. Manufacturers of canned carbonated drinks take samples from a production run to determine if a 16 ounce can contains 16 ounces of carbonated drink.
From the sample data, we can calculate a statistic. A statistic is a number that represents a property of the sample. For example, if we consider the students in our statistics class to be a sample of the population of all students at our school, then the average number hours our class spends working at a paid job is an example of a statistic. While a statistic is a property of a sample, a parameter is a numeric property of a population. The statistic is an estimate of a population parameter. Since we considered all the students at our school to be the population, then the average number of hours working at a paid job for all the students at our school is an example of a parameter.
One of the main concerns in the field of statistics is how accurately a statistic estimates a parameter. The accuracy really depends on how well the sample represents the population. The sample must contain the characteristics of the population in order to be a representative sample. We are interested in both the sample statistic and the population parameter in inferential statistics. In a later chapter, we will use the sample statistic to test the validity of the established population parameter.
A variable, notated by capital letters such as X and Y, is a characteristic of interest for each person or thing in a population. Variables may be numerical or categorical. Numerical variables take on values that are counted, such as the number of accidents in a week, or with measurement units, such as weight in pounds or time in hours. Categorical variables place the person or thing into a category. If we let X represent the number of defective bolts in a production run, then X is a numerical variable. If we let Y represent a person’s political party affiliation, then some examples of Y include Republican, Democrat, and Independent. Y is a categorical variable.
Data are the actual values of the variable. They may be numbers or they may be words. Datum is a single value.
Two words that come up often daily life, but which have specific meanings in statistics, are “average” and “proportion.” We will go into more detail in later chapters, but for now, when someone uses the term “average” they likely are talking about the mean. For example, if you were to take three exams in your math classes and obtain scores of 86, 75, and 92, you would calculate your mean score by adding the three exam scores and dividing by three (your mean score would be 84.3 to one decimal place). If, in your math class, there are 40 students and 12 are left-handed and 28 are right-handed, then the proportion of left-handed students is  or 0.3 and the proportion of right-handed students is
  or 0.7.
Note: The words “mean” and “average“ are often used interchangeably in everyday language. The substitution of one word for the other is common practice. When we talk about the mean, or the average, we are describing the general location of the center of the data. The technical term we use to describe the result we get when we add up the data values and divide by the number of data values is “arithmetic mean.” There are other concepts that can get mixed up with the idea of “average”, such as median and mode, so it is important to make sure you understand what “average” is intended.
Example 2: Using Statistics Vocabulary
For each example, identify each of the following: (a) Population, (b) Sample, (c) Parameter, and (d) Statistic.
- An insurance company would like to determine the proportion of all medical doctors who have been involved in one or more malpractice lawsuits. The company selects 500 doctors at random from a professional directory and determines that 130 doctors, or 26%, of doctors in the sample have been involved in one or more malpractice lawsuits.
-
A study was conducted at a local college to analyze the average annual salaries of students who graduated last year. The Alumni Association contacted 840 graduates and noted their average annual salary was $48,500.
Answers:
- (a) all medical doctors, (b) 500 doctors randomly selected, (c) proportion of all doctors who have been involved in one or more malpractice lawsuits, (d) 0.26 or 26% of doctors in the sample
- (a) all students who graduated from the college last year, (b) 840 graduates from last year, (c) average annual salary of all students who graduated from the college in the last year, (d) $48,500 average annual salary of those in the sample
Videos
Sources
The Data and Story Library, http://lib.stat.cmu.edu/DASL/Stories/CrashTestDummies.html (accessed May 1, 2013).
A graphical display with a scaled number line and dots used to mark the location of each data value. It is often used to visualize the distribution of a data set.
organizing and summarizing data
Formal methods for drawing conclusions from data. The word "infer" refers to drawing general conclusions from specific facts.
A number between 0 and 1, inclusive, that gives the likelihood that a specific event will occur in the future.
All individuals, objects, or measurements whose properties are being studied.
A subset of a population.
A set of observations gained from a sample.
A numerical characteristic of the sample.
A number that is used to represent a population characteristic and that generally cannot be determined easily.
A subset of the population that has the same characteristics as the population.
A type of variable that takes on values that are numbers. These numbers can be counted or measured.
A type of variable that take on values that are names or labels.
The singular form of data and a piece of information.
A number that describes the central tendency of a set of data. It is calculated by adding up all of the data values and dividing by the total number of data values. Also called the mean.

Feedback/Errata