
11.4 One-Way ANOVA Examples
In this section, we present three examples of the one-way analysis of variance process. You are encouraged to input the data into a statistical program and recreate the statistics and hypothesis tests.
Example 1 -Diet and Weight in Pigs
Twenty young pigs are assigned at random among 4 experimental groups. Each group is fed a different diet. (This design is a completely randomized design.) The data collected are the pig’s weight, in kilograms, after being raised on these diets for 10 months. Experimenters wish to determine whether the mean pig weights differ for the 4 diets. Conduct an analysis of variance and determine whether you can conclude the mean weights differ. Check the assumptions needed to run an ANOVA.
| Feed 1 | Feed 2 | Feed 3 | Feed 4 |
| 60.8 | 68.3 | 102.6 | 87.9 |
| 57.1 | 67.7 | 102.2 | 84.7 |
| 65.0 | 74.0 | 100.5 | 83.2 |
| 58.7 | 66.3 | 97.5 | 85.8 |
| 61.8 | 69.9 | 98.9 | 90.3 |
Solution:
There are  = 4 treatment levels. Each sample contains
  = 5 pig weights. The alternate hypothesis is that there is a difference in the means among the four treatments, so the null hypothesis is that the mean pig weights are the same.

 There is a difference in the means.
Using a statistical package, we found the summary statistics for each treatment. See Table 2.
| Variable | N | Mean | Standard Deviation | Minimum | Maximum |
| Feed 1 | 5 | 60.68 | 3.03 | 57.10 | 65.00 |
| Feed 2 | 5 | 69.24 | 2.96 | 66.30 | 74.00 |
| Feed 3 | 5 | 100.34 | 2.16 | 97.50 | 102.60 |
| Feed 4 | 5 | 86.38 | 2.78 | 83.20 | 90.30 |
Check Assumptions:
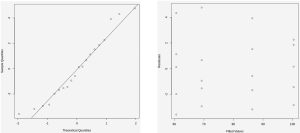
The methods of ANOVA require that we assume the observations on each treatment are a sample from a normal population and that each normal population has the same variance. These assumptions must be satisfied before we move forward. We do not know whether the weights come from a normal distribution, so we should take a look at normally probability plots. If the sample sizes for each treatment were large enough, we could analyze normal probability plots for each data set, but with such small sample sizes, we will analyze all the data in one normal probability plot. See Figure 1, the normal probability plot, to see that there is no evidence of any serious violation of the assumption of normality. The residuals display a mean of zero and fall approximately along a straight line.
Checking standard deviations can be more challenging, especially with such small sample sizes. There can appear to be larger differences in the standard deviations between samples even with the population variances are the same. We can consider the values of the standard deviations from Table 2 as well as the residual plot in Figure 2. The standard deviations are reasonably similar, and the spread of the residuals are not very different, so we will assume the equality of variances assumption is satisfied.
We have satisfied the requirements to run an analysis of variance, so a computer software package can produce the results in Table 3.
ANOVA Test Results
| Source | DF | Sum of Squares | Mean Square | F Value | P-Value |
| Treatment | 3 | 4703.19 | 1567.73 | 206.722 | 5.28 e^-13 |
| Residual | 16 | 121.34 | 7.58375 |
The F-test statistics of 206.722 is significant at the 5% level and the p-value is approximately zero, so we reject the null hypothesis. The data provide sufficient evidence to conclude that the mean weights of pigs from the four feeds are not the same. Since the null hypothesis was rejected, and we conclude at least one mean weight differs for a treatment, we might wonder which diet resulted in a different mean weight? Statistical packages will give a multiple comparison output to gain insight into this question. See Figure 3.
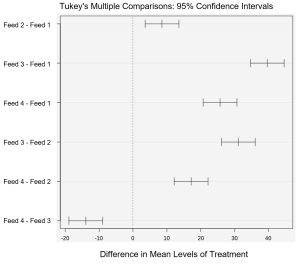
If a confidence interval does not contain zero, then there is support for the conclusion that the means differ. By comparing each treatment level to each other treatment level via 95% confidence intervals, we see that none of the six confidence intervals contain zero. Therefore, we conclude there is a statistical difference in all four group mean weights. The four diet types resulted in significantly different mean pig weights.
Example 2 – Tea Leaf Pluckings
The following data represent quantities of tea leaf pluckings (tender shoots from tea plants) from sixteen different plots of tea bushes intended for experimental use in Ceylon, a type of tea from Sri Lanka. The tea bushes are randomly divided into four different treatment groups. Each treatment group contains four tea bushes. The number of tea leaf pluckings for each tea bush is given below in Table 1.
| Treatment 1 Pluckings |
Treatment 2 Pluckings |
Treatment 3 Pluckings |
Treatment 4 Pluckings |
| 88 | 102 | 91 | 88 |
| 94 | 110 | 109 | 118 |
| 109 | 105 | 115 | 94 |
| 88 | 102 | 91 | 96 |
Experimenters wish to determine if the mean number of pluckings differs among the four treatments. Test this question at the 5% significance level. Assume that these samples are drawn from normal populations with equal variances.
Solution:
There are = 4 treatment levels. Each sample contains = 4 bushes. The alternate hypothesis is that there is a difference in the means among the four treatments, so the null hypothesis is that the mean pluckings are the same.
There is a difference in the means.
| Source | DF | Sum of Squares | Mean Square | F Value | P-Value |
| Treatment | 3 | 213.5 | 71.1667 | 0.650667 | 0.597576 |
| Residual | 12 | 1312.5 | 109.375 |
The F-test statistics of 0.650667 is not significant at the 5% level and the p-value is approximately 0.60, so we fail to reject the null hypothesis. There is not enough evidence to conclude that the tea tree pluckings differ. The data do not support the claim that at least one of treatments has a mean number of pluckings that differs from the other treatments’ means.
Example 3 – Potato Yields
In the book, Statistical Methods for Research Workers, statistics pioneer Ronald Fisher provides the following example. In an experiment on improving potato yields, 5 varieties of potato plants were used. For each variety, 9 plants were randomly selected. Over time, the plants yielded potatoes, and the total yield in pounds was recorded for each plant. The yield, in pounds, for each plant is given below in Table 6.
| Ajax | Arran Comrade | Great Scot | Iron Duke | Kerr’s Pink |
| 3.20 | 2.25 | 3.38 | 3.43 | 3.04 |
| 4.00 | 2.56 | 3.07 | 3.00 | 3.57 |
| 3.86 | 2.58 | 3.89 | 3.96 | 3.82 |
| 2.55 | 1.96 | 2.79 | 3.33 | 2.96 |
| 3.04 | 2.15 | 3.54 | 3.08 | 3.18 |
| 4.13 | 2.10 | 4.14 | 3.32 | 4.32 |
| 2.82 | 2.42 | 3.07 | 3.50 | 2.00 |
| 1.15 | 2.17 | 3.15 | 2.32 | 3.00 |
| 4.71 | 2.17 | 3.50 | 3.29 | 3.88 |
Test the claim at 1% significance that the mean yield is the same for each variety of plant. Assume that these samples are drawn from normal populations with equal variances.
Solution:
There are = 5 treatment levels. Each sample contains = 9 yields in pounds. The alternate hypothesis is that there is a difference in the means among the five treatments, so the null hypothesis is that the mean yields are the same.
There is a difference in the means.
| Source | DF | Sum of Squares | Mean Square | F Value | P-Value |
| Treatment | 4 | 7.94038 | 1.98509 | 4.94296 | 0.00247 |
| Residual | 40 | 16.064 | 0.401601 |
The F-test statistics of 4.94296 is significant at the 1% level and the p-value is approximately 0.00247, so we reject the null hypothesis. There is enough evidence to conclude that at least one potato yield is different from the mean of the other varieties. If we consider the sample means, we see Arran Comrade has a mean yield which is significantly smaller than the sample means of the other varieties.
| Variety | Sample Mean |
| Ajax | 3.27 |
| Arran Comrade | 2.26 |
| Great Scot | 3.39 |
| Iron Duke | 3.25 |
| Kerr’s Pink | 3.31 |
Sources
Example 1 data was taken from STAT 500 https://online.stat.psu.edu/stat500/ licensed under CC BY-NC 4.0. Graphs were produced by Rguroo.
Example 2 and Example 3 data was taken from Statway College Module 5 by Carnegie Math Pathways is licensed under CC BY-NC 4.0.

Feedback/Errata