
9 Characterizing Material Properties
Characterizing Material Properties
This lab is designed to align with AAOT science outcome #1: Gather, comprehend, and communicate scientific and technical information in order to explore ideas, models, and solutions and generate further questions.
Materials
- digital device with spreadsheet program
- digital device with internet access
ObjectiveS
- Identify regions and features of the stress vs. strain curve.
- Analyze the features of the stress vs. strain curve to assess qualitative material properties.
- Analyze stress vs. strain data to determine ultimate strength and elastic modulus.
- Analyze stress vs. strain data to determine the elastic potential energy storage capacity of a material.
- Compare and contrast stress vs. strain curves and material properties in the context of real-world applications.
QUalitative Characterization of Stress vs. strain behavior
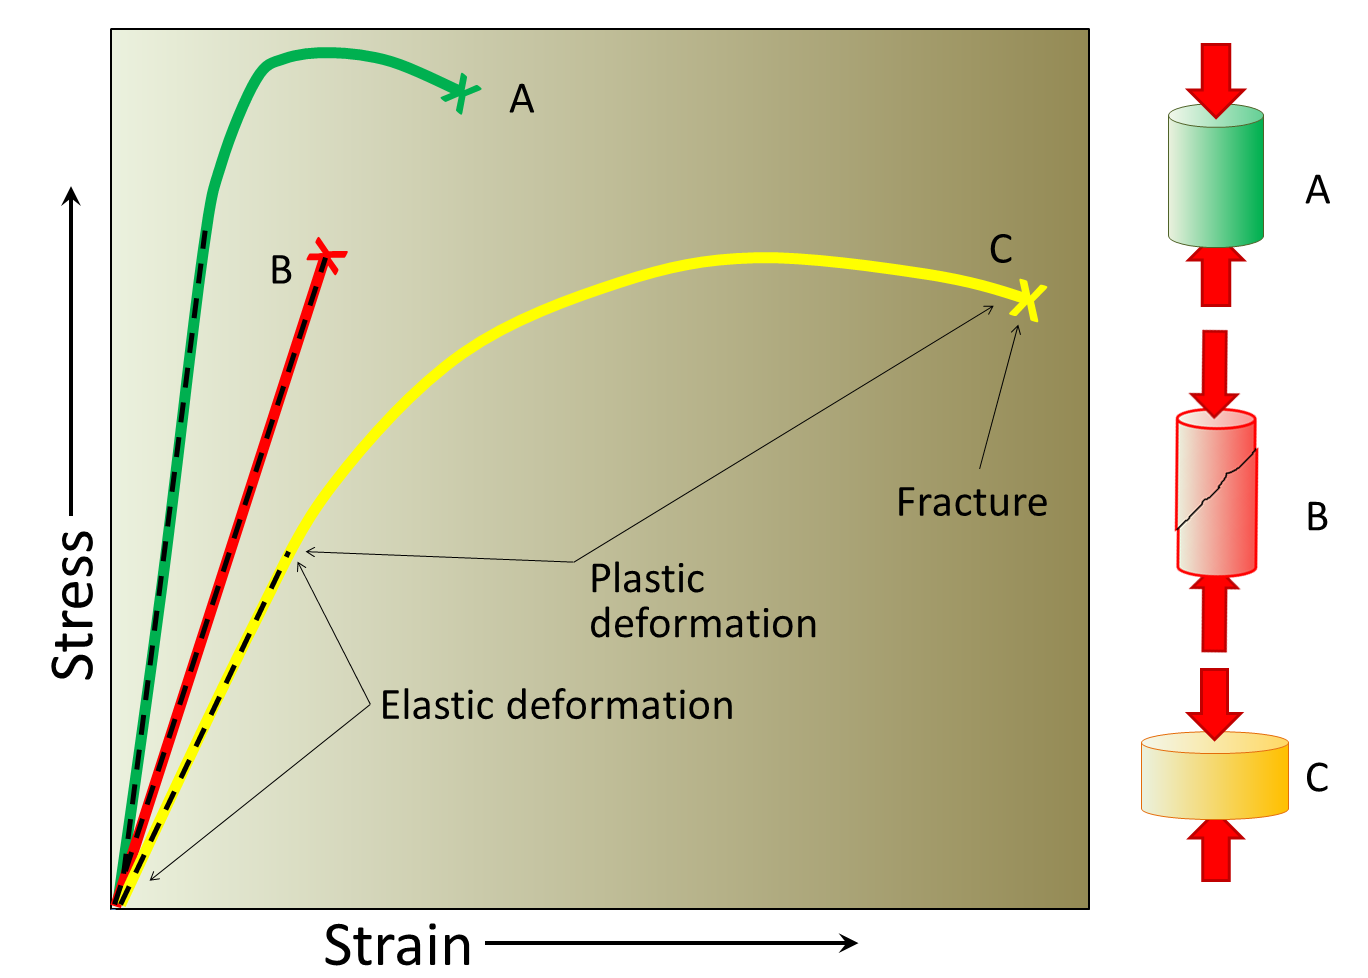
Materials can be categorized as brittle or ductile based on the relative size of their linear and failure regions. A brittle material will fracture or rupture very shortly after reaching the yield point, the point at which the material begins to permanently deform. A ductile material will have a relatively long failure region, corresponding to permanent deformation without fracture or rupture.
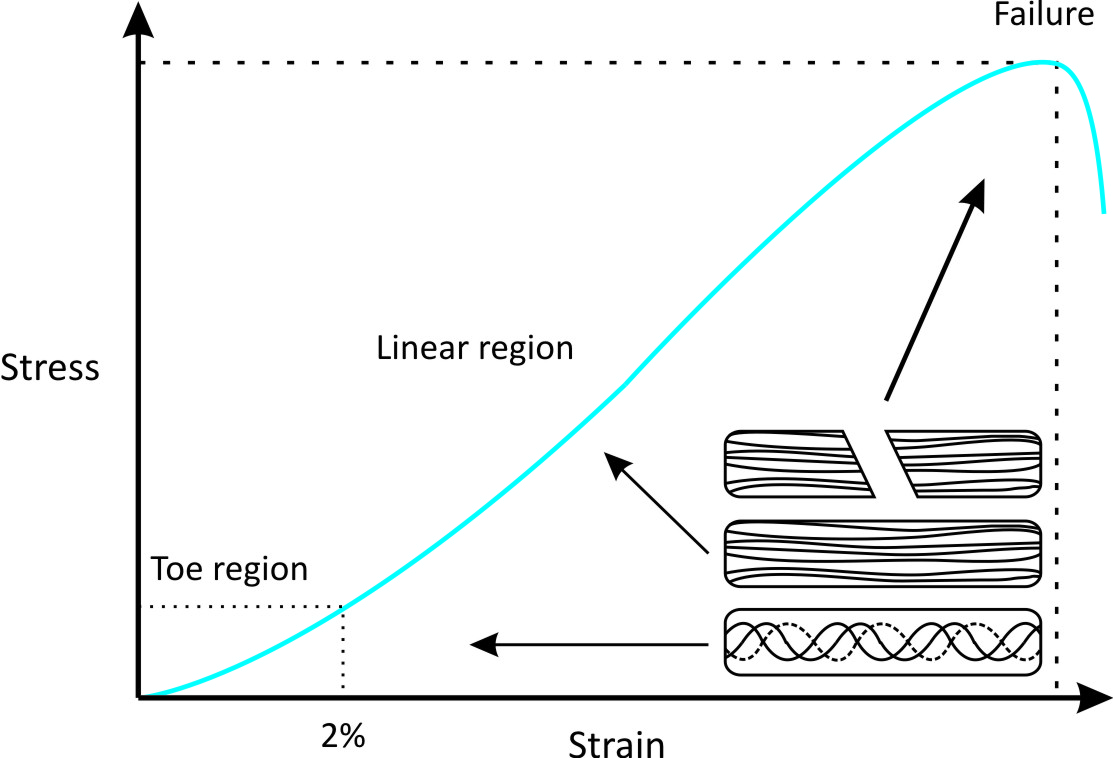
Some materials stretch easily up to a certain point, but then become very stiff and difficult to stretch. This behavior causes a toe region in their stress vs. strain curves. For example, the stress vs. strain curves of tendons exhibit a toe region do to crimping behavior.
1) We will measure a stress vs. strain curve for a common hair tie to determine if the material comprising the hair tie exhibits a toe region and categorize the material as brittle or ductile. Based on your experience, do you expect that the hair tie will exhibit a toe region? Explain your reasoning.
2) Do you expect that the hair tie material will be brittle or ductile? Explain your reasoning.
Experimental Methods
Data Collection
We will measure a stress-strain curve for a common hair tie using a strength and materials tester as seen in the following video. The data collected in the video is available in an online spreadsheet. You can copy and paste the data into your own spreadsheet for analysis.
Data Analysis
Stress and Strain
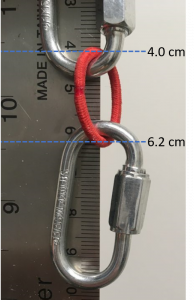
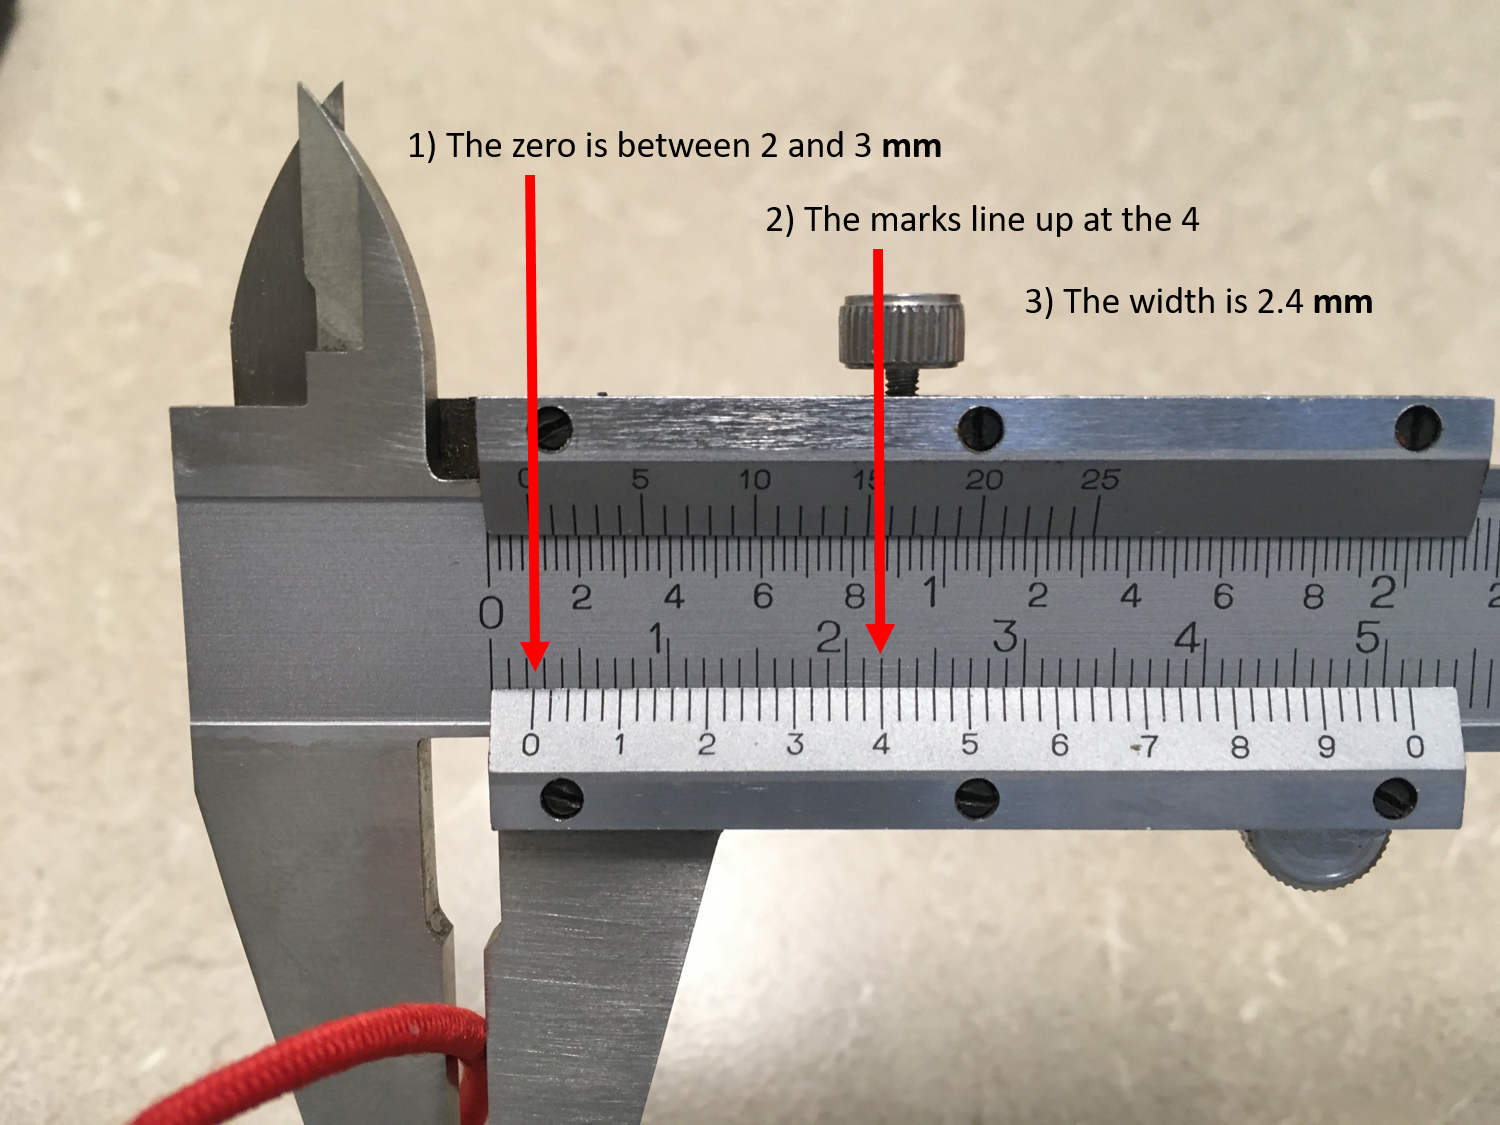
To calculate stress we will need to know the cross-sectional area of the rubber band. We will assume the band does not thin out as it stretches so we will use the original cross section to calculate the stress throughout the experiment. The result of this approximation is known as the engineering stress. If we were to instead measure and use the changing cross-section throughout the experiment we would be calculating the true stress. The original diameter of the hair tie was measured to be 2.4 mm using calipers (see image below).
3) Calculate the cross-sectional area of the hair tie in units of m2. The hair-tie was looped around the quick-links in the materials tester, so we were actually stretching two strands of the hair tie and you need to double your cross-sectional area value to account for that. Show your work.
4) Use your spreadsheet and known original length calculate the strain corresponding to each displacement value.
5) Use your spreadsheet and the cross-section you calculate to calculate the stress corresponding to each force value.
6) Plot the stress on the vertical axis and strain on the horizontal axis. Be sure to title your graph and enter axes labels with correct units.
Elastic Modulus (Young’s Modulus)
7) The elastic modulus of the material is defined as the __________ of the graph in the __________ region of the stress vs. strain curve. (Reading your textbook will remind you of how to fill in the blanks).
8) Create a second plot that only contains the data from the region you answered above. Fit a line to this data and record the fit equation and the R2 here:
9) What is the elastic modulus of the hair-tie material?
10) What is the elastic modulus in units of MPa and also in units of GPa?
Ultimate Strength
11) Use your graph or examine your data to find the ultimate strength of the hair tie material. Record the value in units of MPa and also in units of GPa.
Conclusions
10) Does the hair tie stress vs. strain curve contain a toe region, and if so, what range of strain values does it cover? Explain how you decided on the range. [Hint: Compare the stress strain curve with those shown and described in the Qualitative Characterization Methods section at the beginning of the lab.]
11) Is the hair tie material brittle or ductile? Explain your reasoning. [Hint: Compare the stress strain curve with those shown and described in the Qualitative Characterization Methods section at the beginning of the lab.]
12) Is the qualitative stress vs. strain behavior of a hair tie similar to that of a tendon? Explain. [Hint: Do the stress vs. strain curves have all of the same regions? Are the both brittle, both ductile, or is one brittle and one ductile?] Cite any sources that you used to learn about the behavior of tendons.
13) How does the elastic modulus of the hair tie compare to the elastic modulus of a tendon? Provide a ratio of the two values. Also properly cite your source for the tendon value.
14) How does the ultimate strength of the hair tie compare to the ultimate strength of a tendon? Provide a ratio of the two values. Also properly cite your source for the tendon value.
15) Overall, do hair-ties makes good models for tendons? Explain.
Further Questions
16) The toe region in tendons is created by uncrimping of the fibers before the fibers actually stretch. This uncrimping provides joint flexibility by allowing tendon the tendon to easily stretch a short distance under small stress (the slope of the toe region is very shallow). If the tendons remained easy to stretch for long distances then joints would be floppy and muscle contractions would just stretch the tendons instead of move our body parts. Instead, once the tendon fibers are uncrimped the fibers themselves begin to stretch and the tendon becomes very stiff (linear region with steep slope corresponding to the elastic modulus of the tendon material). Explain why hair ties are designed to have a toe region and compare the reasons for a toe region in tendons and hair ties. Cite all sources.
You may have noticed in the video that the outer sheathing around the hair tie appeared to tear while the hair tie was still in the toe region. The stress strain curve continued on the same trend, which means that the sheathing was not providing significant resistance stretching compared to the material inside the hair tie.
17) What do you think is the purpose of the sheathing? Explain your reasoning and cite any and all sources used. [Hint: Do tendons also have a sheathing? If so, what is the purpose of the sheathing?]
The work done on the hair tie before it breaks is equal to the area under the measured force vs. displacement curve. We can approximate the force vs. displacement area by multiplying each little bit of additional displacement by the average force recorded during that additional displacement and then adding up all of these results. This process, known as numeric integration, essentially breaks the curve into many small rectangles, finds the area of each little rectangle, and adds up all the little areas.
18) Let’s try this with our hair tie. Use your spreadsheet to average the first two force values in the second cell of the new column. Subtract the first displacement from the second in order to find the displacement over which that average force was applied. Continue this pattern for all the force and displacement values until fracture occurred. Make a third column that converts the additional displacement to meters and multiplies by the average force. This will be the work in Joules. The following chart shows an example of what you are trying to create, with made up example values for displacement and force.
| Displacement (cm) | Force (N) | Average Force (N) | Additional Displacement (cm) | Work (J) |
| 0 | 0 | |||
| 0.2 | 1 | 0.5 | 0.2 | 0.001 |
| 0.3 | 2 | 1.5 | .1 | .0015 |
| 0.5 | 4 | 3 | 0.2 | 0.0006 |
19) Use your spreadsheet to sum up each little work done to get the total work before rupture. Record here:
20) If you attached a hook to the hair tie and used it to catch a moving object with mass of 0.5kg, how fast could the object be moving without breaking the hair tie? [Hint: To stop the object the hair tie must do an amount of work that is equal to the object’s kinetic energy.]
21) From how high would you drop an object in order for it to reach the speed you calculated above?
In similar fashion, there are limits on how much energy can be transferred to your tendons when pushing off to change direction or landing after a fall.
