
16 Modeling Maximum Voltage and Charge on a Van de Graff Generator
modeling Maximum Voltage and Charge on a Van de Graff Generator
This lab is designed to align with AAOT science outcome #1: Gather, comprehend, and communicate scientific and technical information in order to explore ideas, models, and solutions and generate further questions.
Materials
- digital device with spreadsheet program
- digital device with internet access
ObjectiveS
- Understand the mechanisms behind carona discharge and arc discharge.
- Apply Gauss’s Law to estimate the maximum electric field, voltage, and charge at the surface of a particular Van de Graff Generator dome.
- Become familiar with Paschen’s Law and how the parameters relate to the mechanisms behind arc discharge.
- Employ a graphing calculator to evaluate the role of the secondary electron coefficient in Paschen’s Law for very large gaps
- Apply Paschen’s Law to experimental spark-gap data to determine the maximum voltage on a Van de Graff Generator
Methods
Experimental Methods
In this lab you will determine the maximum charge and voltage on a Van de Graaff Generator. The first video below shows a Van de Graaff Generator in use and the second video illustrates how the generator works.
Modeling Methods
The build up of charge on the Van de Graaff dome is limited by carona discharge. The following video discusses carona discharge and arc discharge.
Carona Discharge Model
As seen in the video above, carona discharge will occur when molecules in the air become ionized. Carona discharge does not require that a plasma arc is formed between two electrodes so the part of the experiment involving arc distance is not relevant to the carona discharge model. The electric field required to ionize a particular substance is known as the dielectric strength. The dielectric strength of air is  [1] so we know that the maximum charge that can occur on the Van de Graaff is that amount which produces an electric field of .
We will model the Van de Graaff Generator dome as a spherical conducting shell and then find the charge on the shell that would be needed to produce an electric field of . The following video shows how to use Guass’s Law to find the electric field on the outside of a charged metal shell. We will use the same equations, but solve for the charge. Watching roughly the first 5:20 of the video will help prepare you for this part of the lab (after that they enter specific values from their problem that are not relevant to us).
1) What is the electric field within the cavity of a charged spherical metal shell?
2) What is the electric field within the metal shell itself?
3) Applying Guass’s Law to the charged spherical shell shows us that on the surface of the shell and beyond we can compute the electric field with what the formula for the electric field of what type of charge? Write that formula below, using the following symbols:  for the charg,
  for Coulomb’s constant, and
  for the distance from the center of the sphere. Show your work.
4) According to the answers above, where will the electric field be the largest? Explain.
5) Rearrange the formula for the electric field outside of the charged sphere to solve for the charge, . Show your work.
6) Enter the dielectric strength of air for the electric field and the answer to (4) for the radius and calculate a value for the maximum charge that can build up before carona discharge. Show your work.
7) We know that outside the sphere the electric field behaves exactly as though the sphere were actually point charge. Therefore, we know that the electric potential (voltage relative to zero) at the surface of the sphere must be the same as if the sphere were a point charge. Enter the maximum charge and the radius of the sphere into the equation for the electric potential due to a point charge to calculate the electrical potential at the surface of the sphere. Show your work.
Note that the electric potential at a point is defined as the electric potential difference, or voltage, between the point and another location where the potential is defined to be zero, such as on a grounded conductor (or at a distance of infinity). Therefore, the maximum electric potential you calculated above is the same thing as the voltage relative to ground.
Arc Discharge Model
As usual, we want to test our theoretical prediction against some experimental results. The maximum distance (gap) at which the Van de Graaff would arc to the grounding rod provides the data we need. The voltage between two electrodes at which the insulating property of the air will break down and allow an arc form between them is known as the breakdown voltage  . Finding the maximum arc gap will allow us to determine the maximum voltage between the dome and the grounding rod.
Let’s remember that the voltage between two electrodes tells us the amount of kinetic energy per charge that a particle would gain while accelerated across the gap by the electric field between them. Not surprisingly, for large gap distances (or higher gas pressure) a greater voltage is required to achieve an arc discharge because many collisions between electrons and other molecules slow the electrons down so that they don’t have as much kinetic energy available to knock off a sufficient number of other electrons with enough kinetic energy of their own to form the cascade of ions necessary for the plasma arc (avalanche breakdown). Surprisingly, higher voltages are also needed for very small gap distances (or low gas pressure) because the electrons may have too few ionizing collisions to initiate an avalanche. The following video nicely illustrates these concepts.
Paschen’s Law accounts for many factors involved in relating breakdown voltage to the gap distance  and is therefore a relatively complicated function[2]:

The complexity of Paschen’s Law suggests that we graph the function in order to better understand the information it contains. To do that, we will use standard atmospheric pressure for the gas pressure ( ). The constants
  and
and  are determined experimentally and commonly quoted values for air under standard conditions are[3]:
 and
and  .
.
The secondary emission coefficient ( ) is the average number of electrons knocked off during each collision. The value for air is not well established and the possible range is quite large depending on the electric field strength and gas pressure. However data suggest that for the an electric field anywhere near what we expect from our carona modeling the will be around
  and likely less. [4]. To start we will assume
  and later we will determine how the value of actually affects on our final answer for the maximum voltage on the Van de Graaff.
8) Use a graphing calculator such as Desmos to plot Paschen’s law with on the vertical axis and gap ( ) on the horizontal axis. Use the values listed above for A, B, and . Set the vertical axis to range from [0 V – 1000 V] and the horizontal axis to range from [0 m – 0.0001 m]. (When using Desmos, click the wrench in the upper right of the plot to set axes).
9) At this point in your lab submission paste an image of your graph with the axes settings above. You can use the share graph feature of Desmos to export an image of your graph or you can just paste a screenshot showing your Desmos window.
10) The plot should show you that a minimum voltage necessary for arc discharge occurs at a certain gap distance, but greater voltage is required for larger gaps and also smaller gaps. However, the maximum arc gap that we found experimentally was 0.5 m, which is many order of magnitude larger that what you currently see in the plot. To view the plots of Paschen’s Law for larger gaps like 0.5 m, set your horizontal axes to the range [0 m – 1 m] and the vertical axis the range of [0 V – 2 million V].
11) At this point in your lab submission paste an image of your graph with the axes settings above. You can use the share graph feature of Desmos to export an image of your graph or you can just paste a screenshot showing your Desmos window.
12) Use your plot to find the predicted breakdown voltage for the 0.5 m gap and record below.
13) Remember that 0.5 m was the maximum gap over which the dome would arc discharge, so the breakdown voltage corresponding to that distance should be the maximum voltage between the Van de Graff and the grounding rod. By definition the grounding rod is at zero potential so this maximum dome voltage is relative to ground (zero potential). Compare this max voltage to the max voltage predicted by the carona discharge model. Are they similar?
Conclusions
14) You may have noticed that the maximum voltage predicted by the two methods was somewhat different (although they were within the same order of magnitude, meaning the greater one was much less than 10x greater). Do some research on the typical voltages achieved by demonstration Van de Graaff Generators like the one in the video to conclude which result is likely to be more accurate. Explain your reasoning and cite your sources.
FURTHER QUESTIONS
There are several reasons to doubt that Paschen’s Law would give very accurate predictions for breakdown voltage in this experimental setup. First, through a brief search was not able to find data that supported Paschen’s Law for very large gap distances such as ours. Most of the data was for gaps in the micrometer range. It is possible that Paschen’s Law is not accurate for very large gap distances. Second, Panchen’s law was developed for electrodes of equal radius, but ours were not. The radius of the grounding rod blub was very much smaller than the radius of the dome. The induced charge in the smaller radius electrode may lead to a very strong electric field that provides ions with a greater acceleration, and thus reduces the required breakdown voltage. You may also be wondering about the influence of . We used a specific value for in the arc discharge model, but we know there is a very high uncertainty associated with that value. Let’s investigate how much that could have affected our results and conclusions.
16) Add 3 more plots using values of that are one order of magnitude larger and two orders of magnitude smaller than the expected upper limit of or less ( ). You should get something like this:
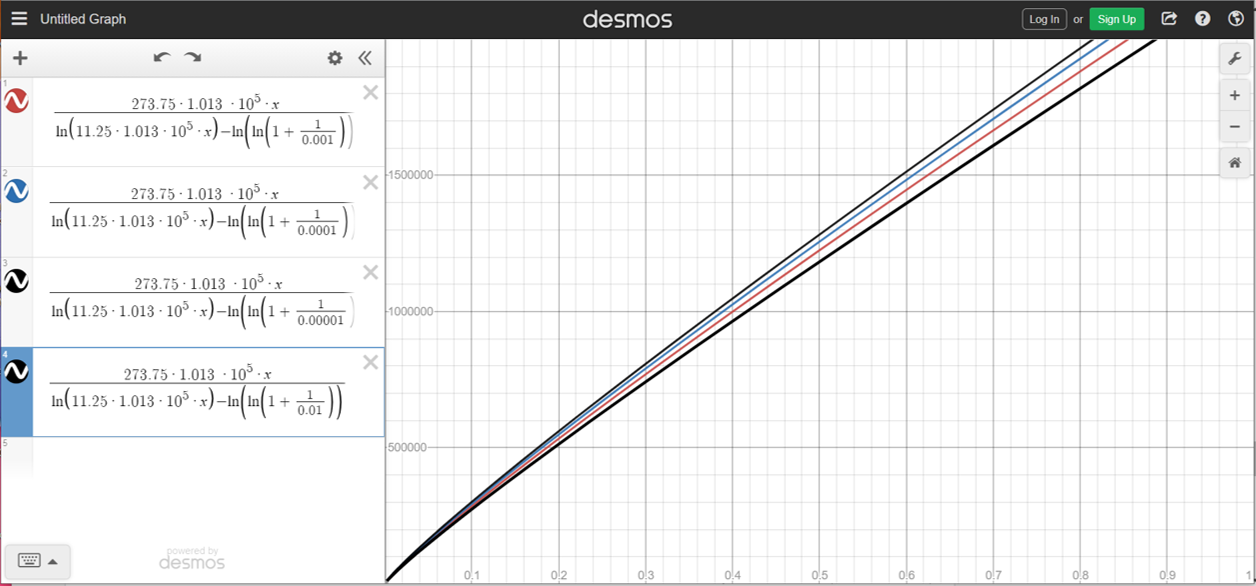
17) Even though we varied by four orders of magnitude the predicted breakdown voltage for a 0.5 m gap saw a relatively small change. Calculate the % difference between the largest and smallest predicted voltages. Show your work.
18) Would you say that being uncertain of the value significantly impacted the results and conclusions of this work? Explain.
19) Reset the vertical axis in your plot to range from [0 V – 1000 V] and the horizontal axis to range from [0 m – 0.001 m]. (When using Desmos, click the wrench in the upper right of the plot to set axes).
20) At this point in your lab submission paste an image of your graph with the axes settings above. You can use the share graph feature of Desmos to export an image of your graph or you can just paste a screenshot showing your Desmos window.
21) If our gap distance had actually been in this this range up to 0.0001 m (100 micrometers) would the uncertainty in have significantly affected our results and conclusions? Explain.
- "OpenStax College Physics" by Paul Peter Urone, Roger Hinrichs, Capacitors and Dielectrics, OpenStax College Physics is licensed under CC BY 4.0 ↵
- , "Experimental verification of modified Paschen’s law in DC glow discharge argon plasma" , AIP Advances 9, 025215 (2019) https://doi.org/10.1063/1.5086246 ↵
- https://en.wikipedia.org/wiki/Paschen%27s_law ↵
- "DC Breakdown in Air, Oxygen, and Nitrogen at Micrometer Separations" by Matej Klas and Stefan Matejcik, Department of Experimental Physics, Comenius University ↵
