
7.5 Violence in Education
Violence is prevalent in schools but collecting and collating data on these incidents is difficult. The National Institute of Justice reports that data is not centralized and is collected by various government and non-governmental offices (Frederique 2020). The report states that “although crime and violence in schools have generally been decreasing for some time, multiple-victim homicide incidents have been increasing”(Frederique 2020).
Gender-based violence in adulthood usually begins with learning about gender-normative behavior as children. All genders can be offenders or victims of violence in schools. In school, male students report being in physical fights almost three times as often as female students (Irwin et al. 2022). Personal violence outside of the classroom directly influences violent tendencies inside the classroom. According to Alder and Worrall (2004):
Violent girls also reported significantly higher levels of fear of being physically abused at home along with significantly greater levels of experiencing physical abuse at home than all boys and nonviolent girls. These girls also reported significantly higher rates of fear of sexual victimization (being talked into sex against their will by a boyfriend and experiencing sexual abuse) along with significantly higher rates of sexual victimization.
There are many forms of violence and crime, including bullying through electronic means. A 2021 report on school crime shows that “16 percent of students in grades 9–12 reported being electronically bullied” (Irwin et al. 2022). 25% of females and 19% of males reported being bullied electronically. For comparison, “the percentage of students who reported being electronically bullied was higher for gay, lesbian, or bisexual students (27 percent) than for students who were not sure about their sexual identity (19 percent), and both percentages were higher than the percentage for heterosexual students (14 percent)” (Irwin et al. 2022).
Violence in education can occur in many settings and for many reasons. In figure 7.10, hate crime incidents at postsecondary institutions are listed by the demographic category which motivated the crime (National Center for Education Statistics, 2022c). Hate crimes are violent crimes that “include crimes committed on the basis of the victim’s perceived or actual race, color, religion, national origin, sexual orientation, gender, gender identity, or disability” (DOJ n.d.).
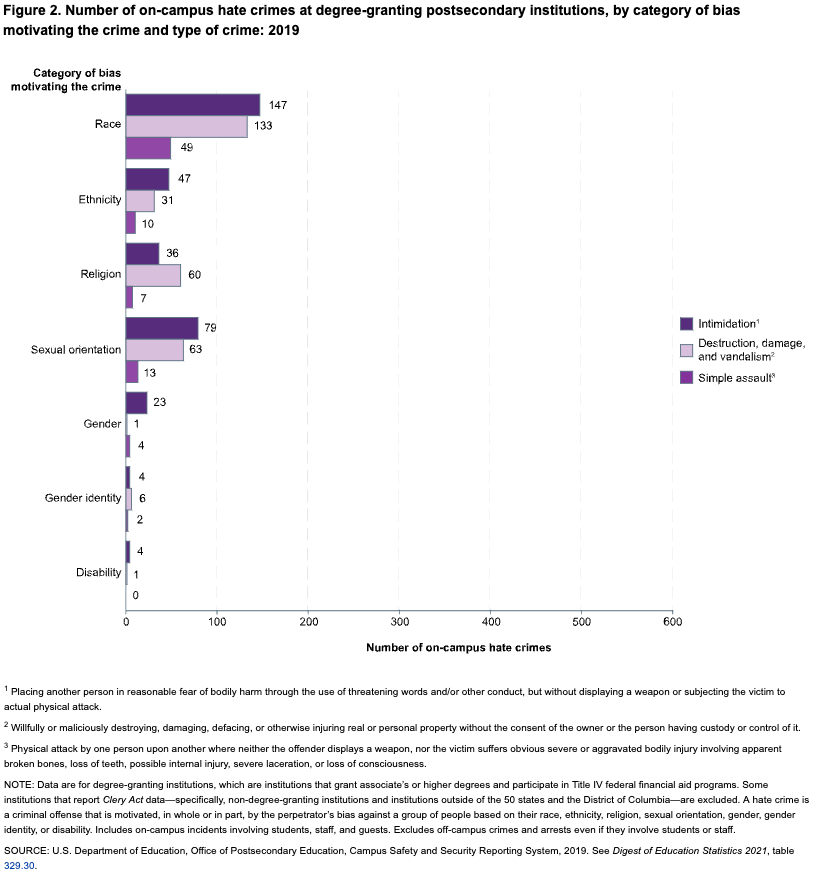
Figure 7.10. [Hate crime incidents can be motivated by various reasons, as shown in this figure.] (National Center for Education Statistics, 2022c)
Across all education levels, data collection of all crimes is difficult due to the victims’ fear of reporting and difficulty connecting with reporting agencies. Universities may not want to report accurate crime statistics to downplay concerns about safety issues on and around their campuses. Universities now must report specific categories of campus violence due to federal regulations requiring information tracking and availability.
In 1986, Jeanne Clery was a university student when she was raped and murdered on campus. Her parents pushed for federal legislation to require colleges and universities to report campus crimes and safety issues. The Clery Act was made law in 1990, along with additional related legislation such as the Campus Sexual Assault Victims’ Bill of Rights, Campus Sex Crimes Prevention Act, and Violence Against Women Act Amendment (Clery Center 2022). The information encompassed by these laws covers crime statistics, security policy descriptions, an open crime log, sexual assault, access to disciplinary records, stalking, domestic violence, and more (Clery Center 2022).
7.5.1 Campus Rape Culture and Sexual Assault
In all areas of society, female bodies are sexualized. Companies sell products based on how sexy or alluring a model looks in a commercial. Highly popular stories for small children tell of women being in distress only to be saved by the male character, and then they can live “happily ever after.”
Today, “1 out of every 6 women has been the victim of an attempted or completed rape in her lifetime” (RAINN N.d.b). On college campuses, the tie between sexual activity and gender-based power inequity is amplified due to the social nature of campus life. Fraternity and sorority organizations are the social center of many campuses. In her book Fraternity Gang Rape: Sex, Brotherhood, and Privilege on Campus, researcher Peggy Reeves Sanday (2007) presents evidence that fraternities provide socialization that encourages violent behavior toward women ranging from cat-calling about women’s bodies as they walk past fraternity houses to normalizing drugging and gang-raping women at parties.
Students of all genders are often unsure of what constitutes rape, and the legal definition varies by state. Frequenting campus parties with drugs and alcohol mean women can be accused of “asking for it” (inviting sexual intercourse/assault without their permission) merely by attending the party, even if they cannot consent due to drug/alcohol use or are unconscious. Victims may remember very little and are sometimes told about incidents after they occur.
Sanday (2007) explains society’s rationale for blaming the victim for campus assaults, “if a woman gets into a situation where she is alone at night with a bunch of drunken men, she gets what she deserves. She “deserves it” because she has not carried out her appointed task as regulator of her own and male sexuality” (Sanday 2007:106).
Men are more likely to be perpetrators of campus rape (Martin et al. 2022) with most rapes occuring by repeating offenders. Campus serial rapists share many commonalities with rapists in prison such as targeting vulnerable victims. Campus predators seek out younger women such as freshman, who are inexperienced with alcohol and drug use (Myths That Make It Hard to Stop Campus Rape 2010). “21% of TGQN (transgender, genderqueer, nonconforming) college students have been sexually assaulted, compared to 18% of non-TGQN females, and 4% of non-TGQN males” (RAINN. N.d.b).
Data on campus sexual assault emphasizes a lack of understanding of what defines sexual assault and hesitation to report incidents. One study found that college students do not always know the definition of or understand what type of behavior is considered sexual assault. “Regardless of victim status awareness, those who were victimized were significantly more likely to use higher levels of alcohol than non-victims, and were less likely to identify their victimization as sexual assault, highlighting the need for college students to understand that alcohol-involved sexual assault is still sexual assault” (Schwarz, Gibson, and Lewis-Arevalo 2017:45).
In higher education, Black women experience layered difficulties with violence on campuses. Dr. Sara Wooten studied the experiences of Black female sexual assault victims. Black females might hesitate to report sexual assault due to concern over societal perceptions of the offender depending on their racial identity and negative societal perceptions of them as victims. These factors are further compounded by their intersectional identities as Black women (Wooten 2017). Another study looking at sexual assault on campuses found that, “No differences were reported in medical care received; however, in comparison to their White counterparts, African American women reported decreased use of sexual assault crisis centers and mental health services, and post-assault help-seeking through use of sexual assault hotlines.” (Weist et al. 2014:902).
Criminal sexual violations by some students may be overlooked or given lighter sentences by administrators who see males as “needing to blow off steam” or who believe that such activities are natural for maturing males. In some cases, the administration’s need to keep groups of males in sports or in certain academic majors outweighs concerns for victims’ rights. Administrations participate in the campus culture of sexual victimization when they push back against women who do not immediately report incidents. Women may take days, months, or even years to physically recover from violent assaults and mentally be able to face what happened to them (Sanday 2007).
7.5.2 LGBTQIA+ Trans Youth Experiences
Violence occurs across all populations in society and in all educational institutions. The 2015 Transgender survey found that in grades K-12, “77% of those who were out or perceived as transgender had one or more of these negative experiences,” including “being verbally harassed, physically attacked, or expelled” (James et al. 2016). In higher education, the number of respondents reporting verbal, physical, or sexual harassment drops to about 24%. Students within the LGBTQIA+ community experience higher violence, discrimination, and suicide risk rates than other diverse identity groups (Johns et al. 2020). Policies addressing violence may not be equally applied to all youths, so explicitly addressing the issue is essential for the protection and academic success of transgender students.
Transgender students report higher rates of harassment and violence than non-transgender students. The negative experiences of transgender students in education are illustrated in figure 7.11 (Bolles 2015). This figure shows the types of adverse experiences transgender students face. They report feeling unsafe at school, verbal harassment, physical harassment, and physical assault. Figure 7.11 also shows that a majority of transgender students avoided entering or using bathrooms and locker rooms in their schools.
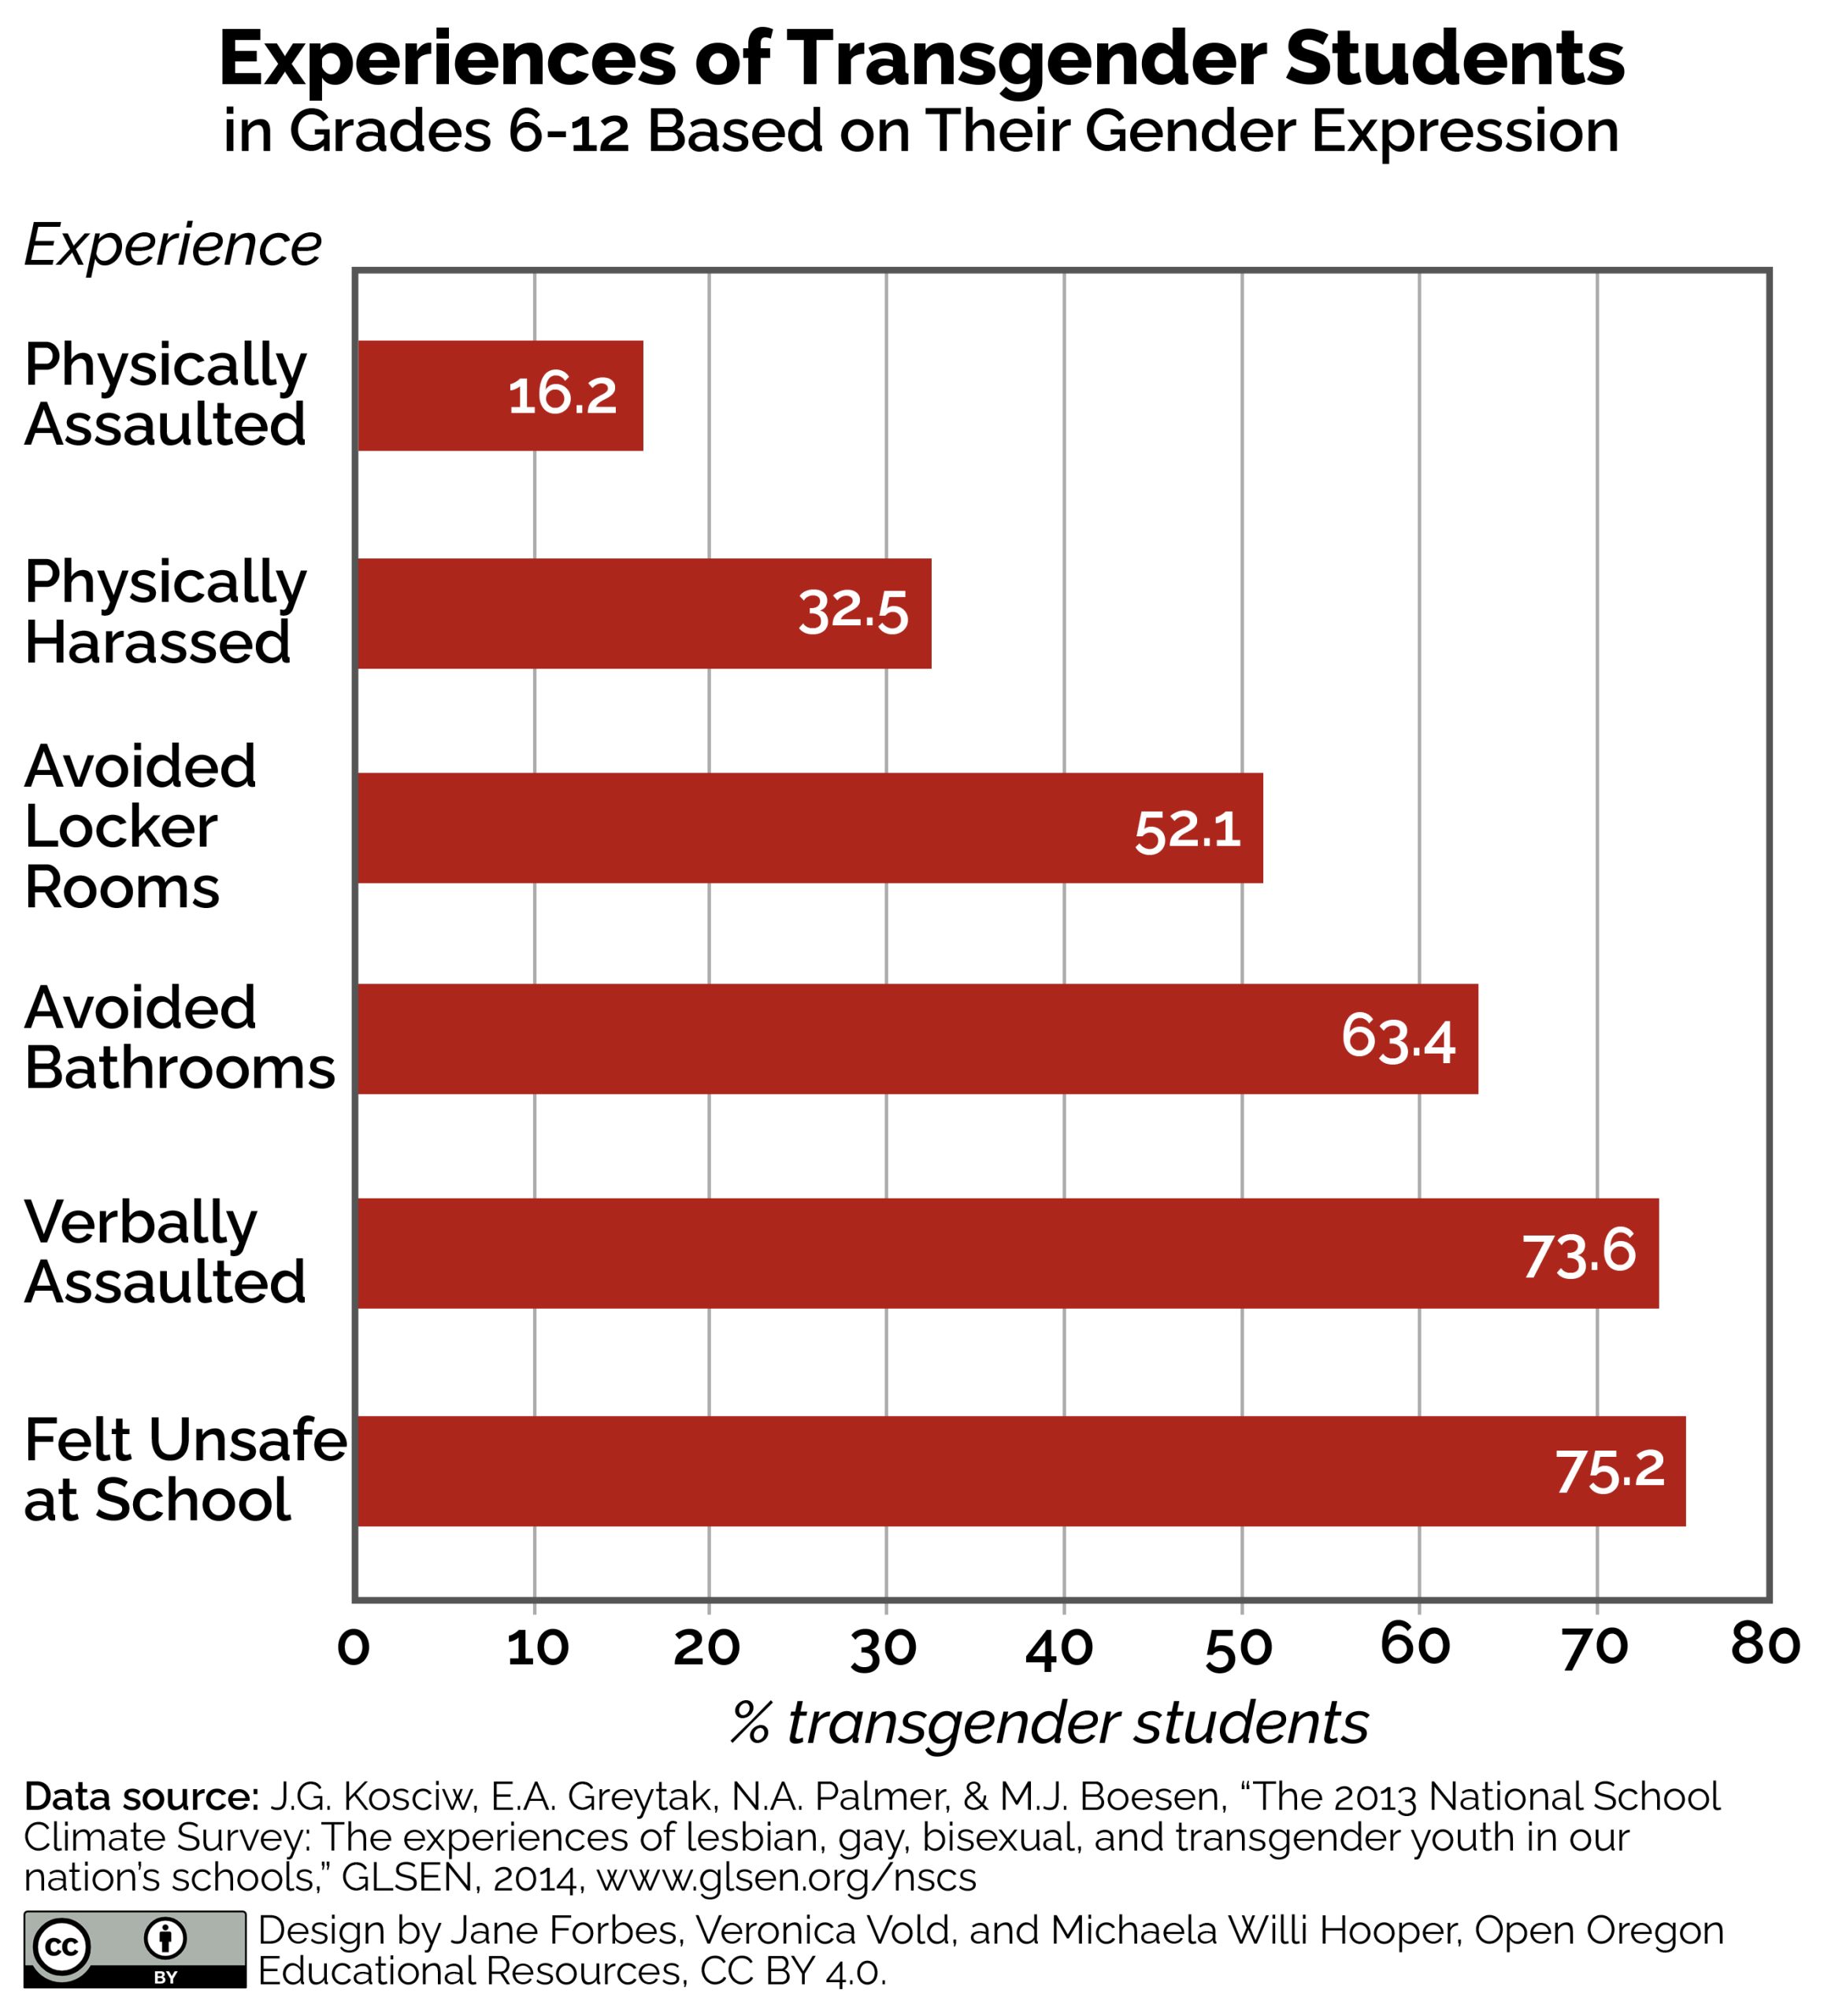
Figure 7.11. [Transgender students face many daily barriers which negatively impact their education.] Figure 7.11 Image Description.
Research finds that outlining discrimination and violent behavior against LGBTQ+ people in schools can help raise awareness of the issue and provide a solid framework for addressing incidents.
7.5.3 Activity: Sexual Assault and Misconduct at Universities
In 2015, the American Association of Universities studied the issue of sexual assault and sexual misconduct in depth. Their report’s key findings were:
Key Findings
- Overall, 11.7 percent of student respondents across 27 universities reported experiencing nonconsensual sexual contact by physical force, threats of physical force, or incapacitation since they enrolled at their university.
- The incidence of sexual assault and sexual misconduct due to physical force, threats of physical force, or incapacitation among female undergraduate student respondents was 23.1 percent, including 10.8 percent who experienced penetration.
- Overall rates of reporting to campus officials and law enforcement or others were low, ranging from five percent to 28 percent, depending on the specific type of behavior.
- The most common reason for not reporting incidents of sexual assault and sexual misconduct was that it was not considered serious enough. Other reasons included because they were “embarrassed, ashamed or that it would be too emotionally difficult,” and because they “did not think anything would be done about it.”
- More than six in 10 student respondents (63.3 percent) believe that a report of sexual assault or sexual misconduct would be taken seriously by campus officials.
Information from: Trends in Violence Victimization and Suicide Risk by Sexual Identity Among High School Students – Youth Risk Behavior Survey,
7.5.4 Licenses and Attributions for Violence in Education
Figure 7.10. “Number of on-campus hate crimes at degree-granting postsecondary institutions, by category of bias motivating the crime and type of crime: 2019” in Hate Crime Incidents at Postsecondary Institutions by the National Center for Education Statistics is in the Public Domain.
Figure 7.11. “Experiences of Transgender Students in Grades 6-12 Based on Their Gender Expression” by Jane Forbes, Veronica Vold, and Michaela Willi Hooper is licensed under CC BY 4.0. Data source: “The 2013 National School Climate Survey,” GLSEN.
“All sections of Violence in Education” by Jane Forbes is licensed under CC BY 4.0.
Image Description for Figure 7.11
Experiences of Transgender Students in Grades 6-12 Based on Their Gender Expression. Bar chart shows the percent of transgender students with specific experiences at school.
| Experience | Percent |
| Physically Assaulted | 16.2 |
| Physically Harassed | 32.5 |
| Avoided Bathrooms | 63.4 |
| Verbally Assaulted | 73.6 |
| Felt Unsafe at School | 75.2 |
Data source: J.G. Kosciw, E.A. Greytak, N.A. Palmer, & M.J. Boesen, “The 2013 National School Climate Survey: The experiences of lesbian, gay, bisexual, and transgender youth in our nation’s schools,” GLSEN, 2014.
