
6.3 What Is a Family?
The 2021 Census definition of a family is a group of two or more people, one of whom is the household head, who are related by birth, marriage, or adoption and residing together. All these people, including related subfamily members, are considered members of one family. What we typically see in mass media as a “nuclear family” is not often the reality for U.S. families.
Sociologists tend to define family in three key ways: how they relate to one another, such as if they are connected by blood, cohabitation, adoption, marriage, etc, where they function as an economic unit, and whether they have an emotional bond or connection to one another. The families a person is born or adopted into are called the family of origin. We also build family throughout our life as we meet, reproduce, cohabitate, marry, and divorce. Family dynamics can change as we care for aging parents or loved ones who may have raised us. Let’s look at the reality of the family structure in the United States today.
6.3.1 No such thing as a normal family
What comes to mind when you think of a family? Is it a husband, a wife, and two children—maybe even a pet? This structure has served as the idealized model for the traditional U.S. family for most of the twentieth century. But what about families that don’t look like this model, such as a single-parent household or an LGBTQIA+ couple without children? What about unmarried partners with children? Should they be considered families as well?
The social construct of a nuclear family is much less a reality than is believed. Less than 65% of children live in a household that contains both married biological parents, and another almost 5% live with both biological, unmarried parents (see figure 6.6). The number of children living in multigenerational households has increased annually since 2008. Additionally, 26% of children live in single-parent households, and 4% live with someone other than their parents. Children living in non-nuclear family households are more likely to face unpredictable family changes, including divorce, remarriage, unwed and separated parents, employment changes, or financial struggles (Census 2022).

Figure 6.6. Living arrangements of children under 18 according to census data, most children live with both parents, but around 30% do not.
When we think about families on the macro, or large structural level, we can examine families and social inequality issues. As we see above in Figure 6.6, single parents comprise a large percentage of U.S. households. Because these families have only one income, they tend to be more financially unstable. Data shows that BIPOC and Latinx populations comprise a higher percentage of U.S. single-parent households. Single parents are also more likely to live in segregated lower-income areas, have lower education levels, and have less access and resources to higher education. These combined factors perpetuate existing inequalities that deeply affect the generational wealth of these families.
The historically reiterated idea of the nuclear family isn’t a reality for many U.S. families. Why does the idea of the patriarchal, nuclear, cisgender, heterosexual family continue to be the narrative? Let’s look deeper into how the nuclear family was socially constructed.
When did the “nuclear family” become shorthand for the American family? This particular phrase was solidified in the 1950s, but prior history informed and defined the social construction of family. The video, Where Does the Nuclear Family Come From (fig 6.7) explores some of this social construction, but let’s learn more.
6.3.2 History of the Nuclear Family
Figure 6.7. Video Title: Where Does the Nuclear Family Come From (time 8.43)
During industrialization, people moved into cities to live near factories. A new division of labor emerged in many families: men worked in factories and elsewhere outside the home. In contrast, many women stayed home to care for children and do household work and production. For this reason, men’s incomes increased their patriarchal hold over their families. In some families, however, economic necessity required women to work outside the home. Families now had to buy food and other products instead of producing them, so many families’ living standards declined. But even when women did work outside the home, men out-earned them because of discriminatory pay scales. Men’s ability to bring more money into the family reinforced their patriarchal hold. Over time, work outside the home came to be seen primarily as men’s work, whereas housekeeping and raising children came to be seen primarily as women’s work (Coontz, 1997).
This marital division of labor changed during the early 20th century. Many women entered the workforce in the 1920s in response to a growing number of office jobs. The Great Depression of the 1930s led even more women to work outside the home for financial reasons. During World War II in the 1940s, a shortage of men in shipyards, factories, and other workplaces led to women joining the labor force to support the war effort and economy. They did so in large numbers, and many continued to work after the war ended.
As men came home from Europe and Japan, books, magazines, and newspapers pressured women to have babies, and babies they had. People got married at younger ages, and the birth rate soared, resulting in the now famous baby boom generation. Meanwhile, divorce rates dropped. The national economy thrived as auto and other factory jobs multiplied, and many families could realize their dream of owning a home for the first time. Suburbs sprang up, and many families moved to them. During the 1950s, most families did indeed fit the Leave It to Beaver model (figure 6.8) of the breadwinner-homemaker suburban nuclear family. Following the Depression of the 1930s and the war of the 1940s, the 1950s seemed an almost idyllic decade.

Figure 6.8. The Bees Knees Daily – Cast photo of the Cleaver Family from “Leave It To Beaver”
Even so, less than 60% of American children during the 1950s lived in breadwinner-homemaker nuclear families. Many lived in poverty, as the poverty rate then was almost twice as high as it is today. Teenage pregnancy rates were also twice as high as today, even if most pregnant teens were already married or decided to marry because of the pregnancy. Although not publicized much back then, alcoholism and violence in families were common. Historians have found that many women in this era were unhappy with their homemaker roles, suffering from what Betty Friedan (1963) famously called the “feminine mystique.”
In the 1970s, the economy worsened. Home prices and college tuition soared much faster than family incomes, and women began to enter the labor force as much out of economic necessity as out of a desire for fulfillment. In the 1970s, more than 60% of married women with children under 6 years of age were in the labor force, compared to less than 19% in 1960. Working mothers were no longer a rarity. However, the wage gap did and still very much affects income differentials between mothers and fathers who work out of the home.
Cross-cultural and historical records show that many types of family arrangements have existed throughout history. Two themes relevant to contemporary life emerge from our review of this record. First, although nuclear families have dominated social life, many children throughout history have not lived in nuclear families because of the death of a parent, divorce, or birth out of wedlock. The few societies that have not featured nuclear families seem to have succeeded in socializing their children and in accomplishing the other functions that nuclear families serve. In the United States, the nuclear family has historically been the norm, but, again, many children have been raised in stepfamilies or by one parent.
Secondly, as we see from the historical record, the nuclear family model popularized in the 1950s, in which the male was the breadwinner and the female the homemaker, must be considered a blip in U.S. history rather than a long-term model. Breadwinner-homemaker families did increase during the 1950s, and have decreased since, so their appearance during that decade was more of a historical aberration than a historical norm.
6.3.3 The Reality of Families Today
Many current political discussions and public policies still push the idea that hetero, cis, predominantly white middle to upper-class families are what many should subscribe to achieving. The idea is that these families are most prepared and able to raise productive members of society, which is inaccurate, as we have seen in this chapter. What is the reality of families that do not fit into this outdated model of family structure?
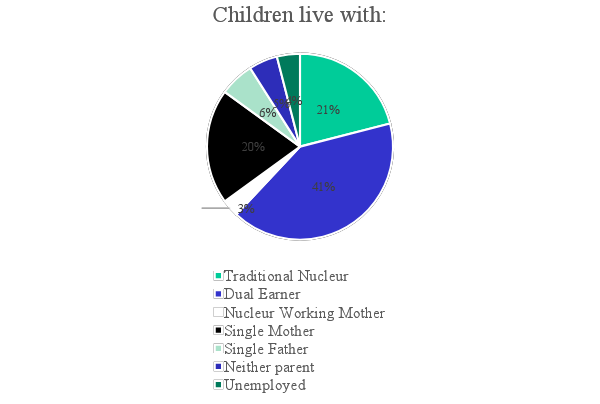
Figure 6.9 shows that very few children as of 2016 were living in a household that had both heterosexual parents with mother at home and father working. Maybe children lived with two adults that both worked and many with a single working parent or other arrangement.
As we see in figure 6.9, the reality of family structures today is that many will be unwed or single, cohabitating, blended or step-families, children living with other relatives, adoptions, multi-generational households, and other familial arrangements.
Changes in the traditional family structure raise questions about how such societal shifts affect children. U.S. Census statistics have long shown that children living in homes with both parents grow up with more financial and educational advantages than children raised in single-parent homes (US Census). Parental marital status seems to be a significant indicator of advancement in a child’s life due to resource accessibility. Children living with a divorced parent typically have more advantages than those living with a parent who never married; this is particularly true of children living with divorced fathers. This data correlates with the statistic that never-married parents are typically younger, have fewer years of schooling, and have lower incomes (US Census).
Many single parents and their children live near the poverty level. Although other factors such as age and education play a role in these differences, we can infer that marriage and long-term partnerships between parents are generally beneficial for children due to financial and scheduling stability. This reality is especially true for single mothers as the impact of the gender wage gap accounts for average lower incomes for women.
6.3.3.1 Single Parents
Single-parent households are on the rise, as we saw in the above Census Bureau data, now representing 26% of families. Of that 26%, 21% live with their mother, and 5% live with their father. This statistic does not include single parents that cohabitate with partners, boyfriends, or girlfriends.
Most research on single parents has focused on single mothers, as most single-parent households are female-led. Research on single parents also lacks a middle-class perspective, meaning that it focuses on lo- income populations.. Part of this is due to the majority of single mothers falling into the low-income category according to the U.S. Census, and also due to gender norms and the assumption of mothering over fathering. Fathers, men, tend to have higher paying jobs based on the gendered structure of work (chapter 8) falling into the middle class. Discussions on single parenting then become more highly associated with single mothers and do not explicitly apply to single fathers most of the time.
Single parents face more financial struggles due to less income from a second adult household member, significantly affecting single mothers as shown in Figure 6.10. Single parents also face higher rates of stress and task overload from parenting alone. This stress can be somewhat alleviated by using social and familial networks, but only so much social support can make up for the time, energy, love, and money it takes to raise children.
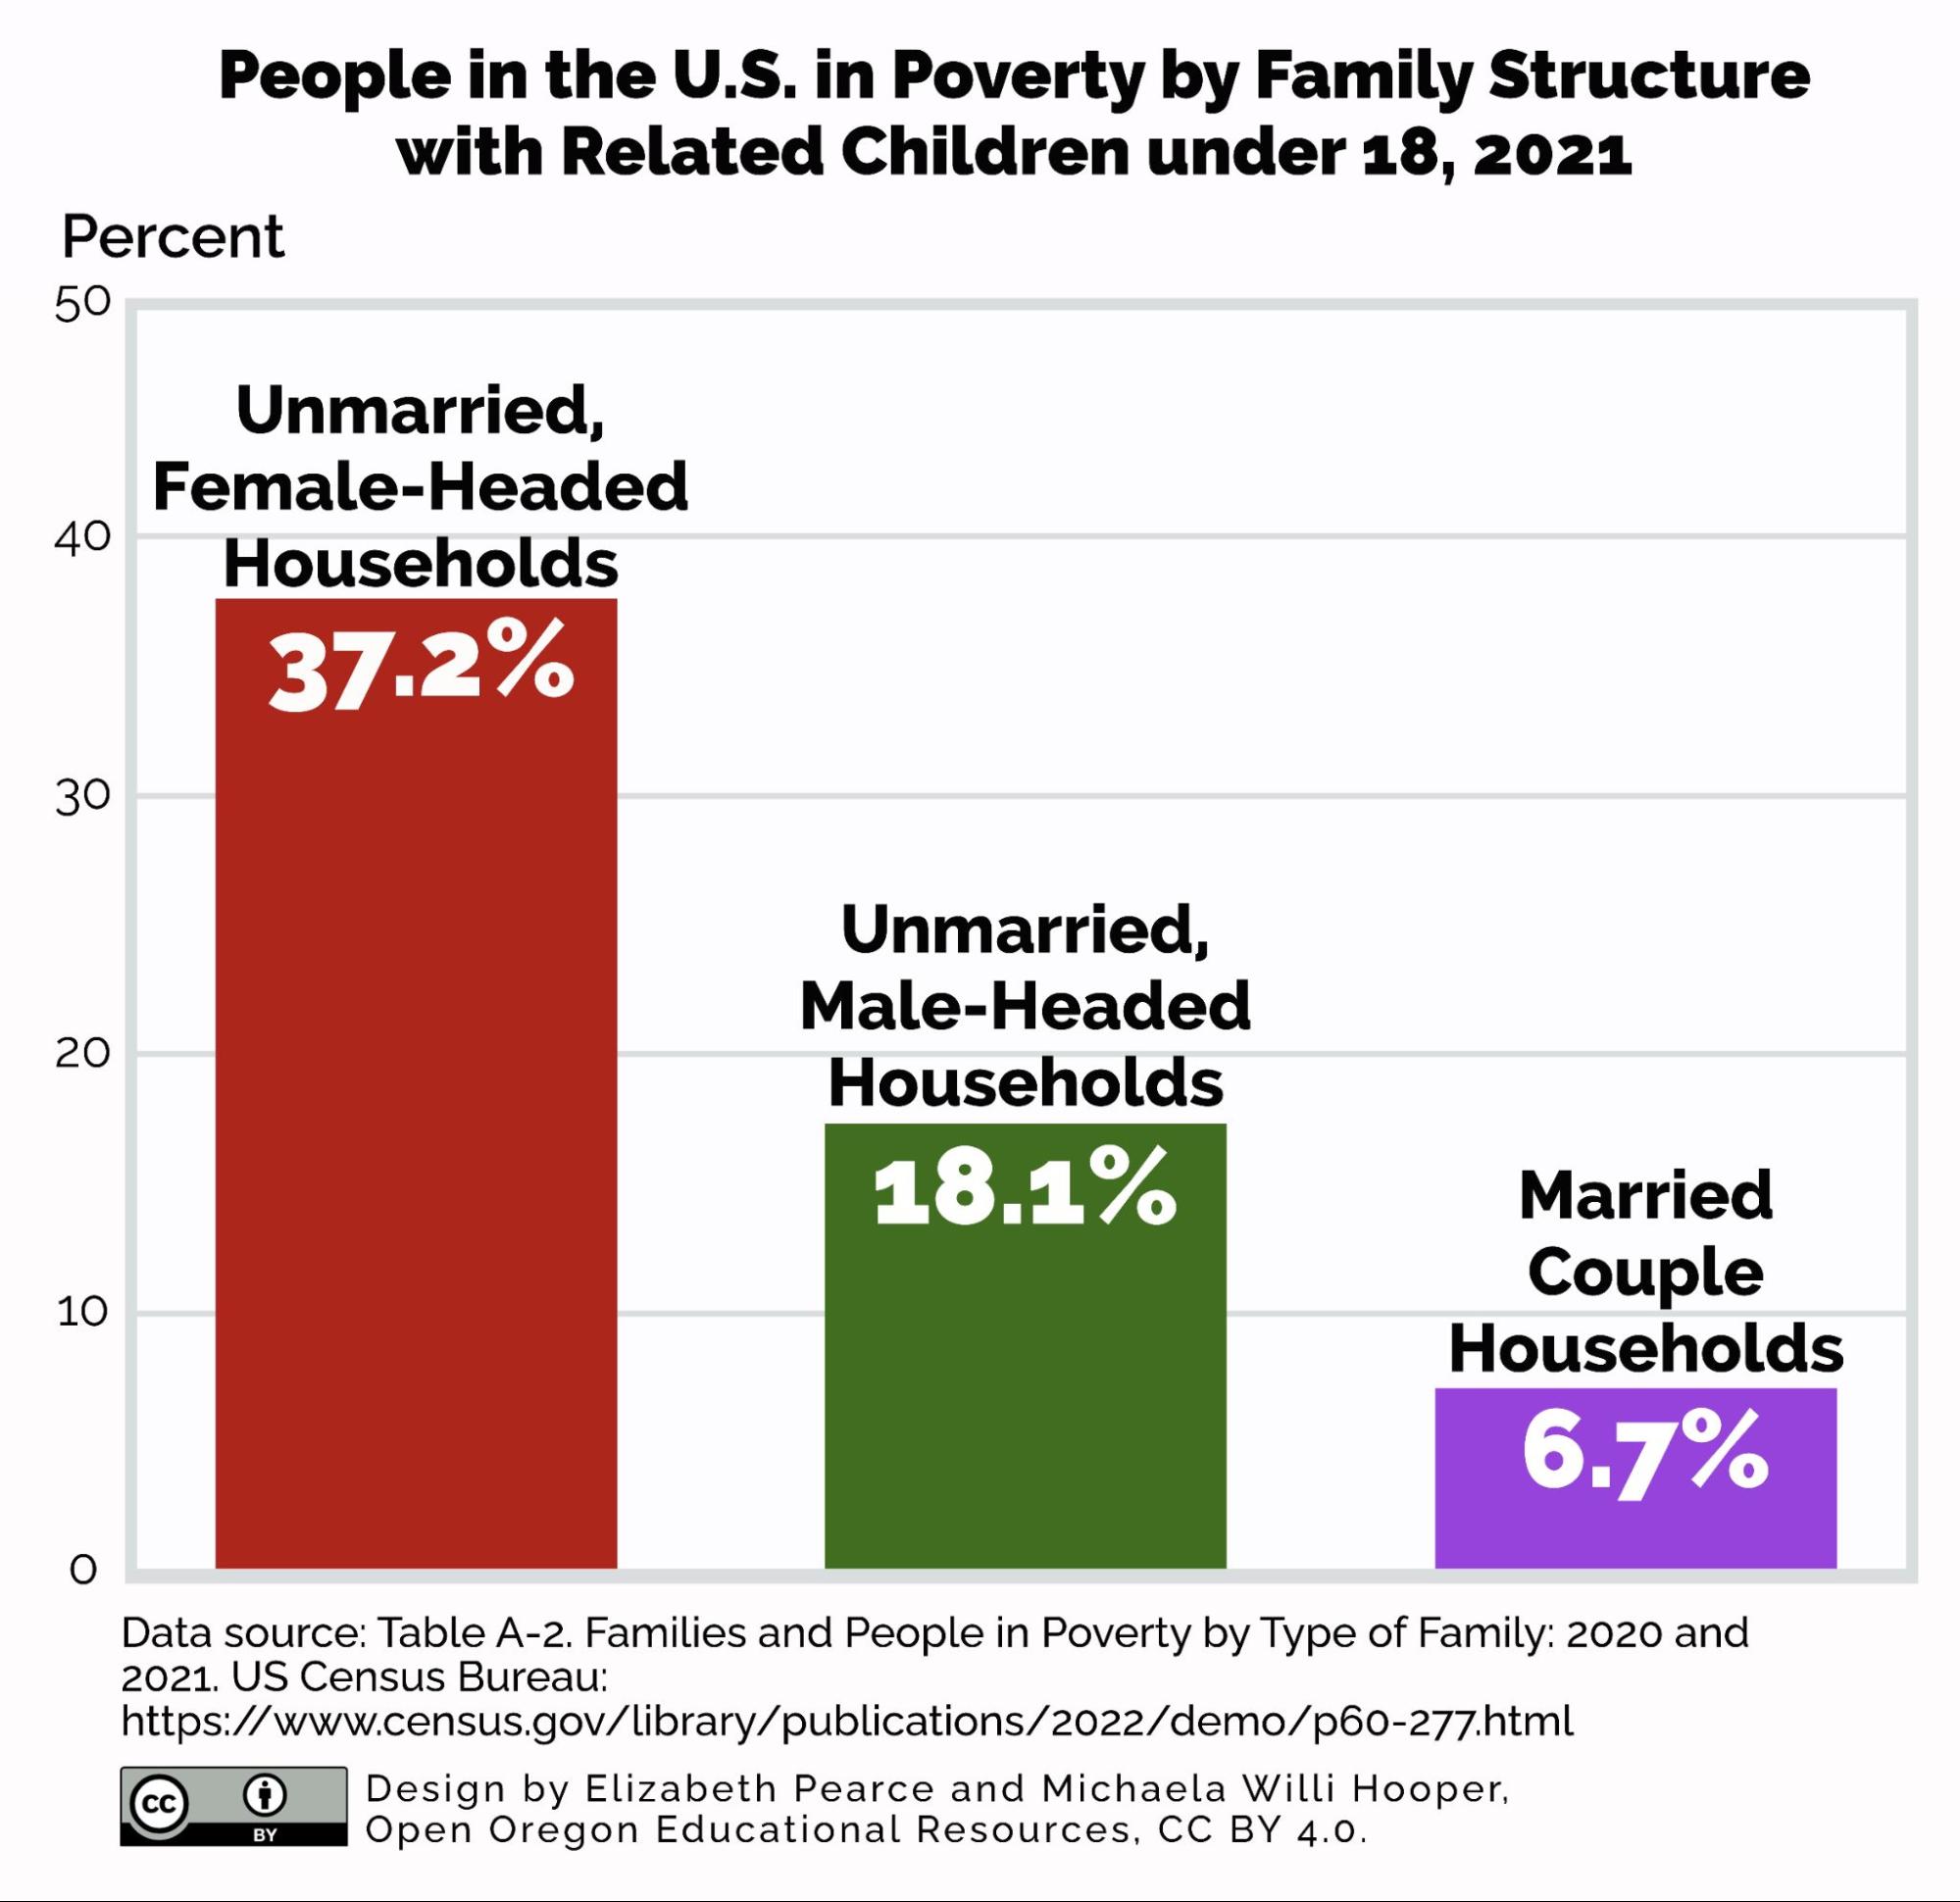
Figure 6.10 Shows poverty by household situation, where unmarried female headed households are significantly more impacted by poverty.
6.3.3.2 Step and blended families
Step-parents and blended families are additional family members often found in two-adult homes. Step-parenting is another adult cohabiting or marrying a parent with a child or multiple children. Blended families include two or more adult partners and their current biological children living together with children from previous relationships.
Among children living in two-parent households, 9 percent live with a biological or adoptive parent and a step-parent. The majority (70 percent) of those children live with their biological mother and a stepfather, emphasizing that in U.S. society, women still assume more responsibility for parenting. Family structure often varies with the age of the child. Older children (fifteen to seventeen years old) are less likely to live with two parents than adolescent children (six to fourteen years old) or young children (zero to five years old). Older children who do live with two parents are also more likely to live with step-parents (Current Population Survey, 2016). Children living with step-parents versus single-parent homes are much more likely to live above the poverty level due to shared income and resources.
6.3.3.3 Extended families
In some family structures, no parent is present. In 2010, three million children—4 percent of all children—lived with a guardian who was neither their biological nor their adoptive parent. Of these children, 54 percent live with grandparents, 21 percent live with other relatives, and 24 percent live with nonrelatives. An extended family is a household that includes at least one parent and child as well as other relatives like grandparents, aunts, uncles, and cousins.
Foster parents account for about a quarter of all nonrelatives. The practice of grandparents acting as parents, whether alone or in combination with the child’s parent, is becoming much more common in the US. Nine percent of all children live with a grandparent; in nearly half of those cases, the grandparent maintains primary responsibility for the child (U.S. Census 2011). A grandparent functioning as the primary care provider often results from parental drug abuse, incarceration, or abandonment. Events like these can render the parent incapable of caring for their child.
6.3.3.4 Queering family structures and relationships
What are LGBTQIA+ families? The contested definitions of family vary considerably across time and cultural contexts but have always influenced the understanding of LGBTQIA+ families. Researchers investigating social definitions of family in the United States found they included a broad range of understandings. This definition ranges from same-sex or hetero couples, regardless of marriage or children, to married heterosexual couples with children.
It is difficult to quantify how many people in the United States are in LGBTQIA+ relationships. U.S. census data gives us some idea, although the numbers are likely underreported. The U.S. census counted approximately 10.7 million adults (4.3 percent of the U.S. adult population) who identify as LGBTQIA+ and 1.4 million adults (0.6 percent of the U.S. adult population) who identify as transgender. Of those, approximately 1.1 million are in same-sex marriages (totaling 547,000 couples), and 1.2 million are part of an unmarried same-sex relationship (totaling 600,000 couples).
|
Identification |
Number of Adults in U.S. |
Percent of Adults in the U.S. |
|---|---|---|
|
LGBTQIA+ |
10.7 million |
4.3% |
|
Transgender |
1.4 million |
0.6% |
U.S. Census Count of LGBTQIA & Transgender Adults in U.S. Population
In terms of demographics, same-sex couples are not very different from opposite-sex couples. Although, same-sex couples report a slightly higher median income of almost $10,000. Additionally, 31 percent of same-sex couples, both married and partnered, are raising children, not far from the 43 percent of opposite-sex couples also raising children (U.S. Census 2020). Approximately 48 percent of LGBTQIA+ women and 20 percent of LGBTQIA+ men under age fifty are raising children.
|
Same-Sex Marriages |
Unmarried Same-Sex Relationship |
Opposite-Sex Couples |
|
|---|---|---|---|
|
Number of people in Relationship Type |
1.1 million |
1.2 million |
– |
|
Percent Of Couples Raising Children |
31% |
31% |
43% |
Same Sex Marriages and Relationships
Figure 6.11 shows some images of LGBTQIA+ families who are raising children. Some do so as part of a couple, and some as single parents. Approximately 3.7 million children in the United States have a parent who is LGBTQIA+, and about 200,000 have parents who are part of a same-sex relationship. Of the children in same-sex couple households, 73 percent are biological children of one parent, 21 percent are adopted only, and 6 percent are a combination of biological and adopted (U.S. Census 2009).

Figure 6.11. A same-sex couple with their children at San Francisco Gay Pride 2008.
Some same-sex relationships, with or without children, follow the expected norms regarding monogamy and exclusivity. And some relationships are “queer” or stray from traditional heteronormative relationship norms. These “queer” relationships include”
- polyamorous relationships with three or more committed partners,
- multi parent families often two women partners raising children with a male platonic friend who is the biological father,
- or platonic partnering often a queer man and woman who are friends and partner to raise a child.
Queer relationships can certainly lead to negative judgment and discrimination from external sources. However, individuals find the strength of these relationships is in their freedom, creativity, and the ability to live in a family or relationship tailor-made to those involved.
Much of the literature on same-sex relationship quality focuses on comparing LGBTQIA+ people’s dating, cohabitation, and marriage pathways and experiences with the heterosexual norm. This work has repeatedly found that LGBTQIA+ relationships experience the same satisfaction level compared to non-LGBTQIA+ relationships and that similar variables predict stability and overall satisfaction in these relationships. The outcome of this research has shown repeatedly that LGBTQIA+ relationships are just as well adjusted as their heterosexual counterparts and experience similar stressors.
However, LGBTQIA+ people, as stigmatized minorities, experience higher rates of mental and physical health challenges, such as mood and anxiety disorders, compared with heterosexual and cisgender people. This unique stress, called minority stress, affects those in LGBTQIA+ relationships internally (internalized heterosexism) and externally (experiences of discrimination) and negatively affects relationship quality and satisfaction.
One way to explain the connection is that internalized stigma increases the likelihood of experiencing depression, and depression produces stress in a relationship. In several studies of gay men, trust in relationships was influenced by experiences of discrimination when measuring overall relationship satisfaction. This research also showed those with lower internalized heterosexism had a greater sense of commitment and higher levels of relationship satisfaction (Kamen, Burns, and Beach, 2011; Lu, LeBlanc, and Frost, 2020).
This stress provides unique challenges for LGBTQIA+ couples and families compared with their straight and cisgender counterparts. LGBTQIA+ couples often have to navigate judgment and rejection from their families of origin and in systems, including employment and faith communities. Non-heteronormative couples may face more relationship scrutiny from others, although the impact of such scrutiny remains underexplored in research.
While there is some concern from mostly conservative groups in the United States regarding the well-being of children who grow up in same-sex households, research reports that same-sex parents are as effective as opposite-sex parents. In an analysis of 81 parenting studies, sociologists found no quantifiable data to support the notion that opposite-sex parenting is any better than same-sex parenting. Children of lesbian couples, however, were shown to have slightly lower rates of behavioral problems and higher rates of self-esteem (Biblarz and Stacey 2010).
6.3.4 Activity: Queering families
Being a trans parent in society can have some strong stigma and issues surrounding other’s perceptions of you as a parent. Please watch this video (13:44 minutes) and then consider the questions below
- What stuck out to you most about his description of what it is like to be a trans dad? Do you think it is similar to other dads?
- In what ways can we as communities create safe and welcoming spaces for trans parents and queer families?
- Can you think of ways that these experiences are similar and different to cis parents? Same-sex parents? What barriers do each face?
6.3.5 Licenses and Attributions for What Is a Family
“What Is a Family” by Heidi Esbensen is licensed under CC BY 4.0.
“History of the Nuclear Family” is adapted from “The Family in Cross-Cultural and Historical Perspectives” by University of Minnesota, Sociology, which is licensed under CC BY-NC-SA 4.0. Modifications: Edited and abridged by Heidi Esbensen
Paragraph on changes in family structure remixed from 14.2 Variations in Family Life – Introduction to Sociology 3e | OpenStax CC BY 4.0.
Queering Family Structure includes some content from LGBTQ+ Relationships and Families by Sarah R. Young and Sean G. Massey, which is licensed under CC BY 4.0. Mixed, modified and edited by Heidi Esbensen.
Figure 6.6. “Living arrangements of children under 18” by Heidi Esbensen is licensed under CC BY 4.0. Data from “Census Bureau Releases New Report on Living Arrangements of Children,” US Census Bureau.
Figure 6.7. “Where does the Nuclear Family Come From?” by PBS Origins is included under the Standard YouTube License.
Figure 6.8. “Cast photo of the Cleaver Family from “Leave It To Beaver” by The Bees Knees Daily is included under fair use.
Figure 6.9. “Children Live With” by Heidi Esbensen is licensed under CC BY 4.0.
Figure 6.10. “People in the U.S. in Poverty by Family Structure with Related Children under 18, 2021” by Elizabeth Pearce and Michaela Willi Hooper is licensed under CC BY 4.0. Data from Table A-2. Families and People in Poverty by Type of Family: 2020 and 2021, US Census Bureau.
Figure 6.11. “Parents” by Caitlin Childs is licensed under CC BY-SA 2.0.
