9.3 Health
How do you know if you are healthy? Do you take walks regularly, take illegal drugs, have many years of formal education, or live in poverty? These are all factors that affect our health. Researchers measure an individual or population’s health by looking at general statistics. Mortality rate is a term used to describe the annual death rate in a population per 1000 individuals. Infant mortality and life expectancy are ways we can learn about healthcare access and overall quality of life for a population. “Infant mortality is the death of an infant before his or her first birthday. The infant mortality rate is the number of infant deaths for every 1,000 live births” (CDC N.d.). In 2020, the infant mortality rate in the United States “was 5.4 deaths per 1,000 live births” (CDC N.d.).
How does that compare to other countries? In 2020, Unicef ranked the United States 50th globally for infant mortality rate at 5.44 deaths per 1000 live births. (Unicef N.d.). Iceland has the lowest infant mortality rate at 1.54, while Sierra Leone has the highest at 80.10 deaths. (World Population Review N.d.b). Comparison of information between countries around the globe is difficult as different countries collect information differently. Some countries collect data on infant deaths for only the first six weeks of life compared to infant deaths through the first year. Some countries may or may not consider pregnancy loss, such as stillbirth or miscarriages, as infant deaths.
Infant mortality is directly associated with global gender equality. Countries with high infant mortality rates typically have problems with gender discrimination. Researchers maintain “that the initiatives to curtail child mortality rates should extend beyond medical interventions and should prioritize women’s rights and autonomy” (Brinda et al. 2015:1). Addressing issues of rights for all genders will increase children’s survival. Figure 9.4 shows medical students at a conference in Rwanda, Africa learning medical procedures for family planning and freedom of women’s sexuality.
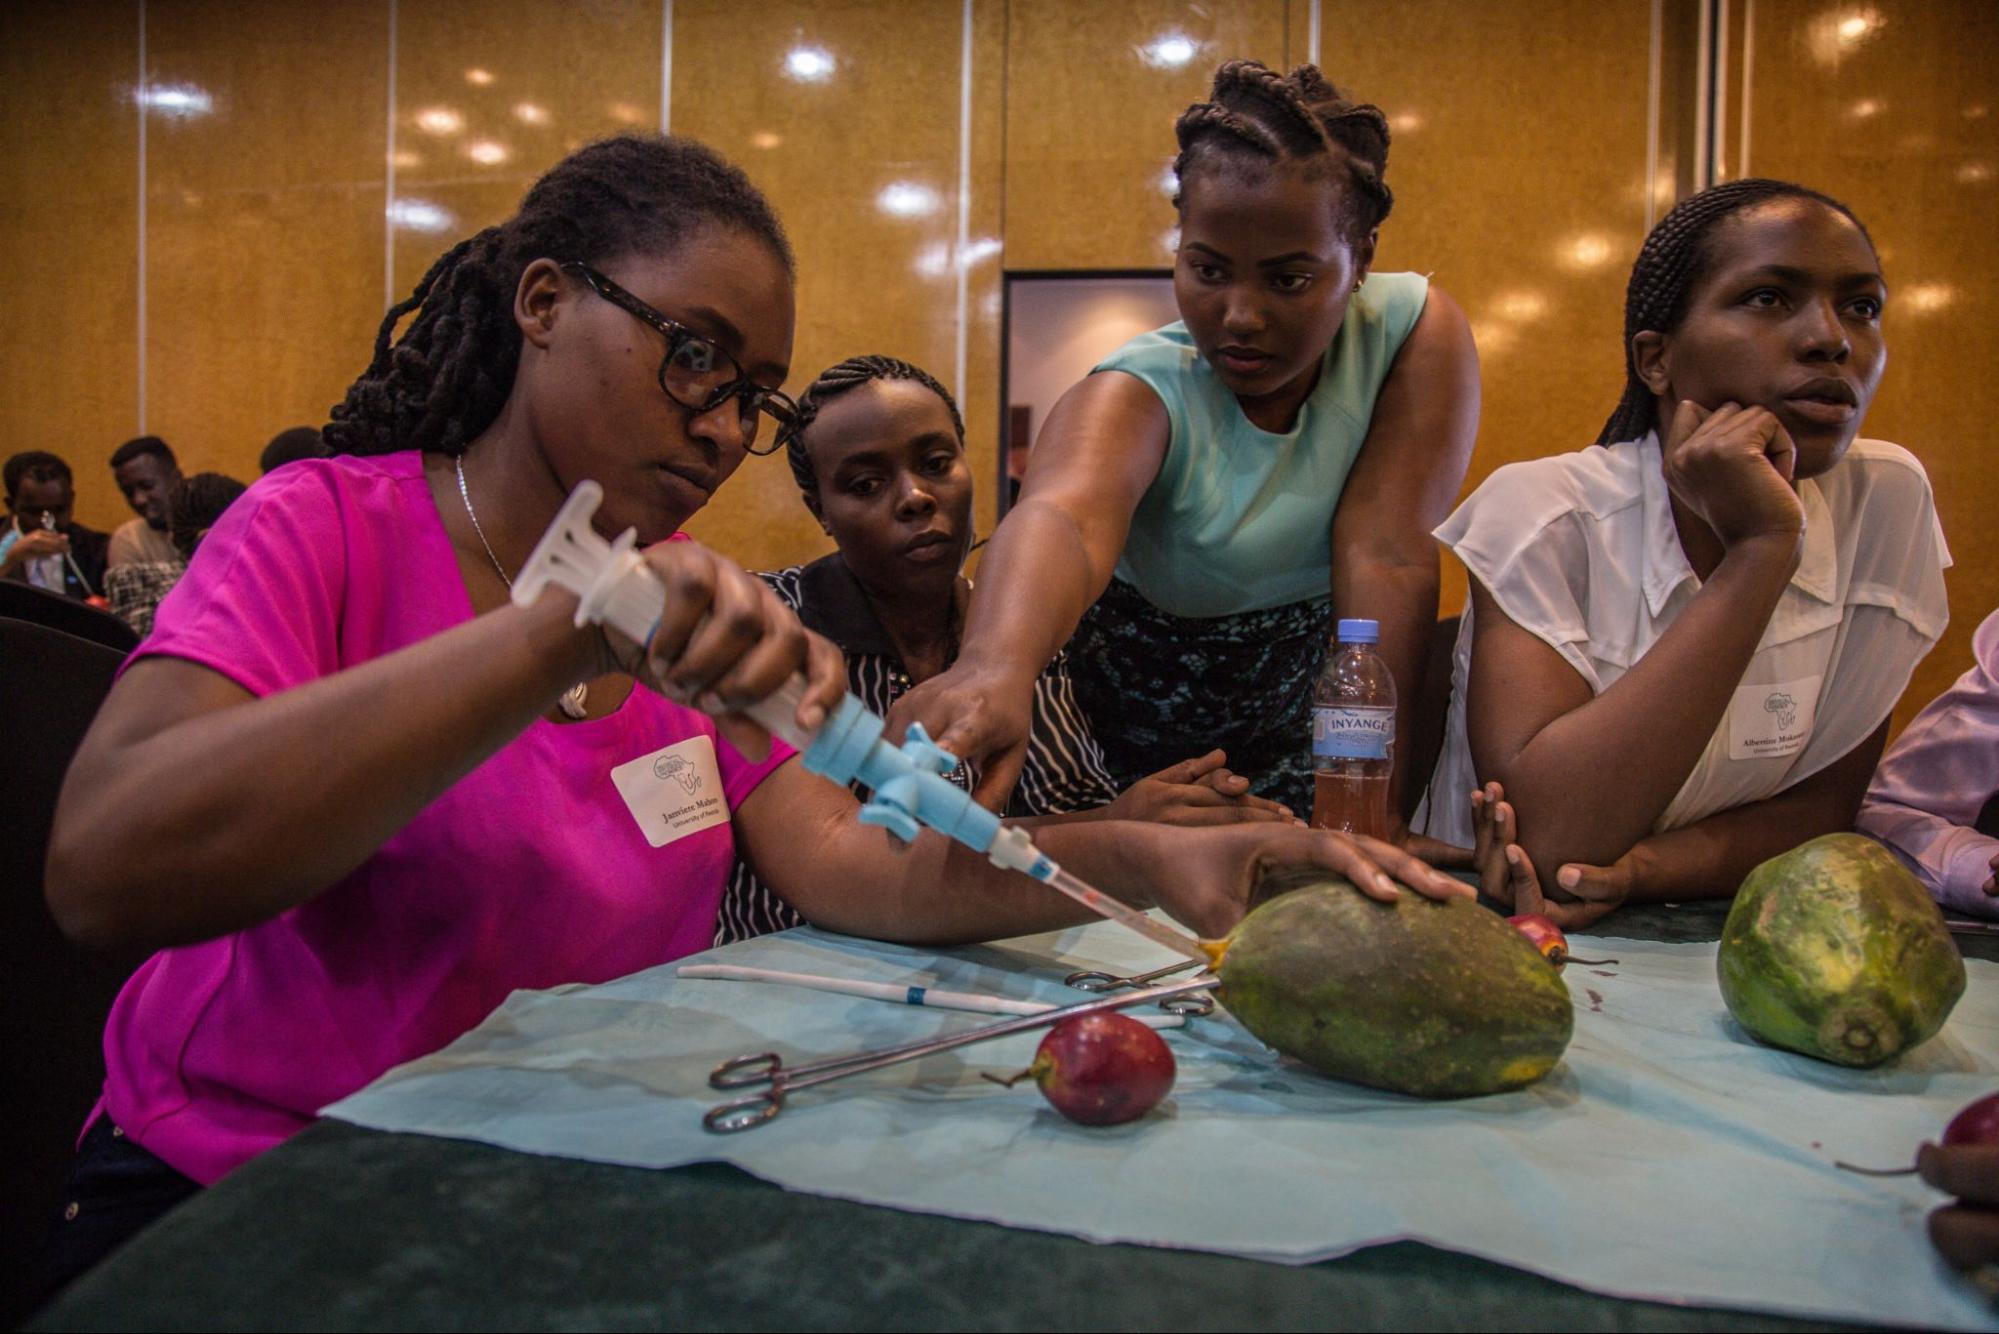
Figure 9.4. Medical students and practitioners from across Africa gather at the second regional Medical Students for Choice conference. Papayas are used to mimic a uterus and cervix for teaching healthcare procedures.
Another measure of health used globally is life expectancy. A society facing poor environmental conditions, such as lack of food, or poor societal conditions, such as violence, can suffer from reduced lifespans. Life expectancy is how long an individual can expect to live. Life expectancy in the United States grew for decades, then started to decline just before the Covid-19 pandemic due to drug-related deaths. COVID-19 has continued that decline. In 2020, life expectancy in the United States was 81.65 years for females and 76.61 years for males (CDC N.d.). In Oregon, the projected life expectancy is 79.3 years for all genders (worldpopulationreview N.d.). Reasons for women outliving men include biological factors such as lower death rates from ischaemic heart disease possibly resulting from higher estrogen hormone levels. Social factors that influence men’s lower life expectancy are that they are less likely to seek healthcare and have significantly higher suicide, homicide, and road injury rates (World Health Organization, 2019). Since biological outcomes such as mortality rates are deeply intertwined with social factors such as access to healthcare, it is difficult to separate the two factors.
Gender equality, or parity, including access to power in society, such as voting rights, food, education, work, and healthcare, is directly linked to life expectancy. Globally, “countries where educational gender parity is higher, could expect years of greater life expectancy for both men and women, along with significantly fewer maternal deaths per 100,000 live births. A separate but related measure of women’s participation in the labor force suggests that increased gender parity in the workplace is also associated with a lower national maternal mortality rate and significant extensions to female life expectancy” (UCLA 2020). Maternal mortality rate refers to maternal deaths per 100,000 live births. Some studies found that increasing gender equality policies can increase women’s and men’s life expectancy (Kolip and Lange 2018).
9.3.1 Factors that Contribute to Health
You’ve probably seen advertisements for vitamins, exercise plans, or food routines that claim to help improve your health. Professionals agree that eating fresh fruits and vegetables and minimizing junk food will help us be healthy. Still, sociologists and public health researchers also look at other areas of society that influence our health. Social determinants of health are “the range of personal, social, economic, and environmental factors that influence health status” (ODPHP n.d.). Some of our health is predetermined by our genes, such as whether or not we may develop certain types of cancer. Our education, income, where we live, and other parts of our lives influence our everyday health which then influences how long we may live.
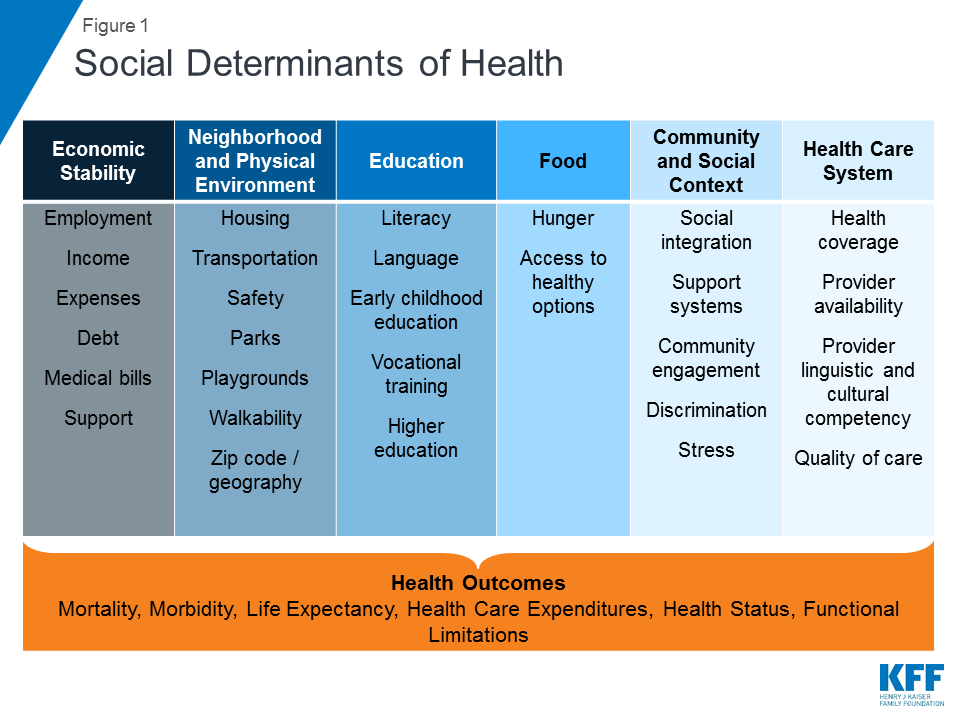
Figure 9.5. The social determinants of health listed in this table are aspects of an individual’s life which can positively and negatively influence their health outcomes.
As shown in figure 9.5, many aspects of our lives influence our health including income, transportation, literacy, stress, and access to healthcare. Data from the 2020 United States National Vital Statistics Report shows that Hawaii and Washington State have the highest life expectancy at 80.7 years and 79.2 years, respectively. West Virginia’s life expectancy was 72.8, second from last, with Mississippi coming in last at 71.9 years (CDC Nat Vital Stats Report 2022). Figure 9.6 shows the life expectancy in each state for 2020.
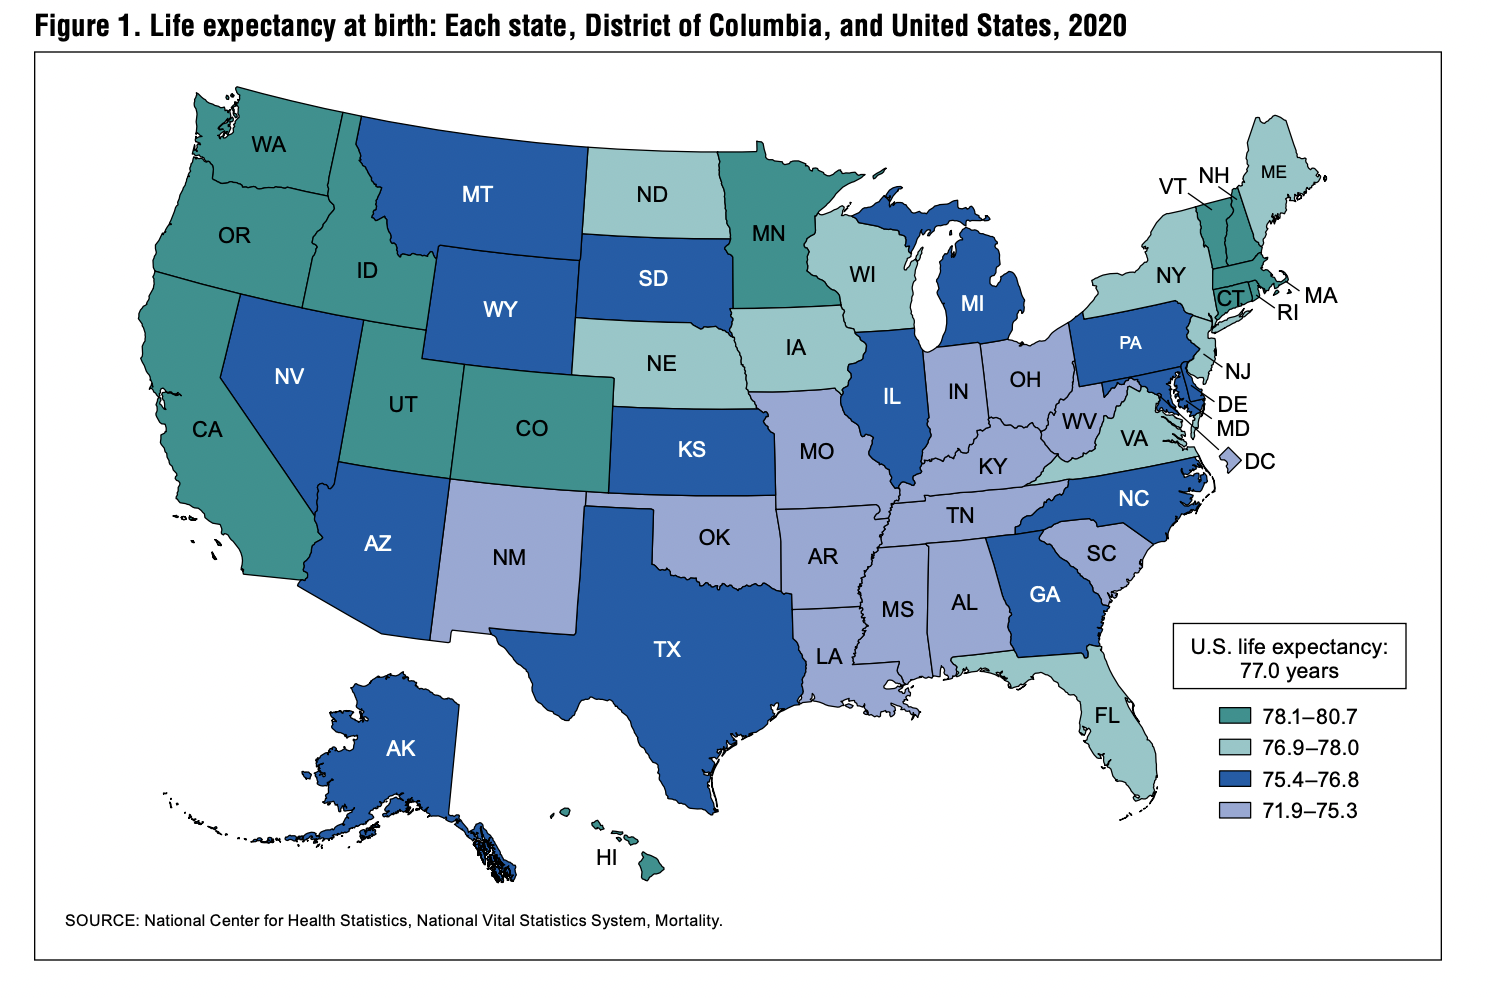
Figure 9.6. States in the southern part of the U.S. have lower life expectancies while many states in New England and the West Coast have the highest life expectancies.
Other societal elements factor into the life expectancy equation as well such as income and education. For income, a 2016 study found a “gap in life expectancy between the richest 1% and poorest 1% of individuals was 14.6 years” (Chetty et al. 2016). People with college and graduate degrees can expect to live over 10 years longer than people with less than a high school education. Although education itself does not increase a person’s life expectancy, behaviors of people with advanced education such as eating healthier, having better access to medical care due to higher incomes, and exercising more, positively influence life expectancy.
Does this mean if you move to Hawaii and earn a college degree, you will automatically live longer? Not necessarily. Living in Hawaii may mean you are more likely to live an active lifestyle due to the weather, something health professionals know extends your life expectancy. Obtaining a higher education means you most likely have a higher-paying job with access to healthcare benefits and safer neighborhoods. Being an unmarried female is also correlated with poverty and therefore linked to poor health. “Related children under the age of 18 in female-headed households (38.1 percent) were in poverty at five times the rate of their counterparts in married-couple families (7.5 percent) and twice the rate of children in male-householder families (17.8 percent)” (Shrider et al. 2021: 20). The social determinants of health help us understand that many societal factors influence our health over our lifetime, including gender discrimination and social stratification.
One factor that adversely affects health is living in poverty. Lack of access to healthy food is one of the main issues people in poverty face daily. “Women (11 percent) were more likely than men (8 percent) to live in poverty in 2019. Women were also more likely than men to be in extreme poverty: five percent of women versus four percent of men lived in extreme poverty in 2019.” (Fins 2020:1). Cities across the nation experience food deserts, including in Portland, Oregon. “At least six neighborhoods—Argay, Wilkes, Powellhurst-Gilbert, Pleasant Valley, Centennial, and Wilkes—have been identified as food deserts or low-income areas where residents must travel over a mile to get groceries.” (Herron 2019). Taking public transportation to locations with full-service grocery stores is not always an option due to physical constraints, lack of transportation options, or a high personal safety risk due to crime. Higher levels of exposure to unsafe and unhealthy living arrangements are found in impoverished neighborhoods. Living in poverty means you are more likely to be exposed to high levels of toxic substances such as lead, rodents, and mold.
Access to clean water is another common issue faced by people in poverty. This is a structural inequality where “471,000 households or 1.1 million individuals lack a piped water connection.“ (Meehan et al. 2020:28704). Lack of clean water negatively affects personal hygiene, such as washing hands, clothing, and the body. Contaminated water and poor sanitation can also cause illness. Figure 9.7 illustrates the importance of clean water. Not having safe drinking water means contaminants like parasitic worms, lead, and arsenic are found in untreated water, causing severe illnesses (Meehan et al. 2020).

Figure 9.7. Unsafe drinking water can contain substances harmful to people’s health. Many people in the United States do not have access to safe drinking water in their homes.
Another significant factor affecting the health of people in poverty is violence. Women in poverty and women of color are disproportionately affected by domestic violence in the United States. Transgender people, who are likely to be in poverty by more than double the national average, are also significantly negatively affected by intimate partner violence (James 2016). In a 2015 survey of transgender people, “more than one-third (35%) experienced physical violence by an intimate partner, compared to 30% of the U.S. adult population. Nearly one-quarter (24%) experienced severe physical violence by a current or former partner, compared with 18% of the U.S. population” (James 2016:15).
9.3.2 Unequal Access to Health
Although healthcare can be seen as a pervasive institution in society, accessing care is not that easy for some groups. People living in poverty, people of color, and people living in rural areas have difficulty accessing high-quality healthcare.
Women are affected adversely by unequal access to and institutionalized sexism in the healthcare industry. According to a recent report from the Kaiser Family Foundation, women experienced a decline in their ability to see needed specialists between 2001 and 2008. Quality is partially indicated by access and cost. In 2018, roughly one in four (26%) women—compared to one in five (19%) men—reported delaying healthcare or letting conditions go untreated due to cost. Because of costs, approximately one in five women postponed preventive care, skipped a recommended test or treatment, or reduced their use of medication (Kaiser Family Foundation 2018).
A 2020 study on Women’s Health Care found that “among people who have visited a doctor in the past two years, women are more likely than men to say a health care provider has dismissed their concerns (21% vs. 12%) or didn’t believe they were telling the truth (10% vs. 7%)” (Long et al. 2021). Delaying care and receiving poor quality care negatively impacts health and life outcomes for groups facing these barriers.
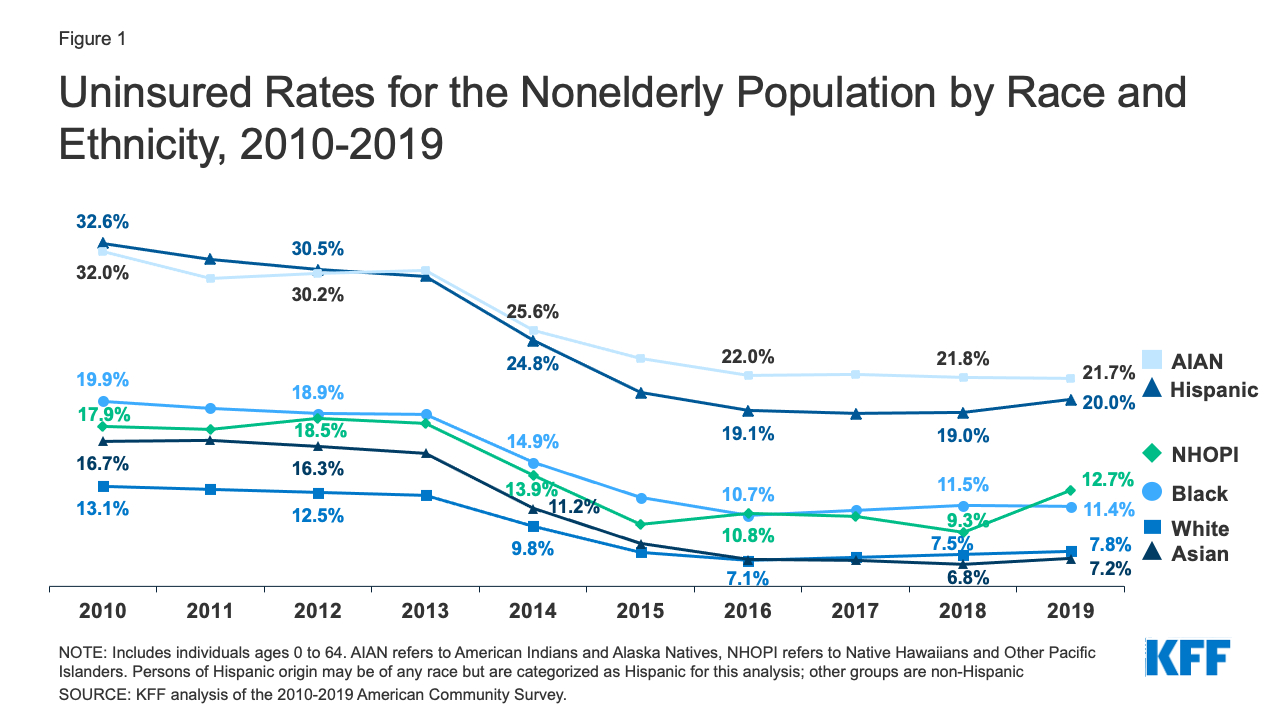
Figure 9.8. Uninsured Rates for the Nonelderly Population by Race and Ethnicity, 2010-2019. People of color are less likely to have medical insurance. People who identify as American Indian and Alaska Natives (AIAN) and Hispanic are most likely to not have health insurance coverage.
Another barrier to access to care for some groups in society is insurance. As shown in figure 9.8, many people of color lack health insurance, which can slow or prevent needed health services. People who lack insurance experience deadly consequences because they are less likely to receive preventive health care and care for various conditions and illnesses. For example, because uninsured Americans are less likely than those with private insurance to receive cancer screenings, they are more likely to be diagnosed with more advanced cancer rather than an earlier stage of cancer (Halpern et al. 2008).
9.3.3 Unequal Health Outcomes
If you had a heart attack and went to the hospital, you would expect the same care as everyone else, right? This is not always the case, as personal biases and biases in medical literature can affect how we receive care. Differences in health outcomes by gender, race, and class are well documented (Smith et al. 2003; LaVeist and Isaac 2012). Depending on your intersectional identity, accessing needed healthcare may be more difficult due to your distance to a doctor, hospital, or urgent care clinic. Also, when you get to the doctor or hospital, the care you receive may differ based on your gender, race, and class.
Financial barriers due to the cost of care are an issue for transgender people seeking healthcare. This is rooted in workplace instability where many workers get their healthcare coverage and transgender people are more likely to be in poverty than the general population. Fear of being treated poorly and distance to transgender-related care were also factors noted as negatively impacting transgender people’s access to healthcare in the US Transgender Survey in 2015 (James et al. 2016).
When looking at many social determinants of health discussed earlier in this chapter, Figure 9.9 shows life outcomes by race identity groups. Being part of a particular race group impacts all areas of health, including status, outcomes, and behaviors in society.
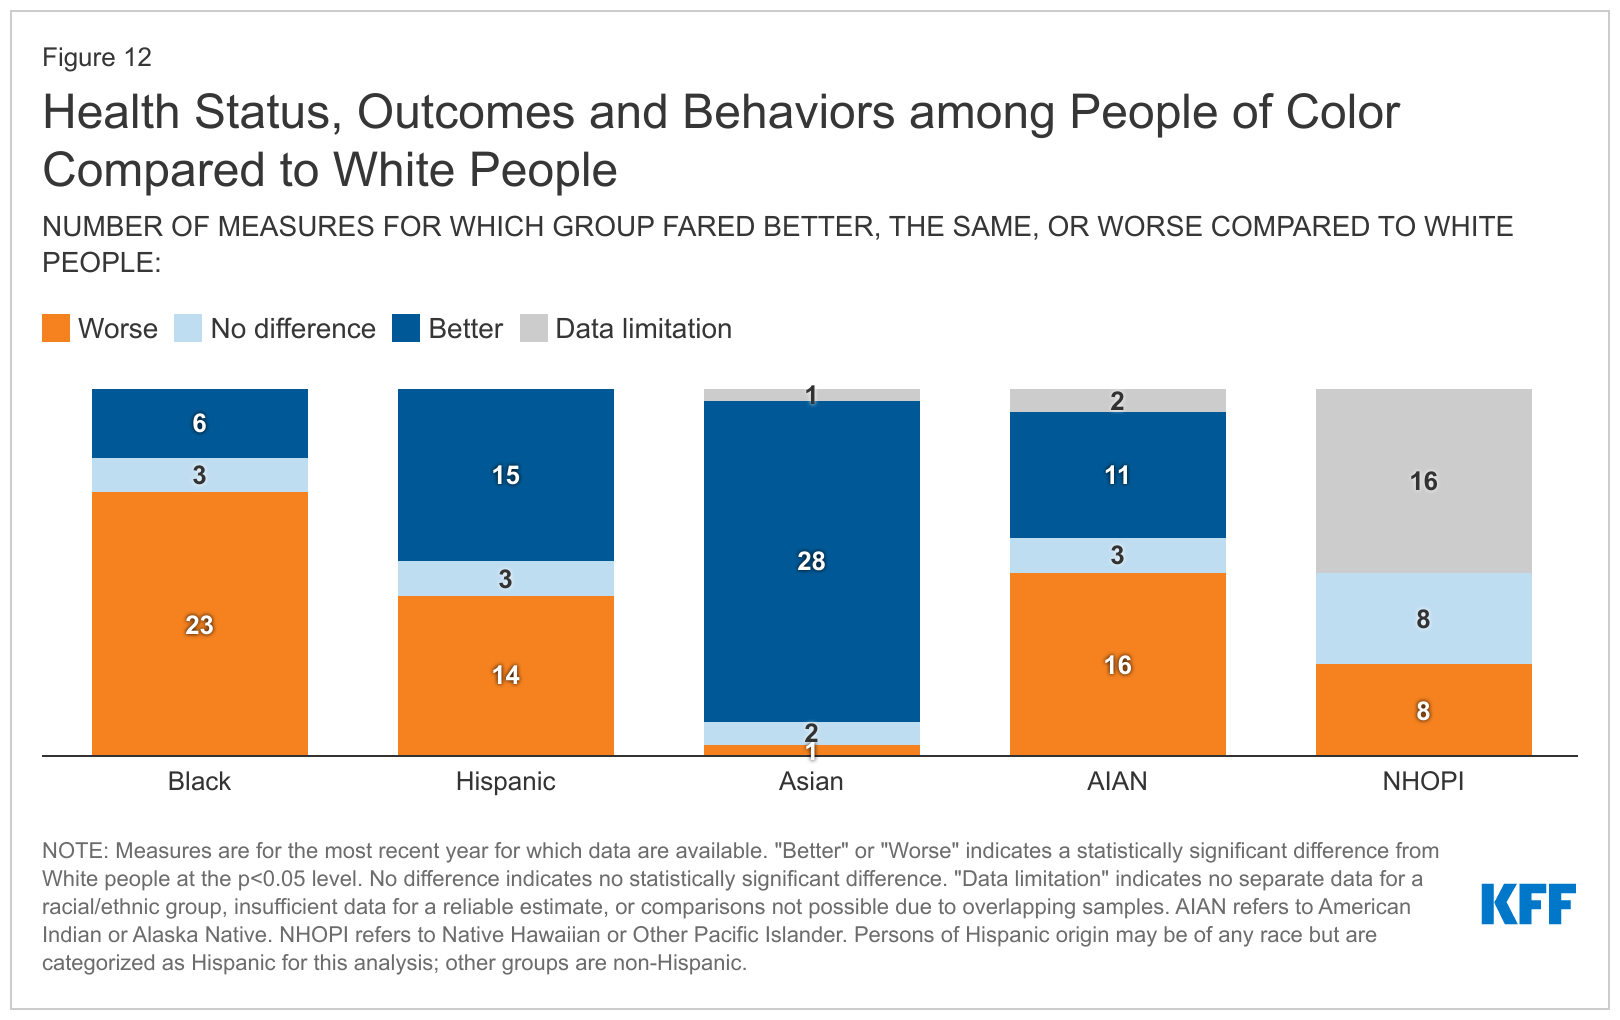
Figure 9.9. Health status, outcomes, and behaviors among people of color compared to White people. This table shows how aspects of the social determinants of health intersect to create more positive or negative life experiences for some groups.
As we learned earlier in the chapter, life expectancy is a good indicator of healthcare access and quality. In 2020, “life expectancy for Black people was only 71.8 years compared to 77.6 years for White people and 78.8 years for Hispanic people. Life expectancy was even lower for Black males at only 68 years” (Hill, Artiga, and Haldar 2022). Other contributing factors include lack of health insurance access and being less likely to seek or obtain needed care. Needed care may consist of immunizations, cancer screenings, flu vaccines, pap smears, and mammograms (Hill, Artiga, and Haldar 2022).
Discussions of health by race and ethnicity often overlap with discussions of health by socioeconomic status (SES) since the concepts are intertwined in the United States. Research on SES finds “that low-income people have poorer self-reported health and higher rates of communicable and noncommunicable diseases and injuries because of a constellation of risk factors, such as smoking, unhealthy diet associated with food poverty and insecurity, stress and anxiety, and unemployment and job insecurity, among others” (Avanceña et al. 2021). These factors affect a population’s Morbidity, which is the incidence, or amount, of disease in a population.
Economics are only part of the SES picture, and education also plays an important role. Influences in our early life such as parent’s SES, childhood physical and mental health, and genetics play a part in determining access to education throughout our lives. With increased education as noted above, likelihood of a higher SES as an adult increases through positive health-related behaviors, social and psychological resources, and occupational wealth (Hummer and Hernandez 2013).
9.3.4 Mental versus Physical Health Issues
People with mental disorders have medical conditions that make it more difficult to cope with everyday life. People with mental illnesses have severe, lasting mental disorders that require long-term treatment. According to the National Institute of Mental Health (NIMH), there are 50 million adults living in the United States with mental illness or mental disorder, or 20 percent of the total adult population. Of these, 13 million have a serious mental illness or mental disorder (5 percent of the adult population); a serious mental illness causes impairment or disability (National Institute of Mental Health 2021). People of color who are sexual minorities are more likely to experience stress, anxiety, and depression in their lives. Because of their heightened life stressors, they experience poorer mental health over their lifecourse (Parra et al. 2022).
The global COVID-19 pandemic has profoundly impacted women compared to men in the workplace, creating gender disparity associated with mental health. In occupational fields where women comprise nearly three quarters of the workforce, outcomes of increased depression and psychological distress have resulted, creating even greater gender disparity in terms of mental health risks. These include an exponential increase in substance use associated with mental health issues for which continued stigma and negative perceptions of mental health conditions and substance use have prevented the pursuit of treatment. Further, the increased occurrence of interpersonal violence experienced by women during COVID-19 also presents considerable comorbidity with mental health issues.
9.3.5 Eating Disorders as a Gendered Health Issue
One health issue that has historically plagued society is that of body image. Think about the Vitruvian Man picture from the start of this chapter. How close to that ideal image are most people you see every day? Pictures of glamorous celebrities with “desirable” features grace the covers of magazines. Images of men include muscular build and above-average height, whereas women typically have large breasts, narrow waists, and long, flowing hair. Social researcher Jean Kilbourne’s famous documentary of women in media, Killing Us Softly, was first released in 1979. The most recent update in 2010 continued the review of the damaging impact of body image expectations and gender normative ideals in advertising and other forms of media (Kilbourne N.d.). These images circulated throughout society perpetuate an ideal that can lead to dangerous eating disorders for all genders.
People struggling with gender identity can turn to disordered eating to cope with feelings about their bodies and self images (Brewer, Hanson, and Caswell 2022). The behavior of regulating and even restricting food intake may begin before puberty in an attempt to control body changes (Coelho et al. 2019). Research finds that “among college students in the United States, transgender students were over four times more likely to self-report an eating disorder diagnosis and over twice as likely to have used diet pills, vomiting, or laxatives in the past month compared with cisgender heterosexual women” (Linsenmeyer 2021).
Eating disorders include binge eating disorder, bulimia nervosa, and anorexia nervosa. Binge eating disorder is characterized by recurrent binge eating episodes during which a person feels a loss of control and marked distress over his or her eating.
Bulimia nervosa is characterized by binge eating followed by a type of behavior that compensates for the binge, such as purging (e.g., vomiting, excessive use of laxatives or diuretics), fasting, or excessive exercise. Unlike anorexia nervosa, people with bulimia can fall within the normal range for their weight. But like people with anorexia, they often fear gaining weight, desperately want to lose weight, and are intensely unhappy with their body size and shape.
Anorexia nervosa is characterized by a significant and persistent reduction in food intake, leading to extremely low body weight. People with this disorder are in a relentless pursuit of thinness. Their perception of body image is disordered, and they have an intense fear of gaining weight.
In the National Comorbidity Survey Replication by the National Institutes of Health, more than half (56.2%) of respondents with anorexia nervosa, 94.5% with bulimia nervosa, and 78.9% with binge eating disorder met the criteria for at least one core mental disorder. Figure 9.10 shows the percentage of males and females surveyed with each type of eating disorder who sought treatment. Not everyone who suffers from eating disorders seeks help, but help is a key factor in a healthy lifetime outcome.
| Anorexia Nervosa (%) | Bulimia Nervosa (%) | Binge-Eating Disorder (%) | |
|---|---|---|---|
| Total |
33.8 |
43.2 |
43.6 |
| Female |
29.8 |
47.0 |
50.8 |
| Male |
50.2 |
29.1 |
28.9 |
Figure 9.10. Lifetime Treatment of Eating Disorders Among U.S. Adults. Females are more likely to seek treatment for bulimia nervosa and binge-eating disorder, although males are more likely to seek treatment for anorexia nervosa.
Weight issues are all around us, not just in the media. Our daily lives are affected by our weight, from fitting into an airplane seat to finding comfortable clothing that expresses our unique sense of style. Even though stigma and discrimination are generally considered a threat to the fundamental values of inclusion and equality in Western societies, (Brownell et al. 2005) weight stigma is frequently propagated and tolerated (Pont et al. 2017). Weight stigma (weight bias, weightism, or weight-based discrimination) describes the societal degradation through negative attitudes or beliefs directed towards a person based on their weight (Puhl and Heuer 2009). Weight stigma is usually expressed through stereotypes, that is, unreasoned judgments about people being lazy or unmotivated, or lacking willpower and discipline (Pont et al. 2017; Puhl and Heuer 2009) These stereotypes may lead to prejudice, including social rejection, unfair treatment, or overt discrimination (Brownell et al. 2005; Pont et al. 2017).
Current research describes weight stigma as a risk factor for a range of emotional and psychological consequences for both girls and women, and boys and men. However, empirical findings regarding gender are inconsistent. While some studies suggest that men are equally often targets of weight stigma and are just as vulnerable as women, (Himmelstein, Puhl, and Quinn 2018a; Himmelstein Puhl and Quinn, 2018b), others report more weight stigma experiences in women than in men, (Sattler et al. 2018; Spahlholz et al. 2016), including in heterosexual relationships, (Carr and Friedman 2006) education, (Crandall 1991), and employment settings (Fikkan and Rothblum 2005). One explanation might be the pervasive ideal of physical attractiveness, which emphasises being thin as central to feminine beauty.
The Body Mass Index (BMI) is the measure of body fat based on height and weight. People with high BMI are above the weight considered healthy by medical professionals. Society can also view people with very low BMI as unhealthy. People who have Anorexia nervosa, for instance, may have such a low BMI that their bodies do not function properly, which may lead to death.
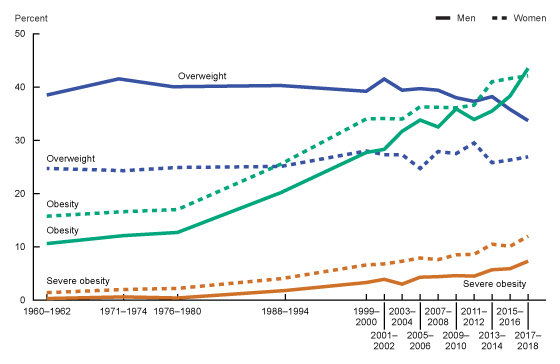
Figure 9.11 is from the 2020 National Center for Health Statistics report on weight in the United States. People who are considered obese have increased greatly in the last few decades.
Figure 9.11 shows that obesity and severe obesity, the most extreme overweight categories, are rising. The report indicates that the rate of obesity is increasing for both men and women. “An estimated 42.5% of U.S. adults aged 20 and over have obesity, including 9.0% with severe obesity” (Fryar, Carroll, and Afful 2020).
9.3.6 Licenses and Attributions for Health
Mortality rate definition is from the Open Education Sociology Dictionary edited by Kenton Bell, which is licensed under CC BY-SA 4.0.
Infant mortality rate definition is from “Infant Mortality” by the CDC, which is in the Public Domain.
“Health” includes some content from “Maternal mortality rate” by the CDC, which is in the Public Domain.
Morbidity definition is “Health in the United States,” OpenStax Sociology 3e by Tonja R. Conerly, Kathleen Holmes, Asha Lal Tamang, which is licensed under CC BY 4.0.
Binge eating disorder, bulimia nervosa, and anorexia nervosa definitions are from “Eating Disorders” by the National Institute of Mental Health, which is in the Public Domain.
Second paragraph in “Access to health based on cis gender, race, and class” is adapted from “Health in the United States,” OpenStax Sociology 3e by Tonja R. Conerly, Kathleen Holmes, Asha Lal Tamang, which is licensed under CC BY 4.0.
First paragraph of “Mental health issue versus physical health issues” from OpenStax Sociology 3e by Tonja R. Conerly, Kathleen Holmes, Asha Lal Tamang, which is licensed under CC BY 4.0.
Second paragraph of “Mental health issue versus physical health issues” from “Gender Disparity in the Wake of the Pandemic: Examining the Increased Mental Health Risks of Substance Use Disorder and Interpersonal Violence for Women” by Karen Perham-Lippman, Merits, MDPI, which is licensed under CC BY 4.0.
First sentence of fifth paragraph of “Unequal Health Outcomes” from OpenStax Sociology 3e by Tonja R. Conerly, Kathleen Holmes, Asha Lal Tamang, which is licensed under CC BY 4.0.
Third, fourth, and fifth paragraphs in “Eating disorders as a gendered health issue” lightly edited, from “Eating Disorders” by the National Institute of Mental Health, which is in the Public Domain.
Seventh and eighth paragraph from “Eating disorders as a gendered health issue” is from “The association between weight stigma and mental health: A meta-analysis” by Christine Emmer, Michael Bosnjak, Jutta Mata, Obesity Reviews is licensed under CC BY 4.0.
Last two sentences of last paragraph in “Access to health based on cis gender, race, and class” is from “Problems of Health Care in the United States,” Social Problems: Continuity and Change, which is licensed under CC BY-NC-SA 3.0.
Figure 9.4. “Medical students and practitioners from across Africa gather at the second regional Medical Students for Choice conference, where they learn best practices around contraceptive use and safe abortion” by Yagazie Emezi/Getty Images, Images of Empowerment is licensed under CC BY-NC 4.0.
Figure 9.5. “Social Determinants of Health” in “Beyond Health Care: The Role of Social Determinants in Promoting Health and Health Equity” by Samantha Artiga, Elizabeth Hinton, Kaiser Family Foundation is licensed under CC BY-NC-ND 4.0.
Figure 9.6. “Life expectancy at birth” in “U.S. State Life Tables, 2020” by Elizabeth Arias, Jiaquan Xu, Betzaida Tejada-Vera, Sherry L. Murphy, and Bingham Bastian, National Vital Statistics Report, the CDC, is in the Public Domain.
Figure 9.7. Photo by Joshua Lanzarini on Unsplash.
Figure 9.8. “Uninsured Rates for the Nonelderly Population by Race and Ethnicity, 2010-2019” in “Health Coverage by Race and Ethnicity, 2010-2019” by Samantha Artiga, Latoya Hill, Kendal Orgera, and Anthony Damico, Kaiser Family Foundation is licensed under CC BY-NC-ND 4.0.
Figure 9. 8 “Health Status, Outcomes, and Behaviors among People of Color Compared to White People” in “Health Status, Outcomes, and Behaviors” by Latoya Hill, Samantha Artiga, and Sweta Haldar, Kaiser Family Foundation is licensed under CC BY-NC-ND 4.0.
Figure 9.10. “Lifetime Treatment of Eating Disorders Among U.S.” Data from “Eating Disorders” by the CDC and National Comorbidity Survey Replication (NCS-R).
Figure 9.11 “Figure. Age-adjusted trends in overweight, obesity, and severe obesity among men and women aged 20–74: United States, 1960–1962 through 2017–2018” by Cheryl D. Fryar, Margaret D. Carroll, and Joseph Afful, National Center for Health Statistics/CDC is in the Public Domain.
All other content in “Health” by Jane Forbes is licensed under CC BY 4.0.

