4 Producing and Profiting From Social Media
Producing and Profiting From Social Media
The Business of Social Media Corporations
If you’ve ever taken a class with me, chances are you’ve heard of the Telecommunications Act of 1996. If you haven’t, or if you need a refresher, you’re in luck! This law is among the most influential pieces of legislation for why media exists in the way it does, including social media, and I’m going to tell you all about it.
The Telecommunications Act of 1996 is a bill that was written with extensive help from media industry lobbyists, passed by Congress, and signed into law by then-President Bill Clinton. The bill essentially deregulated the media industry, lighting caps on the number and types of media companies one corporation could own. So, what that meant was that instead of there being dozens of different media companies, each with their own voice and perspective on key issues important to a community, the most profitable companies succeeded in taking over the market. And while the bill was mostly concerned with traditional media like TV and radio, it has major implications for social media once it entered the media world decades later.
Because of deregulation, social media corporations are also caught up in a system of corporate media ownership, with a few successful social media companies buying up their competitors to form very large near-monopoly corporations that control much of the social media market. For example, Facebook started as a small online program run by Mark Zuckerberg and his college roommates. As Facebook grew, the company was able to maintain a large share of the market by purchasing up-and-coming businesses that threatened to become popular and incorporating those smaller businesses into its ever-expanding portfolio. For example, in 2012, Facebook viewed Instagram as a potential rival, so Facebook purchased Instagram for $1 billion, and later also purchased WhatsApp (a potential rival for Facebook Messenger) for almost $20 billion.

Why would they do this? And why would they pay so much even when apps like Instagram and WhatsApp were actually losing money at the time? Because those apps were popular, especially among young people, and Facebook wanted to make sure that if these apps popular among young people really took over a share of the market that they would still capitalize on that success. It works like this:
- Many of you don’t like Facebook because its full of people in my generation and older, and indeed, it has a reputation of being for your parents and grandparents. So, you download Instagram and post your photos there instead. So do your friends.
- The same happens with Facebook Messenger: You don’t like that platform, but still want to be able to chat with people using encrypted messaging? So, you download WhatsApp instead. WhatsApp is owned by Facebook.
- Facebook doesn’t really care, because they make money whether you use Facebook or Instagram, or whether you use Meta Messenger or WhatsApp. In fact, it might actually be better because you post certain things on one app and certain things on another, so they can reach you and their advertisers twice.
This business model is so successful that Facebook actually had the top FOUR most downloaded apps of the last decade:

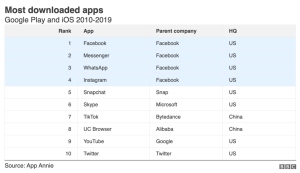
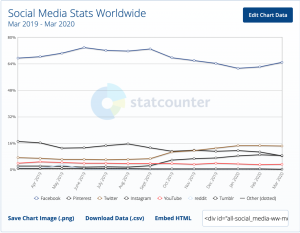
And Facebook and its subsidiary companies accounted for the vast majority of all global social media usage up to the start of the pandemic.
Conglomeration:
One of the goals of companies buying up smaller companies is to built a media umbrella that customers interact with for a number of purposes related to the overall brand. So, for example, Disney owns everything you need to interact with their brand at every level of production, distribution and reception. They own the companies that create ideas for their films, the animation and production studios, the movie distribution companies that send the films out to theaters, they own music recording companies to produce the soundtrack. They also own theme parks and cruises where you can interact with characters, stores where you can buy merchandise, etc. And it isn’t just Disney, they also own the Disney streaming service, all the Marvel stuff, all the Star Wars stuff, etc. Here is a current map of some of their holdings (you can also view the full map of Disney’s holdings here, where you can zoom in to read it better):
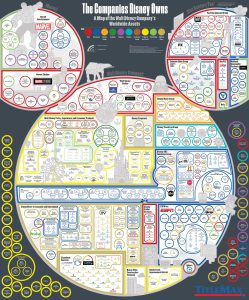
This is called Vertical Integration, which is the idea that a company owns the things you need from start to finish in your brand. From the conception of the idea to the smallest trinket you can buy in the store, they make money at every single level. Everything they do to develop stories, they do with their own companies, so they make money at every step instead of paying another company to do the work for them.
Amazon is an example of a company that engages in Horizontal Integration. Amazon’s goal is not to own every step of the process of making and distributing goods. Instead, Amazon’s goal is to corner the market as THE PLACE you go to for point-of-sale purchases. So, Amazon’s corporation/conglomeration includes owning multiple point of sale companies that were threatening to be competitors.
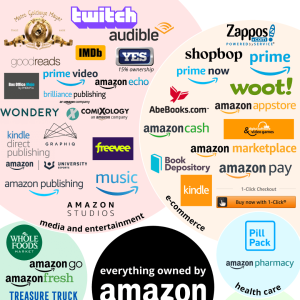
So, for example, when many grocery stores moved their goods online, Amazon bought Whole Foods and made an online store for groceries. They don’t make food. But they do sell it online. When healthcare companies started putting prescription medications online, Amazon bought Pill Pack and made an Amazon Pharmacy so they could be the point-of-sale place you go to order meds. When Zappos became a popular alternative for shoe shopping, Amazon bought Zappos. You get the idea. So, their goal is not to own every part of the market start to finish, as would be the case in vertical integration. Instead, their goal in horizontal integration is to be the biggest online shopping site they can be and to buy up competitors to their online shopping network.
Voice Metrics/Share of Voice
We spend a lot of time on social media. How much exactly? Here are a few charts that highlight just how much time we spend on these platforms:
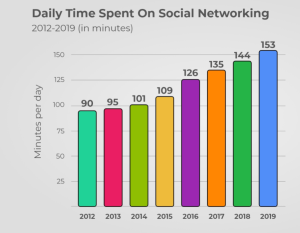
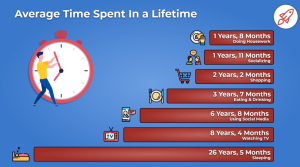
The fact that a considerable percentage of our time and our lives are spent on social media suggests they are valuable to us. But, that also means they are valuable to corporations as well, especially as we increase our time spent on social media and decrease the amount of time we spend watching live television shows (and therefore also less time watching traditional 30-second TV ads during commercial breaks). So, how do we measure the value of these platforms and the ads that appear on them?
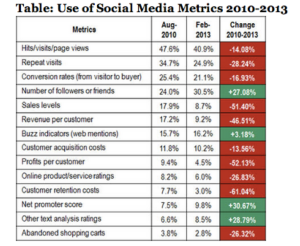
Traditionally, when looking at the value of a company on social media, investors would analyze the same traditional metrics we would use to analyze most businesses: things like sales, revenue per customer, repeat customers, customer retention, etc. Around 2010, coinciding with the rise of social media usage, investors started paying less attention to sales and more attention to VOICE METRICS. Voice metrics are ways of measuring how popular you are on social media, as evidenced by how many people are talking about and “liking” your company. If you look at this chart, you see that investors became less concerned with things like whether you actually purchased things from the company and their actual levels of sales, and paid significantly more attention to how many followers or friends your company has and how often people included your company’s name in text they posted to social media.
Why the shift?
For starters, people started realizing the extent to which social media streamlined and influenced commerce. So, if you looked at which companies were most successful over time, actual sales mattered less and less. The biggest predictors of which companies were successful 12 months down the road weren’t necessarily the companies that had really high sales right now. Instead, the best predictors for which companies would be successful next year were the companies being talked about on social media right then. Social media made it easier to reach more people, reach people who were no longer watching traditional TV ads (especially young people), and made it easier to target you with ads specific to your actual interest.
This brings us to the second point: data mining. We’ll discuss surveillance and data mining in more detail throughout the next three weeks, but in general, data mining is when companies monitor and track everything you do online and sell that information to advertisers so they can better reach you with more tailored content. So, social media sites keep track of what you scroll past, what you stop to read, what you click on and what you don’t, what you share, when you are most likely to go online, when you are most likely to want to read articles and when you are most likely to skim past headlines, what you buy on other sites, what types of things you are likely to abandon in virtual shopping carts and what you’ll buy right away, how long you shop (whether you look hard for deals or whether you buy the first thing you see), etc.
In fact, Facebook knows more about you than the people you are closest to. A few years ago, Facebook did a study with 86,220 volunteers. The study asked the volunteer (for the sake of making this understandable, we’ll call the volunteer Mary) a 100-question personality survey, and then gave the same survey to Mary’s coworkers, friends, family, roommates, and partner and asked those people to answer the way they thought Mary would answer. They then asked a Facebook algorithm the same questions about Mary, giving the algorithm only information about pages and businesses Mary “liked” in the past (for example, Mary liked a particular band, an event page, a business, an article she saw, etc). The findings are rather surprising:
- After inputting 10 things Mary liked, the algorithm was more successful at predicting Mary’s personality than her coworkers.
- After inputting 70 likes, the algorithm was more successful at predicting Mary’s personality than her best friend or roommate.
- After inputting 150 likes, the algorithm was more successful at predicting Mary’s personality than her parents and siblings.
- After inputting 300 likes, the algorithm was more successful at predicting Mary’s personality than per spouse or partner.
So what does this tell us? It tells us that social media algorithms are incredibly good at
- Monitoring our social media usage over time
- Using that information to predict what we will like in the future
- Selling that information to advertisers in ways that earn them a profit
There is an old saying in media: “If you’re not paying for something, you’re not the customer, you’re the product being sold.” What this means is that the apps we download most and spend the most time on are often free. Companies like Facebook are willing to spend many millions of dollars creating free apps for you to download because the real money they make comes from selling your information to advertisers and selling ad space to better reach companies. We get the app for free, because the real customer is the advertiser paying Facebook billions to be part of the tailored ads that show up in your feed.
The ability of social media companies to turn these likes into profit is what makes them so valuable. In fact, many of these companies are valued at dollar amounts far surpassing their actual revenue and cash flow. This contributes to the ATTENTION ECONOMY, or the idea that your attention on social media is what these companies are trying to attract.
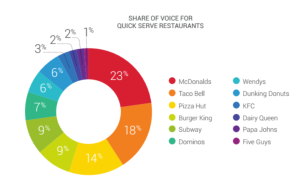
Today social media companies refer to voice metrics as SHARE OF VOICE, which encompasses not just where we devote our attention, but also the share of the social media market individual advertisers occupy. For example, a fast food company might use share of voice metrics to determine how often people talk about their brand on social media versus how often people talk about their competitors. Entire industries are devoted to monitoring this type of information. For example, a company might monitor that exact information, and receive a graph that looks like this:
OR, they might get a similar graph, stating which apps users are most likely to use to talk about their brand, with further breakdowns showing whether what users are saying is positive or negative, like this readout that shows a trending hashtag about bad experiences at a particular coffeeshop.
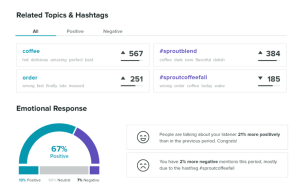
Share of Voice metrics can include measures such as: https://www.brandwatch.com/blog/social-media-metrics-measure-success
- Social media metrics: followers, number of people who saw your content, etc.
- Engagement metrics: shares, retweets, mentions, likes, etc.
- Channel metrics: how did people find you (they searched on their own, they followed a paid ad, they clicked on a social media link shared by someone else, via email marketing, etc)
- Consumption metrics: page views, how much time people spent on your page, how many people opened the email you sent, how many people followed the links in your email, etc.
- Conversion metrics: how many people did the thing you were hoping they would do when you advertised (clicked the link, downloaded the content, etc.)
Share of Voice metrics can be used to:
- Do competitive analysis on other brands in your market to better find your unique niche
- Better segment your target audience so you reach the consumers most likely to engage with your brand
- Evaluate the success of your own brand campaigns (if you spend money on a campaign but see no increase in people talking about your brand, you know it was not successful)
- Get data to help improve campaigns in the future

