
4.3 Research Methods
Kimberly Puttman
In the video you saw in Figure 4.1, Suzanne Simard describes the amazing science she does when she researches how trees talk to each other. The methods she uses, with the possible exception of bringing bear spray, don’t work very well when you study people. Instead, social scientists use a variety of methods that allow them to explain and predict the social world. These research methods define how we do social science.
In this section, we examine some of the most common research methods. Research methods are often grouped into two categories: quantitative research, data collected in numerical form that can be counted and analyzed using statistics, and qualitative research, non-numerical, descriptive data that is often subjective and based on what is experienced in a natural setting. These methods seem contradictory, but some of the strongest scientific studies combine both approaches. New research methods go beyond the two categories, exploring international and Indigenous knowledge or doing research for the purpose of taking action.
4.3.1 Surveys
4.9
Figure 4.9. The US Census is an example of a survey. Because the questions are similar, we can compare changes in the US population. However, the US Census changes with the times. Recently an ethnicity question related to being Hispanic or Latino was added. And even more recently, people can pick multiple races to describe themselves. How might changes in census racial categories change how we understand the social world?
Do you strongly agree? Agree? Neither agree or disagree? Disagree? Strongly disagree? If you’ve heard this before, you’ve probably completed your fair share of surveys. At some point, most people in the United States respond to some type of survey. The 2020 US Census is an excellent example of a large-scale survey intended to gather sociological data. Since 1790, the United States has conducted a survey of six questions to collect demographic data of the residents who live there.
As a research method, a survey collects data from subjects who respond to questions about behaviors and opinions, often in a questionnaire or an interview. Surveys are one of the most widely used scientific research methods. The standard survey format allows individuals a level of anonymity in which they can express personal ideas.
Not all surveys are considered sociological research. Many surveys people commonly encounter focus on identifying marketing needs and strategies rather than testing a hypothesis or contributing to social science knowledge. Questions such as, “How many hot dogs do you eat in a month?” or “Were the staff helpful?” are not usually designed as scientific research. Surveys gather different types of information from people. While surveys are not great at capturing the ways people really behave in social situations, they are a great method for discovering how people feel, think, and act—or at least how they say they feel, think, and act. Surveys can track preferences for presidential candidates or report individual behaviors (such as sleeping, driving, or texting habits) or information such as employment status, income, and education levels.
4.3.2 Experiments

4.10. In this experiment, researchers investigated whether foreign names on the application would lead to discrimination. If the application was from Brian instead of Boleslav, the person was twice as likely to get a job interview. What other indicators of social location might influence hiring?
One way researchers test social theories is by conducting an experiment, meaning the researcher investigates relationships to test a hypothesis. This approach closely resembles the scientific method. There are two main types of experiments: lab-based experiments and natural or field experiments. In a lab setting, the research can be controlled so that data can be recorded in a limited amount of time. In a natural or field-based experiment, the time it takes to gather the data cannot be controlled but the information might be considered more accurate since it was collected without interference or intervention by the researcher. Field-based experiments are often used to evaluate interventions in educational settings and health (Baldassarri and Abascal 2017).
Typically, the sociologist selects a set of people with similar characteristics, such as age, class, race, or education. Those people are divided into two groups. One is the experimental group and the other is the control group. The experimental group is exposed to the independent variable(s) and the control group is not. To test the benefits of tutoring, for example, the sociologist might provide tutoring to the experimental group of students but not to the control group. Then both groups would be tested for differences in performance to see if tutoring affected the experimental group of students. In a case like this, the researcher would not want to jeopardize the accomplishments of either group of students, so the setting would be somewhat artificial. The test would not be for a grade reflected on their permanent record as a student, for example.
4.3.3 Secondary Data Analysis
While sociologists often engage in original research studies, they also contribute knowledge to the discipline through secondary data analysis. Secondary data does not result from firsthand research collected from primary sources. Instead, secondary data uses data collected by other researchers or data collected by an agency or organization. Sociologists might study works written by historians, economists, teachers, or early sociologists. They might search through periodicals, newspapers, magazines, or organizational data from any historical period.
4.3.4 Participant Observation
Participant observation refers to a style of research where researchers join people and participate in a group’s routine activities for the purpose of observing them within that context. This method lets researchers experience a specific aspect of social life. A researcher might go to great lengths to get a firsthand look into a trend, institution, or behavior. For instance, a researcher might work as a waitress in a diner, experience homelessness for several weeks, or ride along with police officers as they patrol their regular beat. Often, these researchers try to blend in seamlessly with the population they study, and they may not disclose their true identity or purpose if they feel it would compromise the results of their research.
At the beginning of a field study, researchers might have a question: “What really goes on in the kitchen of the most popular diner on campus?” or “What is it like to be houseless?” Participant observation is a useful method if the researcher wants to explore a certain environment from the inside. The ethnographer will be alert and open-minded to whatever happens, recording all observations accurately. Soon, as patterns emerge, questions will become more specific, and the researcher will be able to either make connections to existing theories or develop new theories based on their observations. This approach will guide the researcher in analyzing data and generating results.
4.3.5 In-depth interviews
Interviews, sometimes referred to as in-depth interviews, are one-on-one conversations with participants designed to gather information about a particular topic. Interviews can take a long time to complete, but they can produce very rich data. In fact, in an interview, a respondent might say something the researcher had not previously considered, which can help focus the research project. Researchers have to be careful not to use leading questions. You want to avoid leading the respondent into certain answers by asking questions like, “You really like eating vegetables, don’t you?” Instead, researchers should allow the respondent to answer freely by asking questions like, “How do you feel about eating vegetables?”
4.3.6 International Research
International research is conducted outside of the researcher’s own immediate geography and society. This work carries additional challenges, considering that researchers often work in regions and cultures different from their own. Researchers need to make special considerations to counter their biases, navigate linguistic challenges, and ensure the best cross-cultural understanding possible. Students at Oxford University’s Masters in Development Studies offer a map and descriptions of field projects around the world. What are some interesting projects that stand out to you?
For example, in 2021, Jörg Friedrichs at Oxford published his research on Muslim hate crimes in areas of North England where Islam is the majority religion. He studied police data on racial and religious hate crimes in two districts to look for patterns related to the crimes. He related those patterns to the wider context of community relations between Muslims and other groups. He presented his research to hate crime practitioners in police, local government, and civil society (Friedrichs 2021).
4.3.7 Unpacking Oppression, Measuring Justice
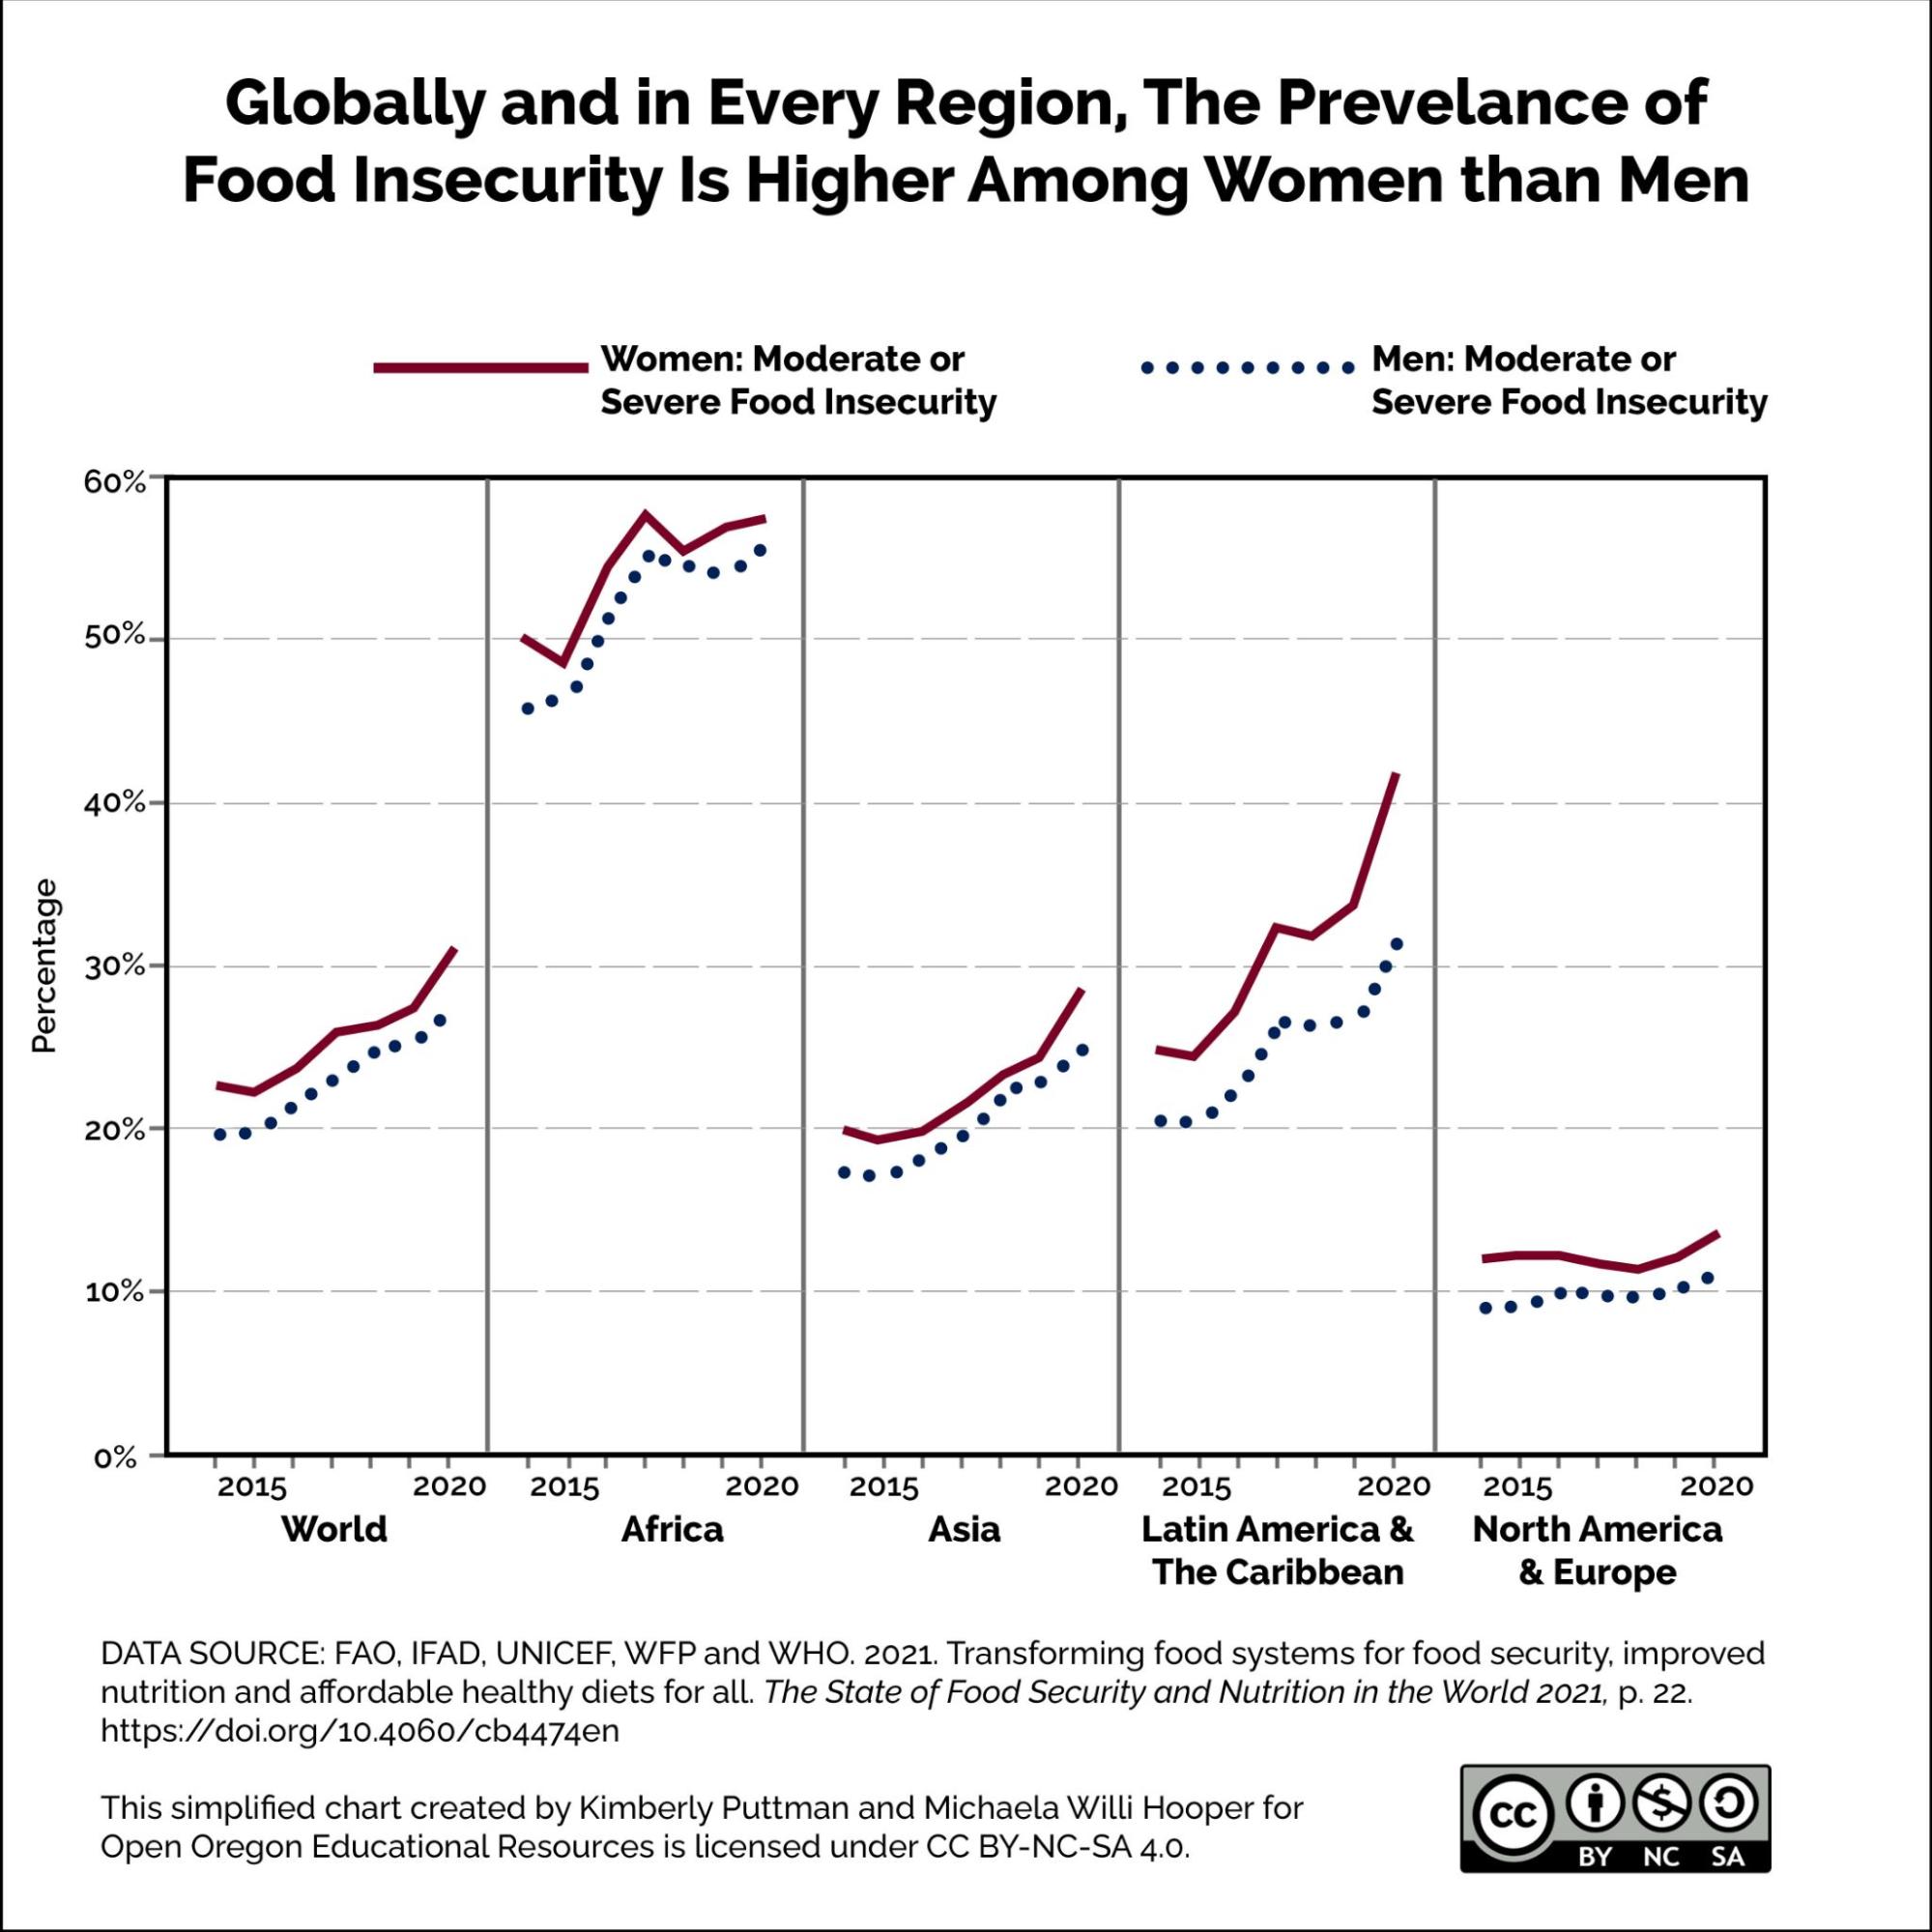
Figure 4.11. This chart shows that women experience more food insecurity than men in every region of the world. In Africa, more than half of all people experience hunger. This food insecurity rate has also increased worldwide between 2015 and 2020. How do you think COVID-19 might have impacted world hunger? Image Description
Social scientists love statistics. They like to examine data using numbers, charts and graphs. In this kind of analysis, they can see patterns in human behavior and changes over time. However, as a new sociologist, how can you make sense of this complicated information?
It’s your turn to unpack oppression and measure justice:
Let’s figure this out using two examples related to measuring hunger.
As you look at the graph in Figure 4.11, what do you see?
You might start by examining the graph’s title, the x and y-axis, and the legend. You notice that the title is “Globally and in every region the prevalence of food insecurity is higher among women than men.” Even by reading the title, you know that you are examining the relationship between hunger and gender worldwide.
Then, you look at the x and y-axis. The x-axis, the horizontal line at the bottom, has two labels: geographic region and time. It is unusual to have more than one measure on an axis, but in this case, we can see the change in the percentage of people hungry between 2015 and 2020 in each region of the planet. The y-axis, the vertical line on the left, is the percentage or percent of people who experience food insecurity.
We then look at the chart’s legend and discover that the dotted line represents men, and the solid line represents women.
With this grounding in place, we examine the lines on the graph. We can see that, indeed, women as a group experience more food insecurity than men in every region of the word. We notice that Africa has the highest rate of food insecurity overall. We also see that food insecurity is generally increasing over time.
The last thing we might want to check is the credibility of the data. We want to ask whether the data comes from a trustworthy source. We want to know the research methodology used to collect the data.
In this case, the data was collected by organizations related to the United Nations, a reputable organization. If we open the study, The State of Food Security and Nutrition in the World 2021, we find that the researchers used survey data from the Gallup World Poll, a worldwide survey, to collect much of the information in this report. If we wanted to dig deeper, we could find out how the Gallup researchers designed and administered their survey.
Static charts and graphs can tell us a lot, but sophisticated data analytics can now show our data in three dimensions, allowing us to see changes over time, for example, much more easily.
The site Our World In Data provides reputable social science data, particularly showing changes over time. If we look at the number of people in the world who are undernourished, we can see that the rate of hunger decreased over time until it began to rise again in 2020. Part of the cause of this increase is the global COVID-19 pandemic. As you click on the slider bar and change the countries on the chart, you can make comparisons over time and space. When you see a pattern in the data, you can dig deeper to find some of the causes and consequences of the change.
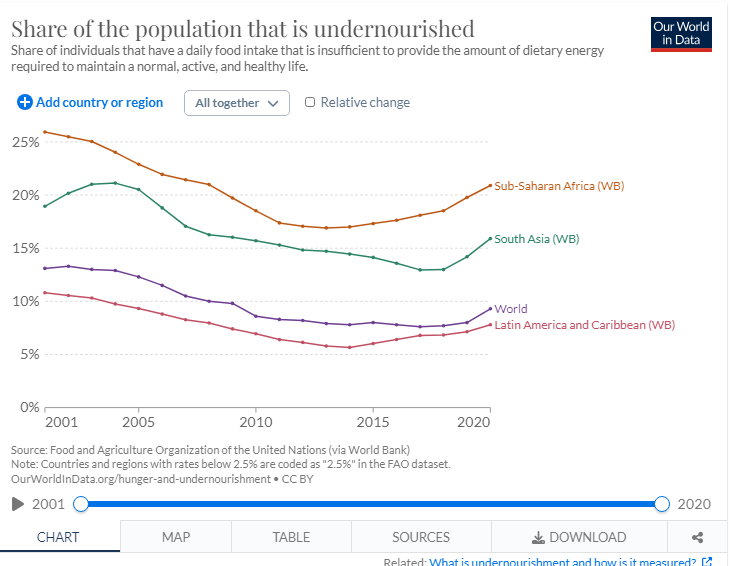
Figure 4.12. The number of undernourished people between 2001 and 2020 by region, from Our World In Data. Please click on the link to use the data from Our World in Data directly. Image description.
Activity
- Go to Our World In Data.
- Find a chart or graph related to a social problem that interests you. You could examine hunger, inequality in education, global warming, or another problem, for example.
- Describe the data in the chart or graph using the characteristics from our first example. What problem does the data describe?
- Who collected the data?
- How did they collect the data? You may need to go outside the Our World in Data site to learn more.
- Compare two countries or two time periods from your graph. Is the problem getting worse, better, more unequal, or staying the same?
- What reasons does Our World In Data provide that explain why the change is occurring?
- What can you conclude? What further questions do you have?
4.3.8 Licenses and Attributions for Research Methods
Open Content, Original
“Research Methods” by Kimberly Puttman is licensed under CC BY 4.0.
Figure 4.11. “Globally and in every region, the prevalence of food insecurity is higher among women than men” by Kimberly Puttman and Michaela Willi Hooper, Open Oregon Educational Resources, is licensed under CC BY-NC-SA 4.0.
Open Content, Shared Previously
“Qualitative Research” and “Quantitative Research” definitions from Introduction to Sociology 3e by Tanja R. Conerly, Kathleen Holmes, and Asha Lal Tamang, Openstax is licensed under CC BY 4.0.
Figure 4.9. “1940 US Census Poster” by the United States Census Bureau is in the Public Domain.
Figure 4.12. “Number of people who are undernourished” by Our World in Data is licensed under CC BY 4.0.
All Rights Reserved Content
Figure 4.10. “Image of Boleslav Makarey Experiment” from Seven Examples of Field Experiments for Sociology © Revise Sociology is included under fair use.