
6.3 Houselessness, Housing Insecurity, and Social Location
Nora Karena and Kimberly Puttman
People are unhoused because they do not have access to adequate, affordable housing. For every 100 extremely low-income renters, there are just 31 affordable units (National Coalition for the Homeless 2020). People who are housing insecure are at risk of losing their housing because they lack adequate resources to meet basic needs.
Social location, where identity and power connect, such as class, race, gender, age, and physical ability, can impact housing stability. In this section, we’ll apply theories of social stratification and intersectionality to the problem of houselessness and housing insecurity. Let’s start by exploring the sociological concept of class.
6.3.1 What is Social Stratification?
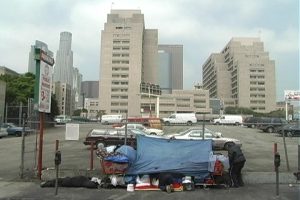
Figure 6.9. This picture demonstrates stratification. In the front, we can see the tarps and belongings of houseless people. In the background, we see the skyscrapers of a modern wealthy economy. Where do you see stratification at work in your own life?
Sociologists group people according to how much they have. However, sociologists consider more than money in their definition. Instead, they define stratification as a socioeconomic system that divides society’s members into categories ranking from high to low based on things like wealth, power, and prestige. Systems of stratification can be as extreme as slavery or apartheid. They can be as long-lasting as caste. Or they can be as common as class, a group that shares a common social status based on factors like wealth, income, education, and occupation.
As you might remember from Chapter 5, wealth includes anything you own—your house, your car, and perhaps your inheritance from your great-grandmother. Income is the money a person earns from work or investments. Income may include your paycheck or royalties from the book that you wrote. Another term for this combination of factors is socioeconomic status (SES). Socioeconomic status is an individual’s level of wealth, power, and prestige.
Karl Marx, the German philosopher introduced in Chapter 3, focused on ownership of wealth or businesses to define class. In his model, workers who own nothing except the clothes on their backs would always conflict with the rich, those who owned businesses and property. Max Weber, another German sociologist from Chapter 3, added ideas of skill status and power to the concept of class.
6.3.2 Unpacking Oppression, Equalizing Justice: Social Class
The chart in Figure 6.10 shows one model of class in the United States, comparing the educations, occupations, income, housing status, and percentage of population for each social class. Although sociologists don’t always agree on the names of the classes or where the boundaries are, we can begin to see how social stratification itself changes people’s life chances. For example, people in the capitalist class, who are only about 1% of the total population, not only have more money, but more access to prestigious education and jobs. These connections help them maintain their wealth and power.
On the other hand, people of the lower class experience poverty. Poverty is the state of lacking the material and social resources an individual requires to live a healthy life. In this class, people are often housing insecure or houseless. They often go hungry and can’t access medical care. Social justice advocates often argue that stabilizing a person’s housing is the first thing that should happen when someone is houseless. This stability supports people in addressing other concerns such as partner violence or chronic health conditions. We’ll talk more about Housing First when we explore housing and social justice later in the chapter.
| Social Class | Percent of Population | Household Income | Education | Occupation | Housing |
|---|---|---|---|---|---|
| Capitalist | 1% | $650,000+ (often inherited) | Elite university, private tutoring | Investors, heirs, and executives | Own multiple personal homes and others’ homes; concentrated in large cities |
| Upper class | 9% | $200,000- $650,000 | Prestigious university | Executives, professionals,and investors | Own a home and a vacation home |
| Upper middle class | 8% | $150,000- $200,000 | College, university, or advanced degree | Professionals and upper managers | Own at least one nice home |
| Middle class | 27% | $75,000- $149,000 | High school, some trade school or apprentice- ship | Lower managers, supervisors, trades, farmers | Depending on race may own or rent |
| Lower middle class | 17% | $50,000- $75,000 | High school | Factory workers | Rent |
| Working class | 20% | $25,000- $49,000 | Some high school | Service workers, retail or tourist economy workers | Rent, but housing insecure |
| Lower class / Poverty | 18% | Under $25,000 | Less than high school | Unemployed, disabled, or receiving other government assistance | Houseless or housing insecure |
Figure 6.10. US Social Class Structure. 2020. This infographic shows the characteristics of each social class in the United States, and the percent of each class in the United States population. Do you know anyone who has changed their social class?
In addition, the middle class in the United States is slowly shrinking, as shown in the chart in Figure 6.11. The people in upper-income households are earning significantly more. More people are becoming downwardly mobile, moving into the lower class. If you would like more details on this transition, you can explore this report from Pew Research: “How the American Middle Class Has Changed in the Past Five Decades.”

Figure 6.11. Middle-class income share has plummeted. In 1970, middle-income households made 62% of the US income. By 2020, their share fell to 42%. How do you think this might impact housing stability? Image Description
Wealth inequality in the US is only growing. According to Robin DiAngelo, “More and more wealth is being concentrated into fewer and fewer hands. The US has the highest level of income inequality among G7 countries. The wealth gap between America’s richest and poorest families more than doubled from 1980 to 2016” (DiAngelo 2021:156).
One of the ways that we see this inequality affecting housing is the impact of the increase in vacation rentals. While Airbnb, Flipkey, and other vacation rental and home share options may increase the number of inexpensive places to stay in an area, they reduce the number of long term rental units. They also tend to increase the rental prices, decreasing the supply of affordable housing. Wealthy people benefit from these options because they make more rental income on properties they own. People who most need affordable housing are pushed out of the rental markets because they can’t afford to stay (Barron, Kung, and Proserpio 2020, Lee 2016).
Now it’s your turn to unpack oppression and stabilize justice:
How are class and housing related in your community? Do you have enough affordable housing to go around? Sociologists often use multiple sources of data to understand patterns of social change. For this exercise, we’ll use three sources to complete a worksheet (make a copy when prompted).
- Go to US Census Quick Facts. You can type in your zip code, county, or state. Please write down the total population, number of housing units, gross rent, and number of households, among other information.
- What percent of people in your area live in poverty or are income limited? Now go to Alice in the Crosscurrents. The final page of this report has percentages of people in poverty and percent of people who are income limited by state. How does this number compare to the census number for people in poverty?
- How much can people in poverty or income limited people afford to pay in rent? The answer for Oregon, according to Alice, is $651 for a single person and $836 for a family of four (United for Alice 2023).
- What is the median rental cost in your area according to the Census Bureau? How does this compare to data in the Zillow Market Trends database?
- Finally, compare your numbers. What are the differences between number of people in poverty, amount of affordable housing, availability of sufficient money to pay for housing, and cost of housing. Most often there is a large gap between rental prices, rental availability and income.
- How might the difference between income and availability create a housing crisis (or not) in your area? Ideally, people should spend no more than 30% of their income on housing. What have you learned about housing stability in your community?
6.3.3 Social Class and Housing
As you might expect, communities with high poverty rates tend to have high rates of unhoused people. Housing stability is a prerequisite for class mobility (Ramakrishnan et al. 2021). Correlations between social location and housing stability reveal some ways social mobility can be limited by race, gender, and age. Homeownership is also a milestone for upward mobility, so long as the homeowner is not cost burdened. Housing is generally a household’s largest expense whether we rent or own. For people who own, though, their house payments become an investment, possibly generating more wealth over time.
6.3.4 Race and Ethnicity
Homeless Count by Race
| Race | Total Number | Percent |
|---|---|---|
| American Indian, Alaska Native, or Indigenous | 15,491 | 3.7% |
| Asian or Asian American | 6,559 | 1.6% |
| Black, African American, or African | 137,638 | 32.7% |
| Native Hawaiian or Pacific Islander | 6,429 | 1.5% |
| White | 230,839 | 54.8% |
| Multiple Races | 24,458 | 5.8% |
Homeless Count by Ethnicity
| Ethnicity | Total Number | Percent |
|---|---|---|
| Non-Hispanic/Non-Latin(a)(o)(x) | 328,799 | 78.0% |
| Hispanic/Latin(a)(o)(x) | 92,581 | 22.0% |
Figures 6.12. National Point In Time Homeless Count By Race and Ethnicity, 2022 Most homeless people are White, but People of Color are often disproportionately represented. What does this mean?
In 2022, the nationwide Point-in-Time Homeless Count identified 421,392 people who were unhoused. Of these people, 230,839 were White. White people make up the majority of houseless people.
However, Black people represent 13% of the total US population, representing over 30% of the unhoused population. This comparison indicates disproportionality, which is the overrepresentation or underrepresentation of a racial or ethnic group compared with its percentage in the total population (Child Welfare Information Gateway 2021). Black people are disproportionately houseless. Native American and Native Alaskan, and certain groups of people who are Native Hawaiian or Pacific Islanders also experience disproportionate rates of houselessness and housing insecurity.
The story for Latinx people is a bit different. Black and Hispanic people in the United States share similar risk factors for houselessness. However, Hispanic people experience lower rates of houselessness (Conroy and Heer 2003). Some researchers argue that Hispanic people have strong social networks—ie, they can live with family. However, when Conroy and Heer tested this theory in Los Angeles, they found that houselessness for Latinx people was undercounted because they were more likely to live in abandoned buildings rather than using shelters or churches where they might be counted. In more recent research in LA County, Chinchilla finds this to be true. She also adds that Latinos were less likely to engage in housing services. They were also more likely to live in overcrowded households (Chinchilla 2019).
This picture is changing over time. Nationwide, the 2022 Point In Time count shows that rates of houselessness for Hispanic/Latino people have increased by 7.6 percent. The causes of this increase are complex. However, part of this increase may be due to the impacts of COVID-19. Because Hispanic/Latino people are more likely to be seasonal or temporary workers, they have less access to COVID-19 relief funds. Therefore, they were more likely to be evicted (Chinchilla, Moses, and Visotzky 2023).
Whenever a social problem impacts members of a specific race at a higher rate than the general population, we can say that racial inequity exists. Ibram X. Kendi asserts that any policies that result in racial inequity and ideas that justify or excuse racial inequity are racist. In the upcoming section, Creating Under-Resourced Communities, we will look closer at racist housing policies and ideas behind the history of displacement and exclusion that creates and sustains these racial inequities. In the upcoming section, Housing Stability is Social Justice, we will look at how antiracist policies are essential to ending houselessness and housing insecurity in the US
6.3.5 Gender and Houselessness

Figure 6.13. Who is likely to be houseless? Most houseless people are men, but LGBTQIA+ are disproportionately likely to be houseless. Why might this be true?
70% of people who are unhoused identify as men (National Alliance to End Homelessness 2021). Most of these men are in their 50’s and 60’s. They meet the definition of chronically homeless. In 2021, in Los Angeles County, California, 83% of the 1800 unhoused people who died were men. Most of those deaths were classified as preventable (Dolak 2022).
Women have lower rates of houselessness overall but are more likely to face housing insecurity. They are more likely than men to be unemployed and renters. This increases their risk of becoming severely cost burdened by housing (Zillow 2020).
People in families with children make up 30 percent of the homeless population, and most unhoused single parents are women. Unaccompanied youth (under age 25) account for another 30% of unhoused people. 40% of unaccompanied, unhoused youth identify as LGBTQIA+. The long-term impacts for youth who are unhoused include significantly higher rates of emotional, behavioral, and immediate and long-term health problems, along with increased risks for substance use and suicide (Substance Abuse and Mental Health Administration 2022). They have numerous academic difficulties, including below-grade level reading, high rate of learning disabilities, poor school attendance, and failure to advance to the next grade or graduate. Four out of five children experiencing houselessness have been exposed to at least one serious violent event by age 12.
Socially constructed ideas of normal or acceptable identities hinder many people from accessing shelter, housing, and many other services. Specifically, in the case of houseless shelters, transgender women may be refused admittance by the women’s shelter and are at risk of violence at the men’s shelter (National Center for Transgender Equality 2019).
6.3.6 Licenses and Attributions for Houselessness, Housing Insecurity and Social Location
Open Content, Original
“Houselessness, Housing Insecurity and Social Location” by Nora Karena and Kimberly Puttman is licensed under CC BY 4.0.
Figure 6.10. “US Social Class Structure. 2020” by Kimberly Puttman is licensed under CC BY 4.0. Data sources: “Household Income Distribution in the US Visualized as 100 Homes” and “Mapped: How Much Does it Take to be the Top 1% in Each US State?” from the Visual Capitalist, Bloomberg, South China Morning Post, The New York Times, and the USDA.
Open Content, Shared Previously
“Class,” “Income,” “Socioeconomic Status,” and “Stratification” definitions from Introduction to Sociology 3e by Tonja R. Conerly, Kathleen Holmes, Asha Lal Tamang, Openstax is licensed under CC BY 4.0.
“Poverty” definition from the Open Education Sociological Dictionary edited by Kenton Bell is licensed under CC BY-SA 4.0.
Figure 6.9. “Photo” by Alan Taylor is licensed under CC BY-2.0.
Figures 6.12. “National Point In Time Homeless Count By Race and Ethnicity” from “The 2022 Annual Homelessness Assessment Report (AHAR) to Congress” by the US Department of Housing and Human Development is in the Public Domain.
Figure 6.13. “Photo” by Chewy is licensed under the Unsplash License.
All Rights Reserved Content
Figure 6.11. “Share of aggregate income heldby U.S middle class has plunged since 1970” from How the American middle class has changed in the past five decades © Pew Research Center, Washington, D.C. is licensed under the Center’s Terms of Use.