
3.5 Lived Experiences in Stratified Society
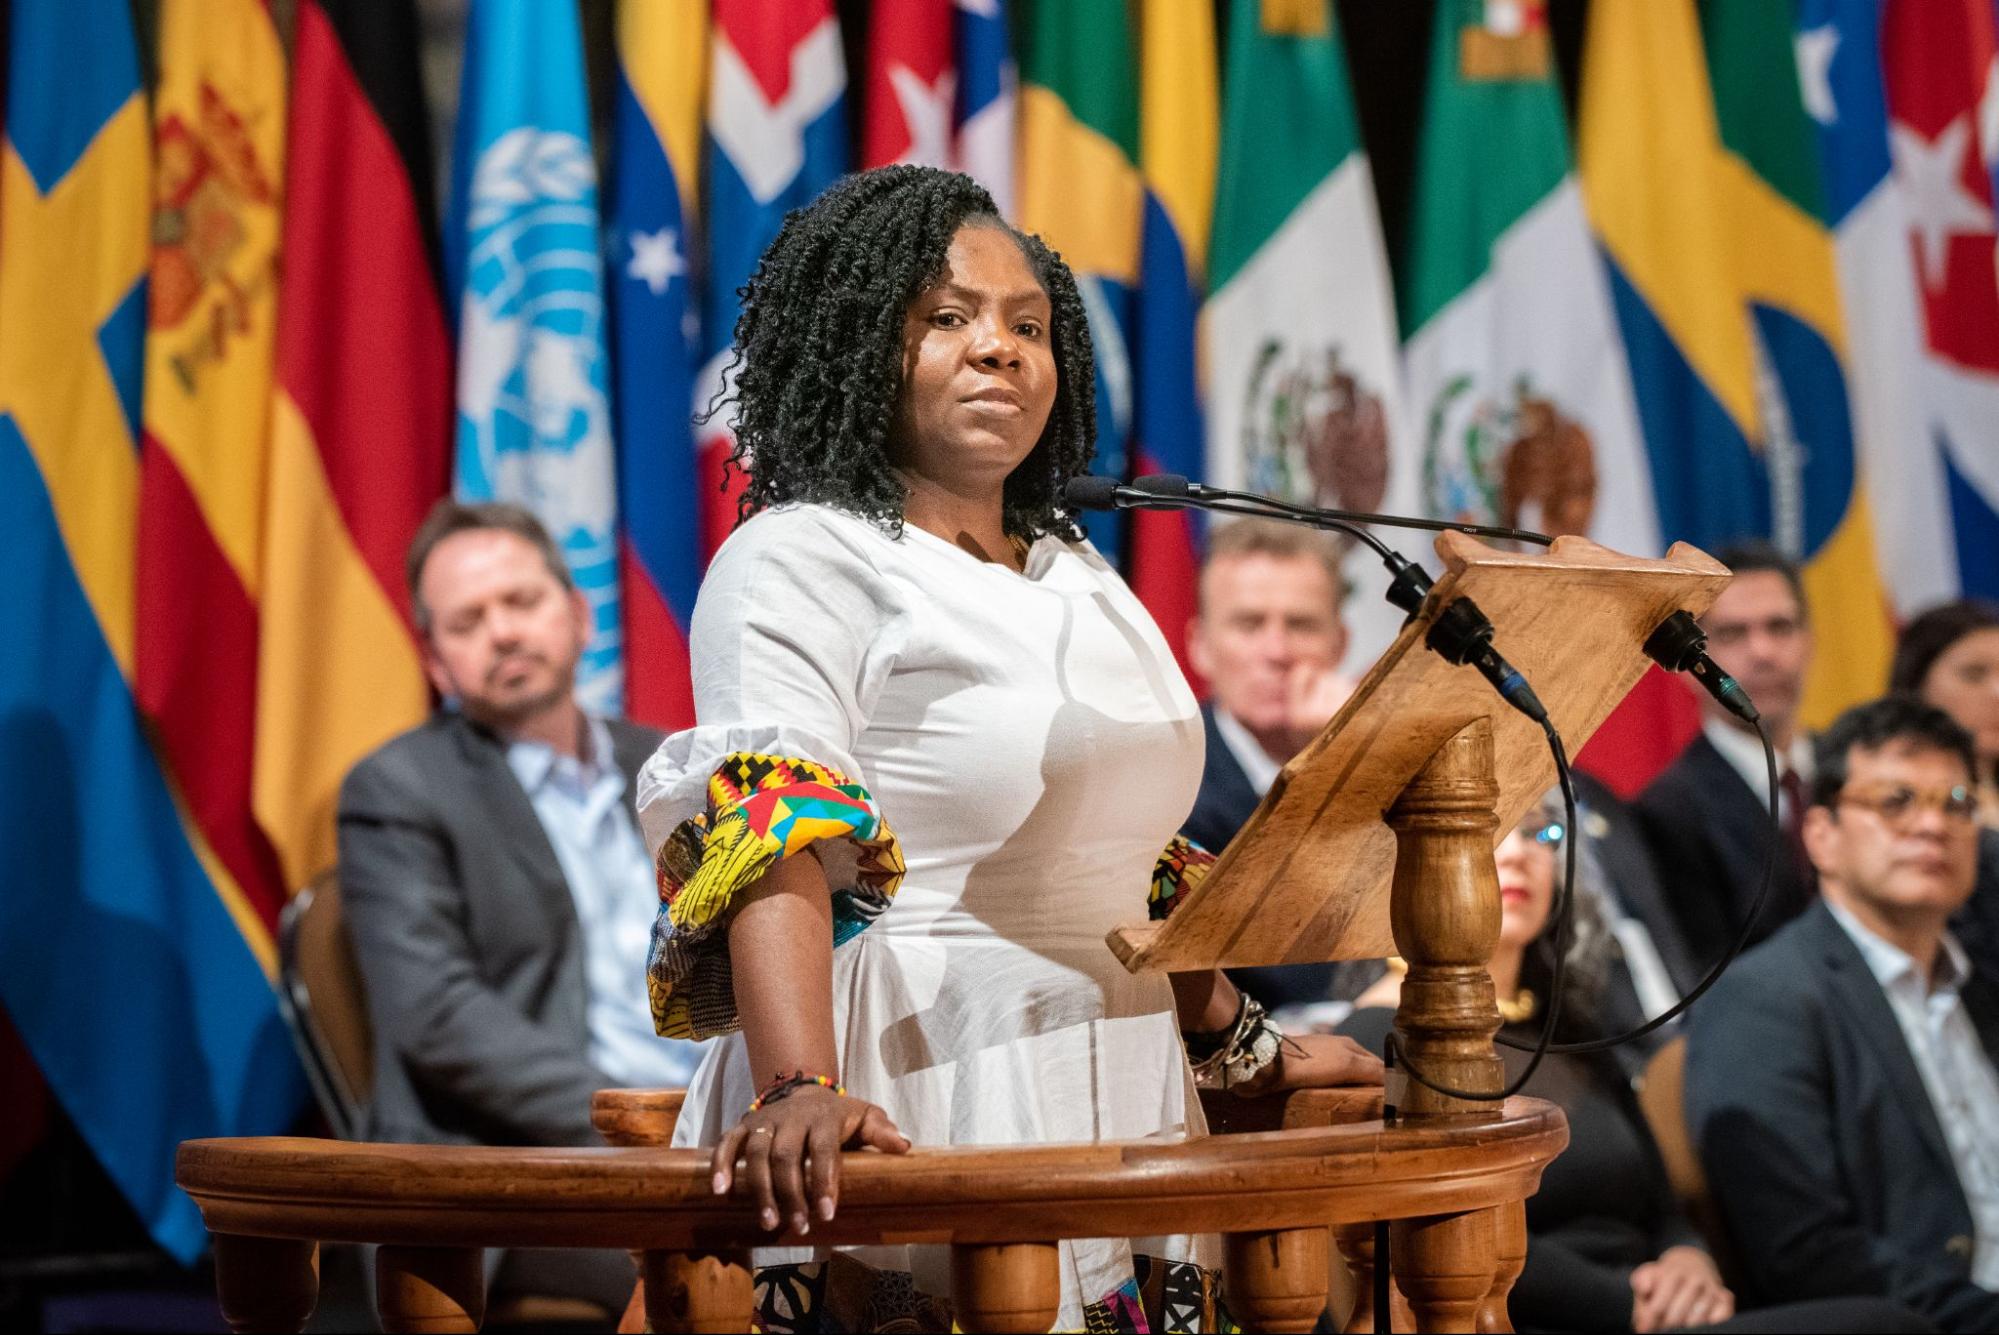
During her bid for vice presidency of Colombia, Francia Márquez campaigned for changes to structural racism in the country (figure 3.21). She has firsthand knowledge of racial violence and discrimination. Márquez is from a poor community that suffered the effects of illegal gold mining that tainted an important waterway for fishing and drinking water. She organized a 22-day protest on the streets, after which the Colombian government agreed to stem illegal mining. After this work, Márquez became a target of organized crime, with at least one serious attempt at her life.
During her campaign, Márquez made a couple of announcements relevant to our study of social location:
The Colombian state does not invest in social projects. Their idea of economic development is to extract ore and territories from ethnic communities. This move is a sheer example of structural racism, and every time a social leader’s voice or mine is lifted up to demand rights enshrined in the Constitution, then we end up being military targets by armed groups in our territory, particularly right-wing paramilitaries (Valencia 2024).
There is a challenge in the face of structural racism: the full guarantee of the political participation of ethnic, Indigenous, and Black people (Szalkowicz 2022).
Márquez’s story, and her proclamations as a candidate, describe the significant hurdles that Indigenous Peoples, people of color, and their supporters overcome to address oppression, such as structural racism. It’s also a story of how social identity can be a powerful unifier against oppression. Let’s turn back to the United States and look closer at the ways structural inequity exists in the institutions that provide housing and schools, along with a creative response.
The Segregation of Housing and Education
For decades, people in power in the United States have limited both housing and educational access for people of color. For example, during the postwar housing boom of the 1940s and 1950s, the GI Bill provided low-interest home loans to support returning veterans. However, as veterans of color applied to participate, they found they were widely denied.
Because lenders discriminated against Black families in a pattern, and within government and economic systems, it was a very damaging example of structural racism. Their discrimination resulted in perpetuating housing segregation, the physical separation of two groups, in residences, the workplace, and social functions.
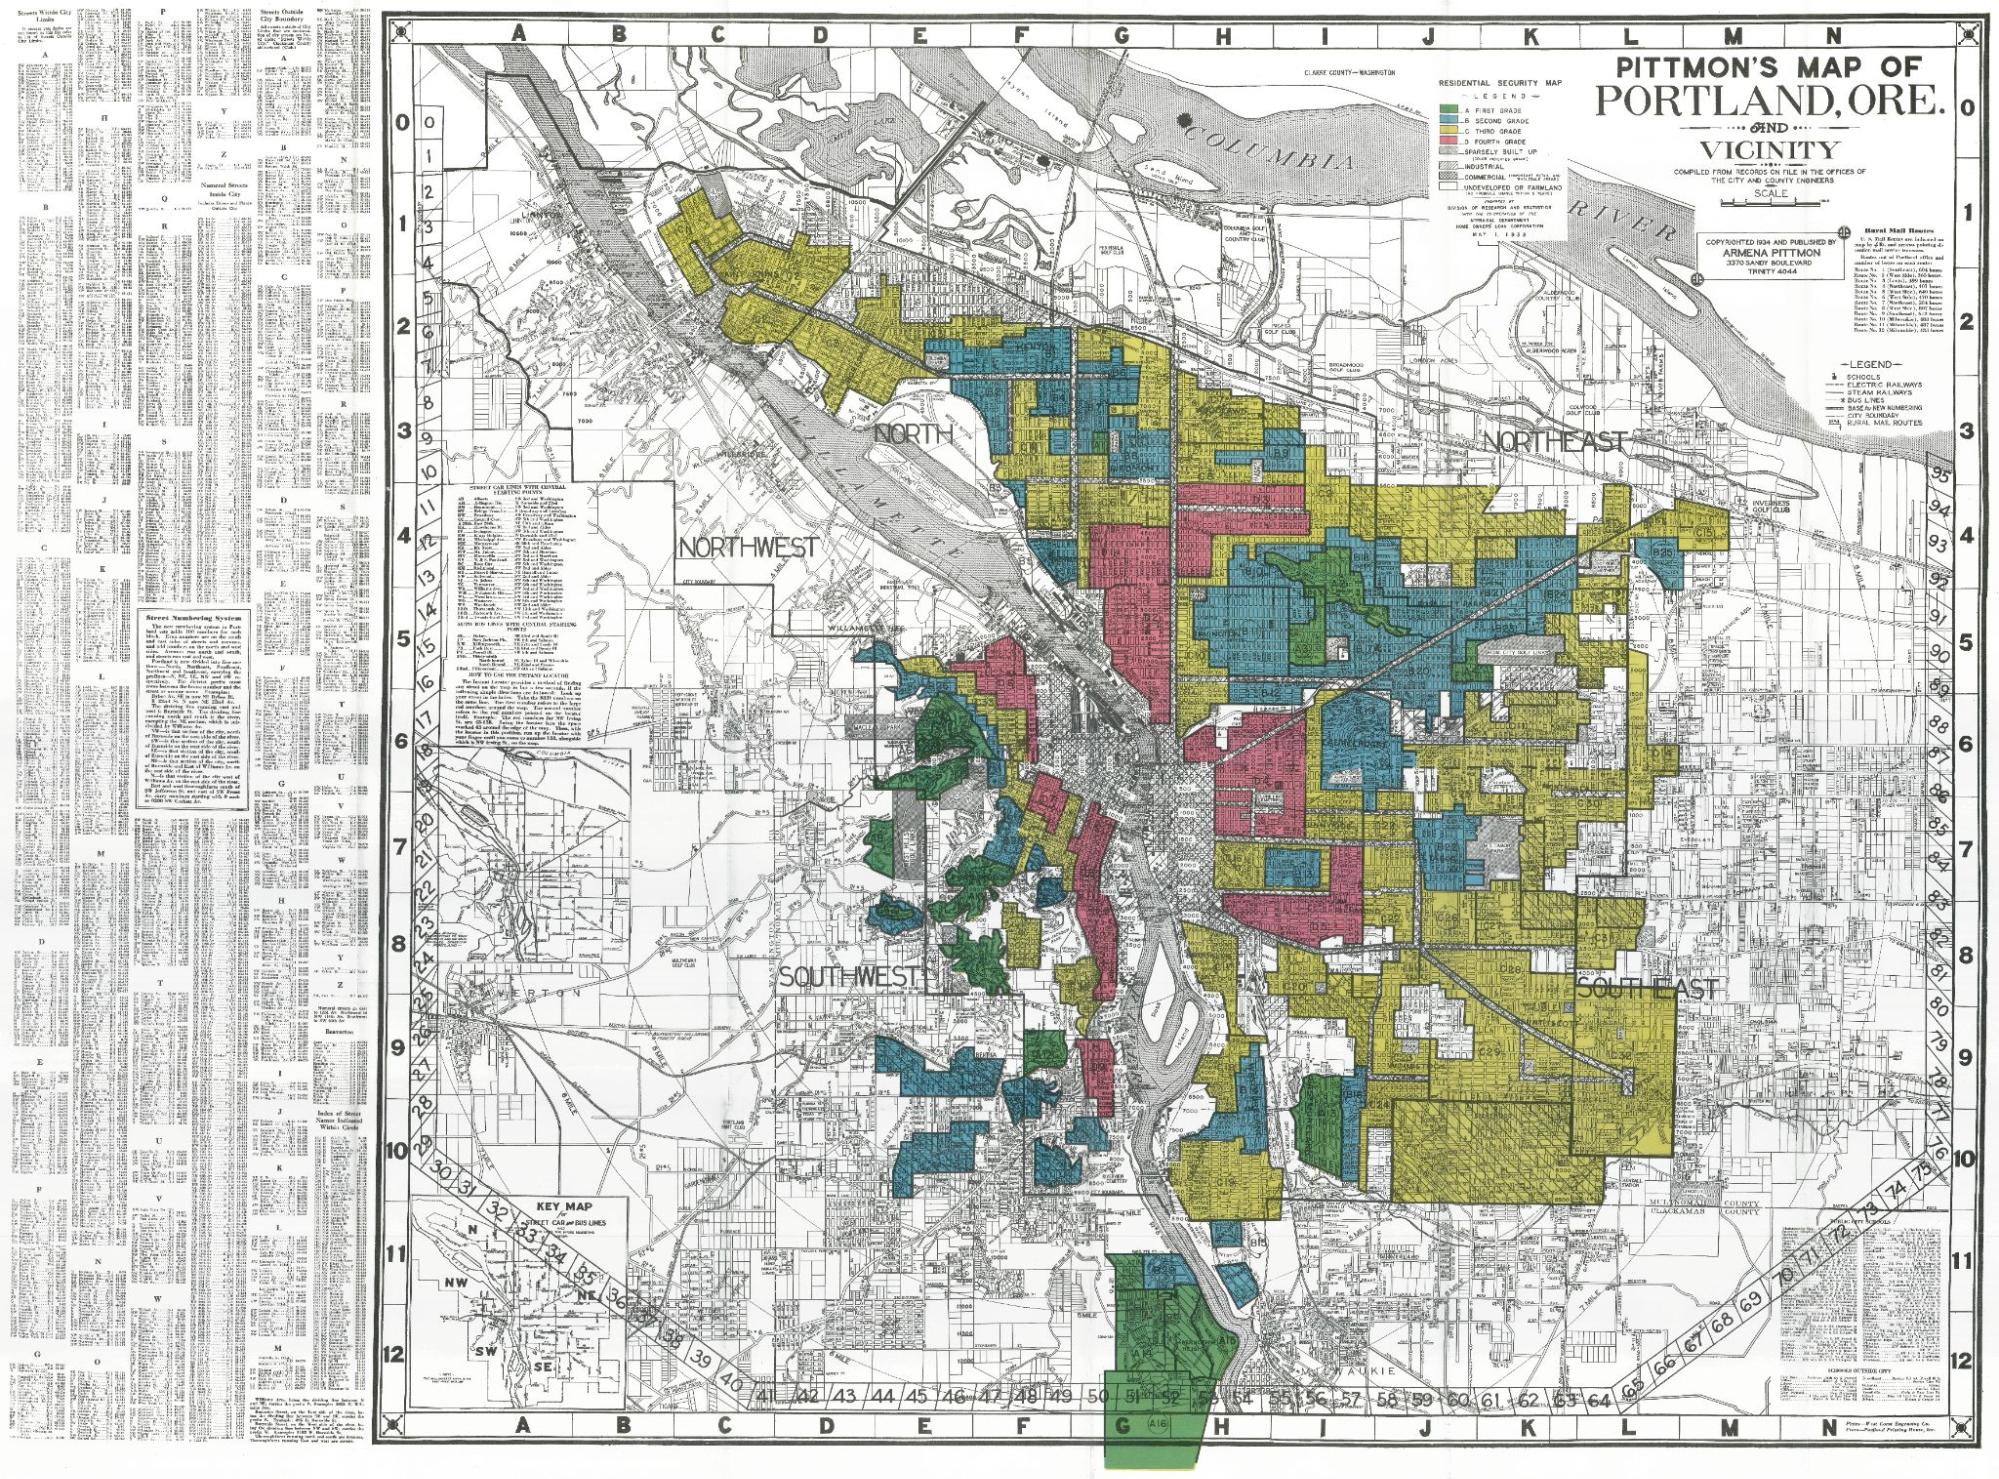
Another form of structural racism that perpetuates housing segregation is redlining, the discriminatory practice of refusing loans to creditworthy applicants in neighborhoods that banks deem undesirable. In the 1930s, the lending industry and the federal government worked to segregate whites from other groups to preserve their property values. They did this by creating maps that marked the residences of people of color and/or immigrants in red. Then those areas were designated to be “dangerous” or “risky” in terms of loaning practices (figure 3.22).
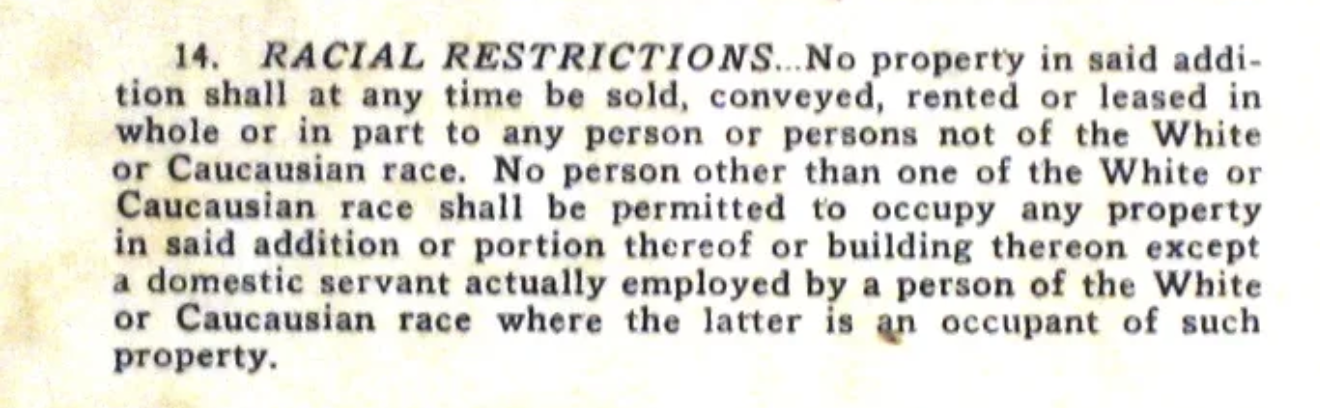
Between 1910 and 1960, racial restrictions became common in the form of contracts woven into property deeds. These clauses prevented owners from renting or selling their properties to people of color. If they violated such a clause, they would risk forfeiting the property (figure 3.23).
In 1968, the Fair Housing Act, part of the Civil Rights Act, outlawed these discriminatory practices, but much damage was done prior to its passage. A study published in 2021 by University of Berkeley’s Othering and Belonging Institute notes that “[Eighty-three] percent of neighborhoods that were given poor ratings (or ‘redlined’) in the 1930s by a federal mortgage policy were as of 2010 highly segregated communities of color” and “more than 80 percent of major metropolitan areas in the United States were actually more segregated in 2019 than they were in 1990” (Menendian, Gambhir, and Gailes 2021).
Once the Fair Housing Act was passed, some local governments began using other legal methods to justify racist real estate practices. For example, zoning laws required more expensive single-family houses on larger lots in richer neighborhoods or restricted cheaper multifamily housing in other locations to continue segregation (Rouse et al. 2021). Black families were forced to buy houses in older, more urban communities.
These practices of creating housing segregation affected access to education as well. This is because in the United States, a good part of funding for school districts comes from the area’s property taxes. When homes were assessed at low value, the amount of taxes that were allotted for schools was limited. This compound of housing and education inequity continues today.
Educator Jonathan Kozol examines the consequences of the funding differences in education in his book Savage Inequalities. He documents classroom differences in the public school systems of several East Coast cities, illustrating that in poor schools, students face overcrowding, unsanitary conditions, and understaffed buildings where even basic tools and textbooks might be missing. Kozol concludes that “equal funding for unequal needs is not equality” and that disparities in school quality constitute a specific form of de facto racial segregation (Kozol 1991:54).
We know that education access matters because increased educational attainment can affect an individual’s wealth and income. However, educational attainment does not automatically level the playing field. Looking more closely, we can see that when race and ethnicity are considered, educational attainment can’t promise to improve an individual’s wealth and income. Why is this?
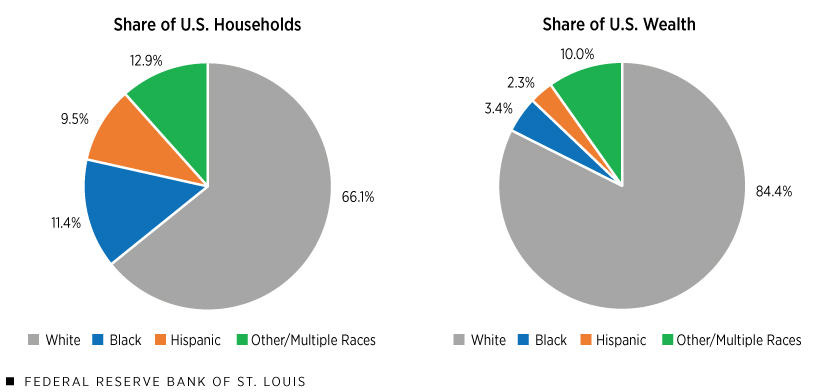
First, white people have more wealth than Black, Hispanic, or families registering as Other, or Multiple Races (figure 3.24). The playing field of higher education begins unequally.
Second, while the federal financial aid system is making it easier for low-income people to get into college and succeed there, gaps still exist. A higher percentage of white students go to college and are more likely to go to more selective colleges. Black and Hispanic students are more likely to enroll in colleges that grant certificates or associate’s degrees rather than bachelor’s degrees (Baker et al. 2018).
Students of color also take on more student loan debt to pay for college. The United Negro College Fund found that in 2022, 72 percent of Black students accrued debt to go to school, compared to only 56 percent of white students. Long-term debt also decreases opportunities to create wealth (United Negro College Fund n.d.).
Even the degrees students pursue differ by race and ethnicity. More than half of all white students earn bachelor’s degrees, compared to just under 40 percent of Black and Hispanic students. But getting into college, paying for it, and choosing a degree or certificate are only the start. Students still have to graduate in order to begin to realize higher earnings.
Completing college can make an economic difference. Black men have the lowest overall completion rates when gender and race are concerned (Shapiro et al. 2017). After graduation, white graduates tend to earn more than Black and Hispanic graduates with a bachelor’s degree. Part of the gap is due to the kinds of degrees that people get. White men are overrepresented in computer science, engineering, and business fields, which often results in high incomes. Hispanic women are overrepresented in education, psychology, and health professions.
Research on first-generation, low-income college students demonstrates the intersectional nature of social locations. It also points to how social location is related to social mobility, an individual’s or group’s (e.g., family) movement through the class hierarchy due to changes in income, occupation, or wealth. Educational administration professor Kristen A. Renn explains:
A Black woman with a college degree is likely to earn less than a Black man or a white woman with the same degree; Hispanic women with undergraduate degrees earn even less. So even with a college degree, equal opportunities for social mobility are not guaranteed for all LIFG [low-income first-generation] students. Earning a college degree is an important element of social mobility for LIFG students, but it does not in itself level the playing field of intergenerational wealth (Renn 2022).
So will getting a college degree advance your access to income and wealth? Detailed research demonstrates that you are likely to earn more in your lifetime, but how much more depends on your race, ethnicity, class, and gender.
The Digital Divide and #YesWeCode
One of the key disparities related to education is access to technology. Each time you use your phone to find a restaurant, get directions, or look up the actors in your favorite movie, you are using technology to solve problems. However, access to technology is unequal. The digital divide refers to the uneven access to technology between groups across social and geographic locations.
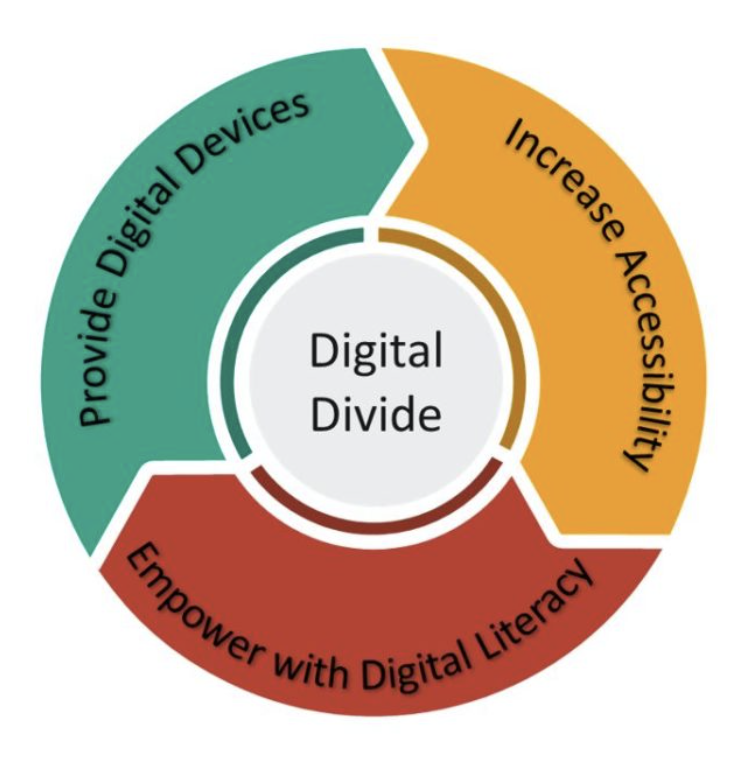
The digital divide has become widely used to describe not only internet use but also access to computers and smartphones, access to free or low-cost stable internet, and digital literacy. These three components of access to devices, access to the internet, and effective skills are referred to as the three-pronged strategy needed to close the digital divide (figure 3.25). Individuals need a computer that they know how to use effectively and a sufficient-quality internet service to participate effectively.
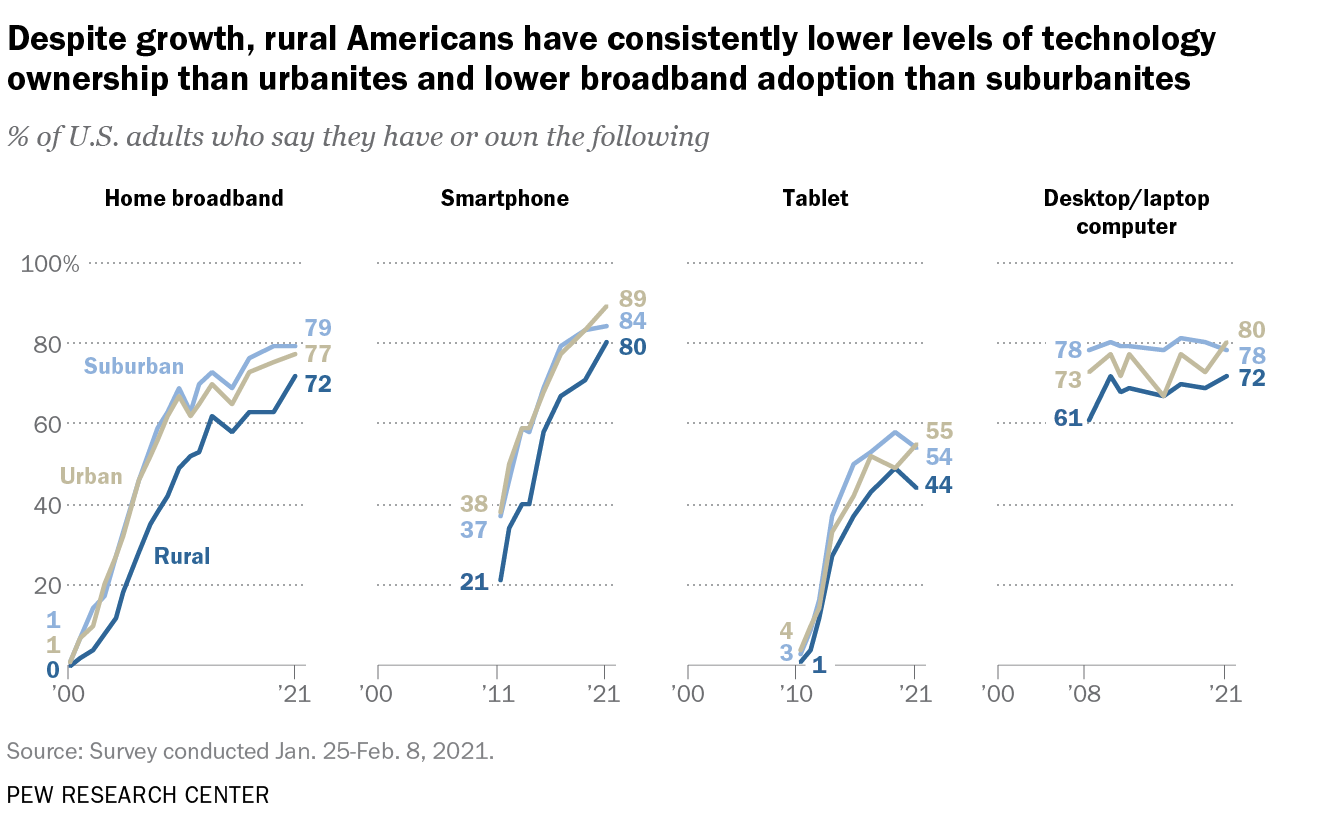
Since the first known usage of “digital divide” in 1994, researchers have continued to examine who is divided. For example, in 2018, Pew Research reported that nearly one in five students couldn’t finish their homework because they did not have access to the internet (Anderson and Perrin 2018). As you might expect, social location is a strong predictor of who has access to technology and who doesn’t. For example, people in rural areas still own less technology than those living in cities or suburbs. Figure 3.26 shows the percentage of device ownership in urban, suburban, and rural areas. How does your experience with device ownership fit within these percentages?
Because school was shifted online during the COVID-19 pandemic, closing the digital divide became urgent. Organizations and individuals promoted social justice through their collective action and agency: the capacity to actively and independently affect change. For example, the federal government implemented broadband programs allowing families to get internet services at free or low cost (Federal Communications Commission. n.d.). State governments funded internet access for schools and libraries. Local schools purchased computers and hotspots.
We know that access to technology is only part of the solution to bridging the digital divide. For example, nonprofit social service providers highlight the importance of digital skills as crucial for stabilizing families. Goodwill, for example, hosts a digital learning platform called GFC Globalt that helps people learn to use their computers.
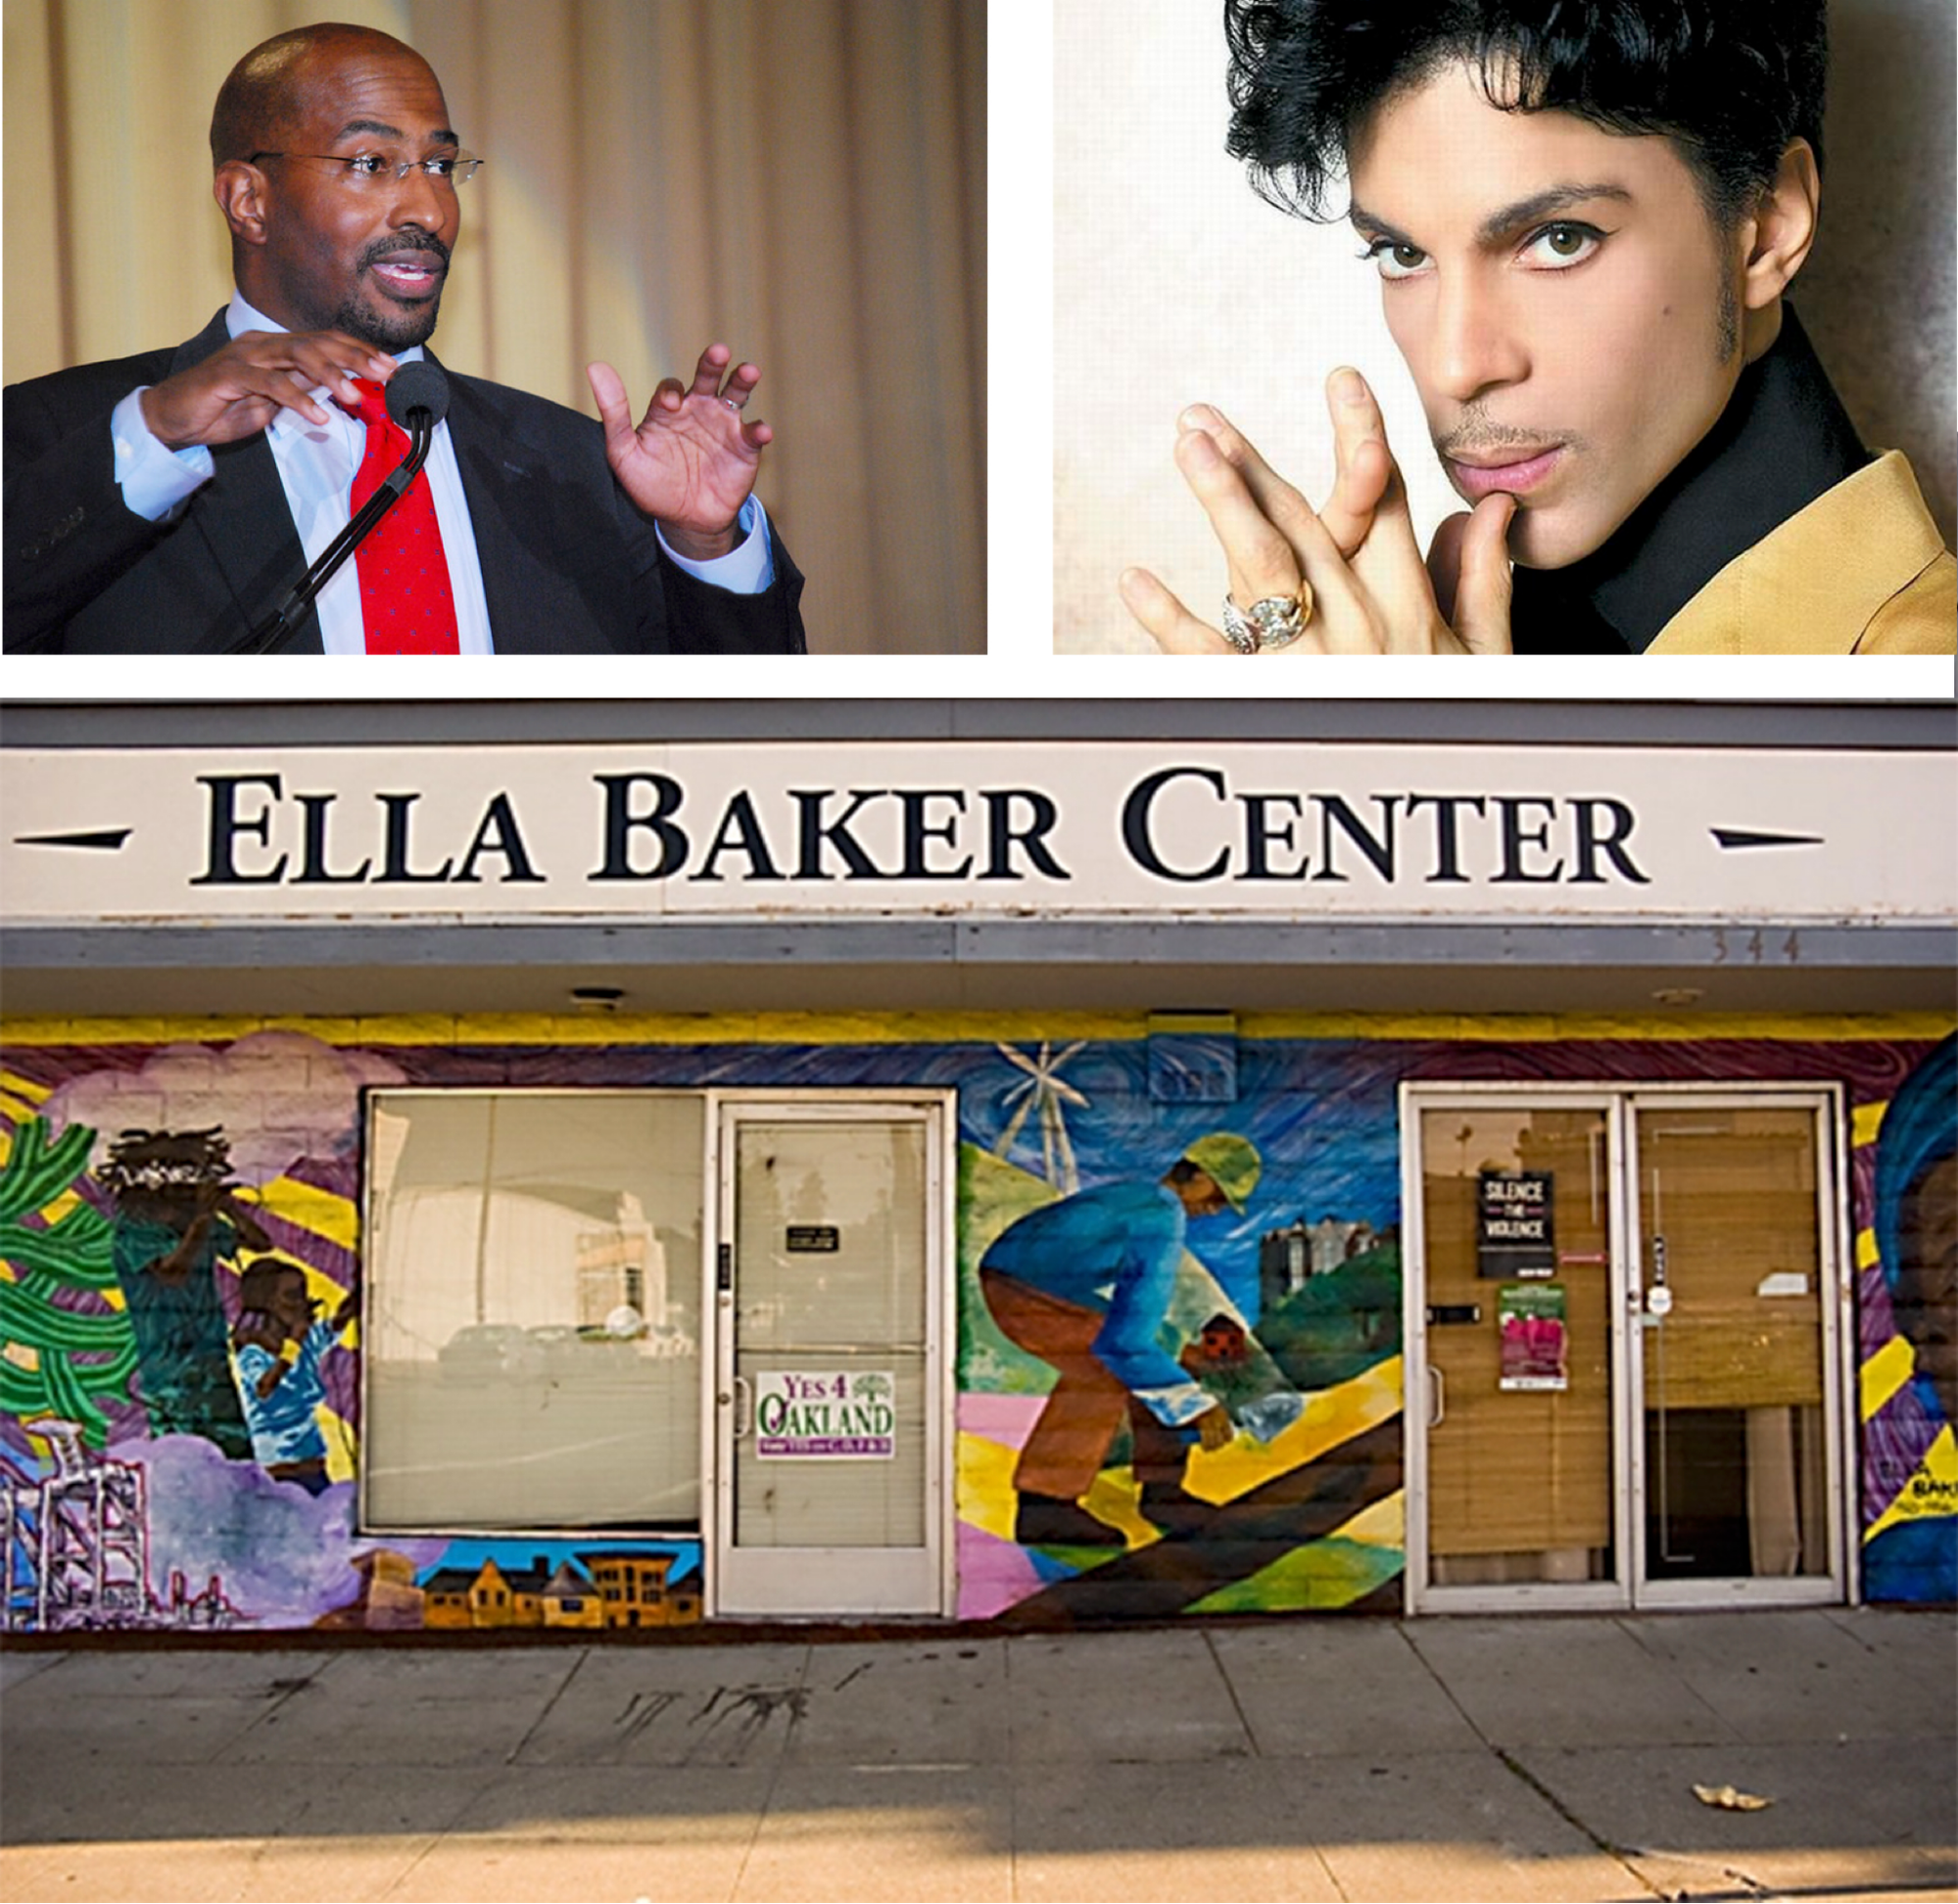
Some nonprofits are taking a much more integrated approach. #YesWeCode, now woven into the project Dream.Org, is a creative initiative to address the digital divide. It was launched by political analyst, lawyer, and civil rights advocate Van Jones and the musician Prince. Jones spent years running the Ella Baker Center for Human Rights in Oakland, California. The organization lobbied for funds to be dedicated to education versus juvenile prisons in an initiative called “Books Not Bars.”
Later, as the digital divide became evident, he and Prince developed #YesWeCode as a national initiative to “help 100,000 young women and men from underrepresented backgrounds find success in the tech sector.” Their strategy was to reduce the financial barriers to entering the tech sector by providing scholarships to technical training programs such as coding bootcamps. They also connected their graduates to jobs in tech. Watch the one-minute video “Van Jones on Education and Equity; Global Citizen Festival: NYC [Streaming Video]” (figure 3.28) to understand more about Jones’s and Prince’s vision.
https://www.youtube.com/watch?v=wGqUdmDSnzI
Housing segregation, education segregation, and the digital divide, are just a few examples of how stratification is revealed in lived experiences. #YesWeCode is an example of an organization that identified digital access as a key inequity experienced by Black youth. Then it found a way to circumvent the structural barriers that underpin that oppression.
Going Deeper
To learn more about redlining, watch the video, “The House We Live In: Redlining” [Streaming Video] at the website, Race: The Power of an Illusion. You can also find articles there regarding “Segregated Housing and the Racial Wealth Gap,” “A Long History of Racial Preferences: For Whites,” and “Racial Preferences for Whites: The Houses That Racism Built.”
You can also see more about the #YesWeCode strategy in the Dream Tech section at Dream.org [Website].
Licenses and Attributions for Lived Experiences in Stratified Society
Open Content, Original
“Lived Experiences in Stratified Society” by Aimee Samara Krouskop is licensed under CC BY-SA 4.0.
“The Segregation of Housing and Education” by Aimee Samara Krouskop and Kimberly Puttman is licensed under CC BY 4.0. Section on redlining adapted from Structural Issues of Houselessness by Nora Karena in Inequality and Interdependence: Social Problems and Social Justice, licensed under CC BY 4.0. Image of covenant added and map replaced.
“The Digital Divide and #YesWeCode” by Aimee Samara Krouskop and Kimberly Puttman is licensed under CC BY-SA 4.0.
Open Content, Shared Previously
Figure 3.21. Image of Francia Márquez on Flickr by Eneas De Troya is licensed under CC BY 2.0.
Figure 3.22. Map of redlining in Portland, Oregon by Mapping Inequality: Redlining in New Deal America is in the public domain.
Figure 3.23. A racially restrictive covenant in Seattle, by the Civil Rights and Labor History Consortium, University of Washington is included under fair use.
Figure 3.26. “% of U.S. Adults Who Say They Have or Own the Following” from “Some digital divides persist between rural, urban and suburban America” by Pew Research Center, Washington, D.C., is licensed under the Center’s Terms of Use.
Figure 3.27. Van Jones on Flickr by LCCR & LCCREF is licensed under CC BY-NC 2.0 (left). Prince on Flickr by World’s Direction is in the public domain (right).
All Rights Reserved Content
Figure 3.24. “Distribution of U.S. Households and Weath by Primary Race or Ethnicity” by Ana Hernández Kent, Lowell R. Ricketts, Federal Reserve Bank of St. Louis is included under fair use.
Figure 3.25. Los Angeles County digital divide strategy visual is found in the “Report Back on Developing the Digital Divide Regional Strategic Plan” and is included under fair use.
Figure 3.27. Image of mural outside the Ella Baker Center for Human Rights is found at the Oaktown Art blog and is included as fair use (bottom).
Figure 3.28. “Van Jones on Education and Equity; Global Citizen Festival: NYC” by Global Citizen is licensed under the Standard YouTube License.
the system of racial bias that exists across institutions and society.
a group of people that share relationships, experiences, and a sense of meaning and belonging.
the institution by which a society organizes itself and allocates authority to accomplish collective goals and provide benefits that a society needs.
the social position an individual holds within their society. It is based upon social characteristics of social class, gender, sexual orientation, ethnicity, race, and religion and other characteristics that society deems important.
the systemic and extensive nature of social inequity and harm woven throughout social institutions as well as embedded within individual consciousness.
the set of characteristics by which a person is recognizable or known by the society in which they live.
differences in access to resources or opportunity between groups that are the result of treatment by a more powerful group; this creates circumstances that are unnecessary, avoidable, and unfair.
large-scale social arrangement that is stable and predictable, created and maintained to serve the needs of society.
the physical separation of two groups, particularly in residence, but also in workplace and social functions.
the discriminatory practice of refusing loans to creditworthy applicants in neighborhoods that banks deem undesirable.
the financial assets or physical possessions which can be converted into a form that can be used for transactions.
a group of two or more related parts that interact over time to form a whole that has a purpose, function, or behavior.
the extent of a person’s physical, mental, and social well-being.
an individual’s or group’s (e.g., family) movement through the class hierarchy due to changes in income, occupation, or wealth.
uneven access to technology due to inequalities between different social, cultural, and economic groups; often caused by location.
a state where "everyone has fair access to the resources and opportunities to develop their full capacities, and everyone is welcome to participate democratically with others to mutually shape social policies and institutions that govern civic life.”
the capacity to actively and independently choose and to affect change
