
4.8 Measuring Quality of Life
It is important to many social sciences that the study of global inequality goes beyond economic measures. That has created more focus on measuring quality of life. How do we measure the quality of life of a country’s population, and how do we make comparisons with other countries? Let’s look at a few ways: multidimensional levels of poverty; life expectancy; the Genuine Progress Indicator, the Human Development Index; and access to opportunity, services, and protection. Each of these may be categorized as measurements that put people, rather than economic factors, at the center of research. Some add a focus on the health of the environment as crucial to human well-being.
Poverty
Global stratification can be evaluated by considering how many people are living in poverty, particularly extreme poverty. To indicate the level of poverty within a nation or region, researchers calculate the percentage of the population living beneath various poverty thresholds. One common threshold is the International Poverty Line, which refers to the amount of money a person needs to consume or earn per day to avoid living in extreme poverty. In 2023 it was $2.15.
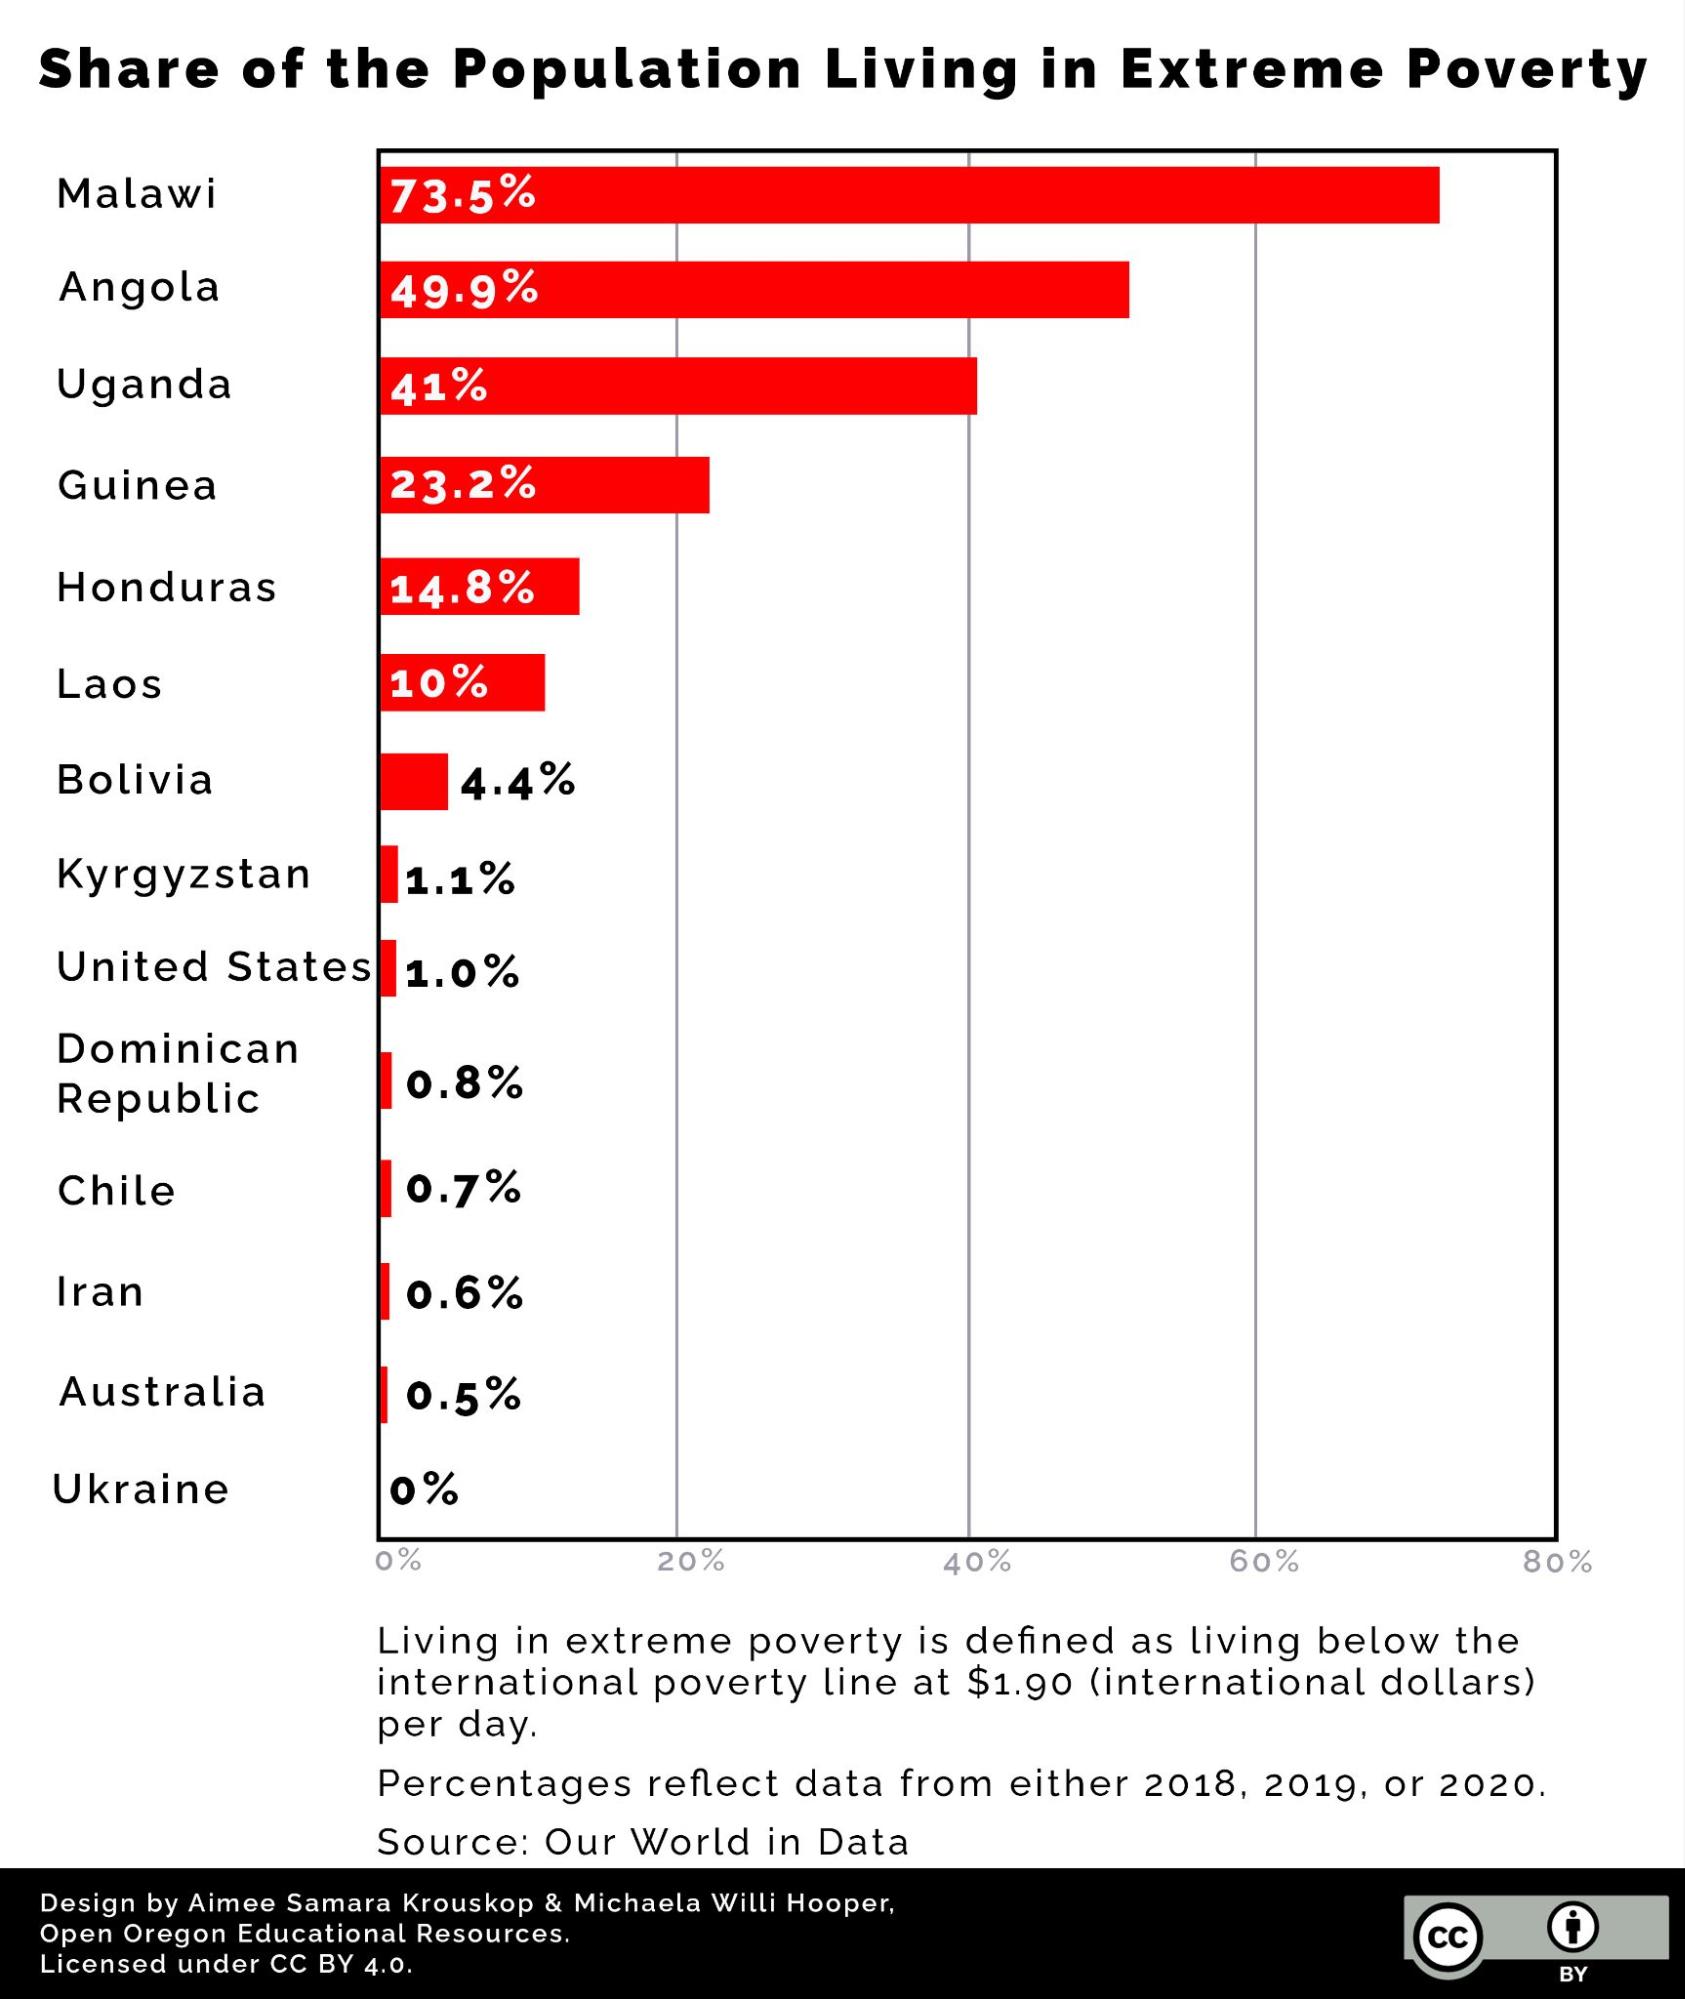
Poverty levels vary greatly across countries. Fortunately, until the COVID-19 pandemic impacted economies in 2020, the extreme poverty rate had been on a 20-year decline. In 2015, 10.1 percent of the world’s population was living in extreme poverty; in 2017, that number had dropped an entire percentage point to 9.2 percent. While a positive change, that 9.2 percent is equivalent to 689 million people living on less than $1.90 a day (World Bank 2020). Figure 4.19 shows differences in extreme poverty between countries in the years 2018 to 2020 when the International Poverty Line was at $1.90.
The global Multidimensional Poverty Index (MPI) measures severe poverty across more than 100 developing countries with three dimensions: health, education, and standard of living. Figure 4.20 shows how those dimensions are broken down in more detail. For example, access to cooking fuel, sanitation, drinking water, electricity, housing, and assets are examined to determine the standard of living.

The Multidimensional Poverty Index provides insights into the lives of poor people, in what specific areas they are deprived, and how intense their poverty is. It also complements the research on poverty that focuses on monetary measures by providing direction for poverty reduction policies where they are most needed. (Optional: Watch the video “Explainer – Global Multidimensional Poverty Index” [Streaming Video].)
Life Expectancy
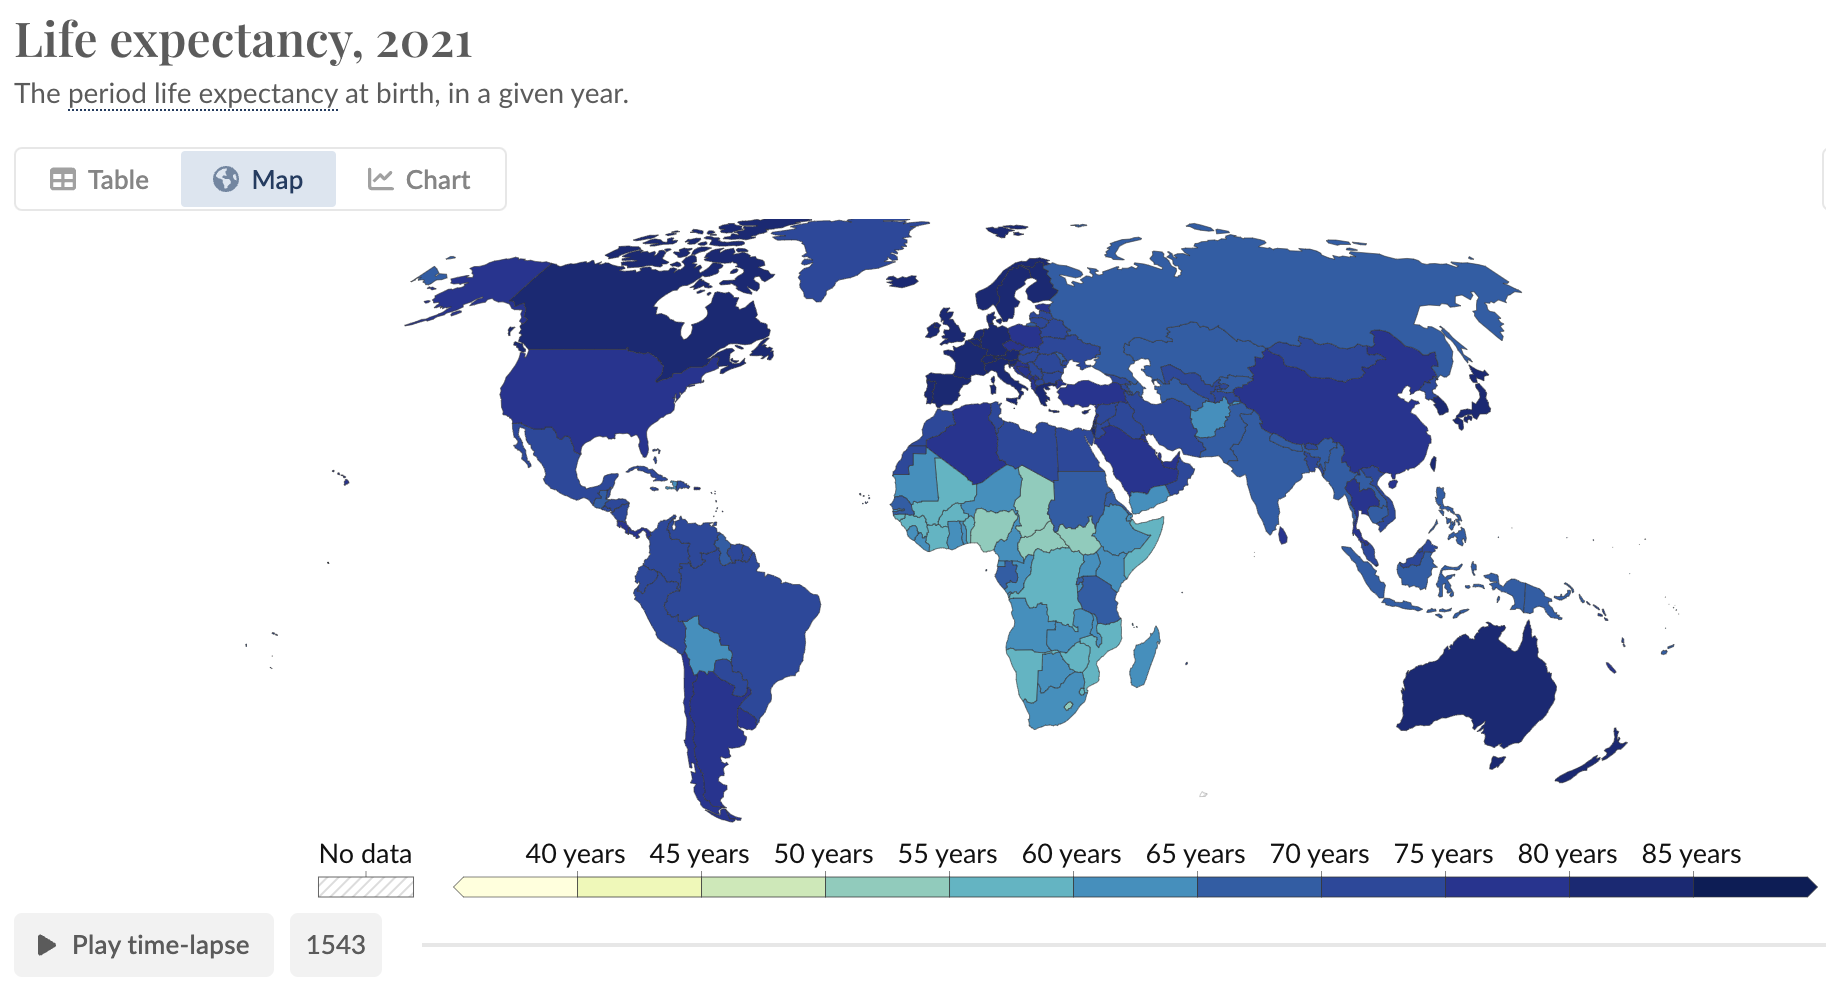
One of the most striking measurements of global stratification between countries is life expectancy, a statistical estimate of the number of years a person can expect to live in a certain region. Life expectancy is based on an estimate of the average age that members of a particular population group will be when they die. As you might expect, people in poorer countries have lower life expectancies than people in wealthier countries. However, life expectancy can also vary significantly within countries.
Take a few minutes to visit the life expectancy map [Website] at Our World in Data to see life expectancy comparisons between countries in 2019. Play the animation to see how life expectancy between countries has changed over time. Figure 4.21 shows life expectancy illustrated by that map in 2019. You can also click the tabs below the animated tools on that page to view the data in either chart or table form. What do you notice about differences in life expectancy across the globe?
Human Development Index
The criticisms and limitations of using GDP have led over the years to the creation of several alternative measurements. One of these is the Human Development Index (HDI), developed by Pakistani economist Mahbub ul Haq in 1990 and adopted by the UNDP.
The HDI is a composite measure that combines a nation’s GDP with many other important quality-of-life considerations, such as life expectancy at birth as a measure of health; security; the adult literacy rate and enrollment in primary, secondary, and higher education as measures of education; and the effects of environmental degradation people experience. Figure 4.22 shows an image that the UNDP created to illustrate components of the HDI.
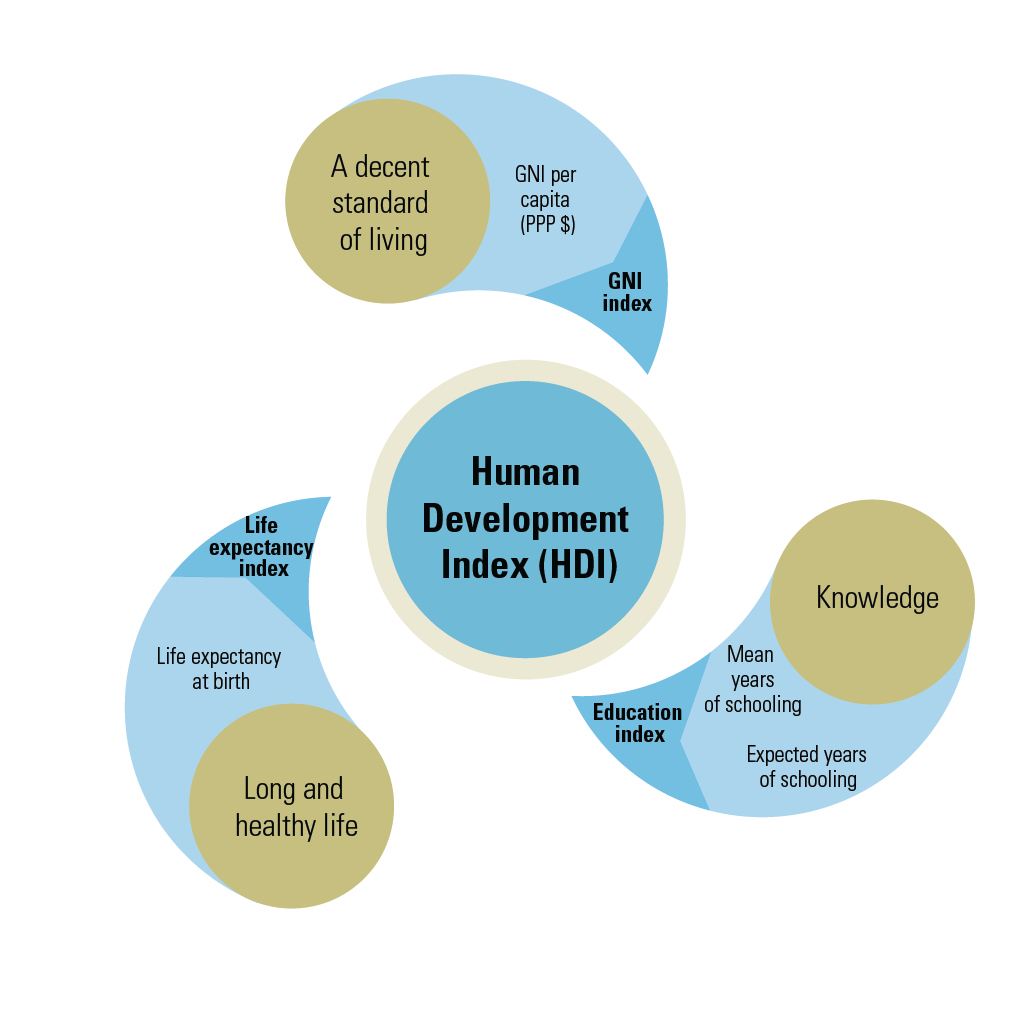
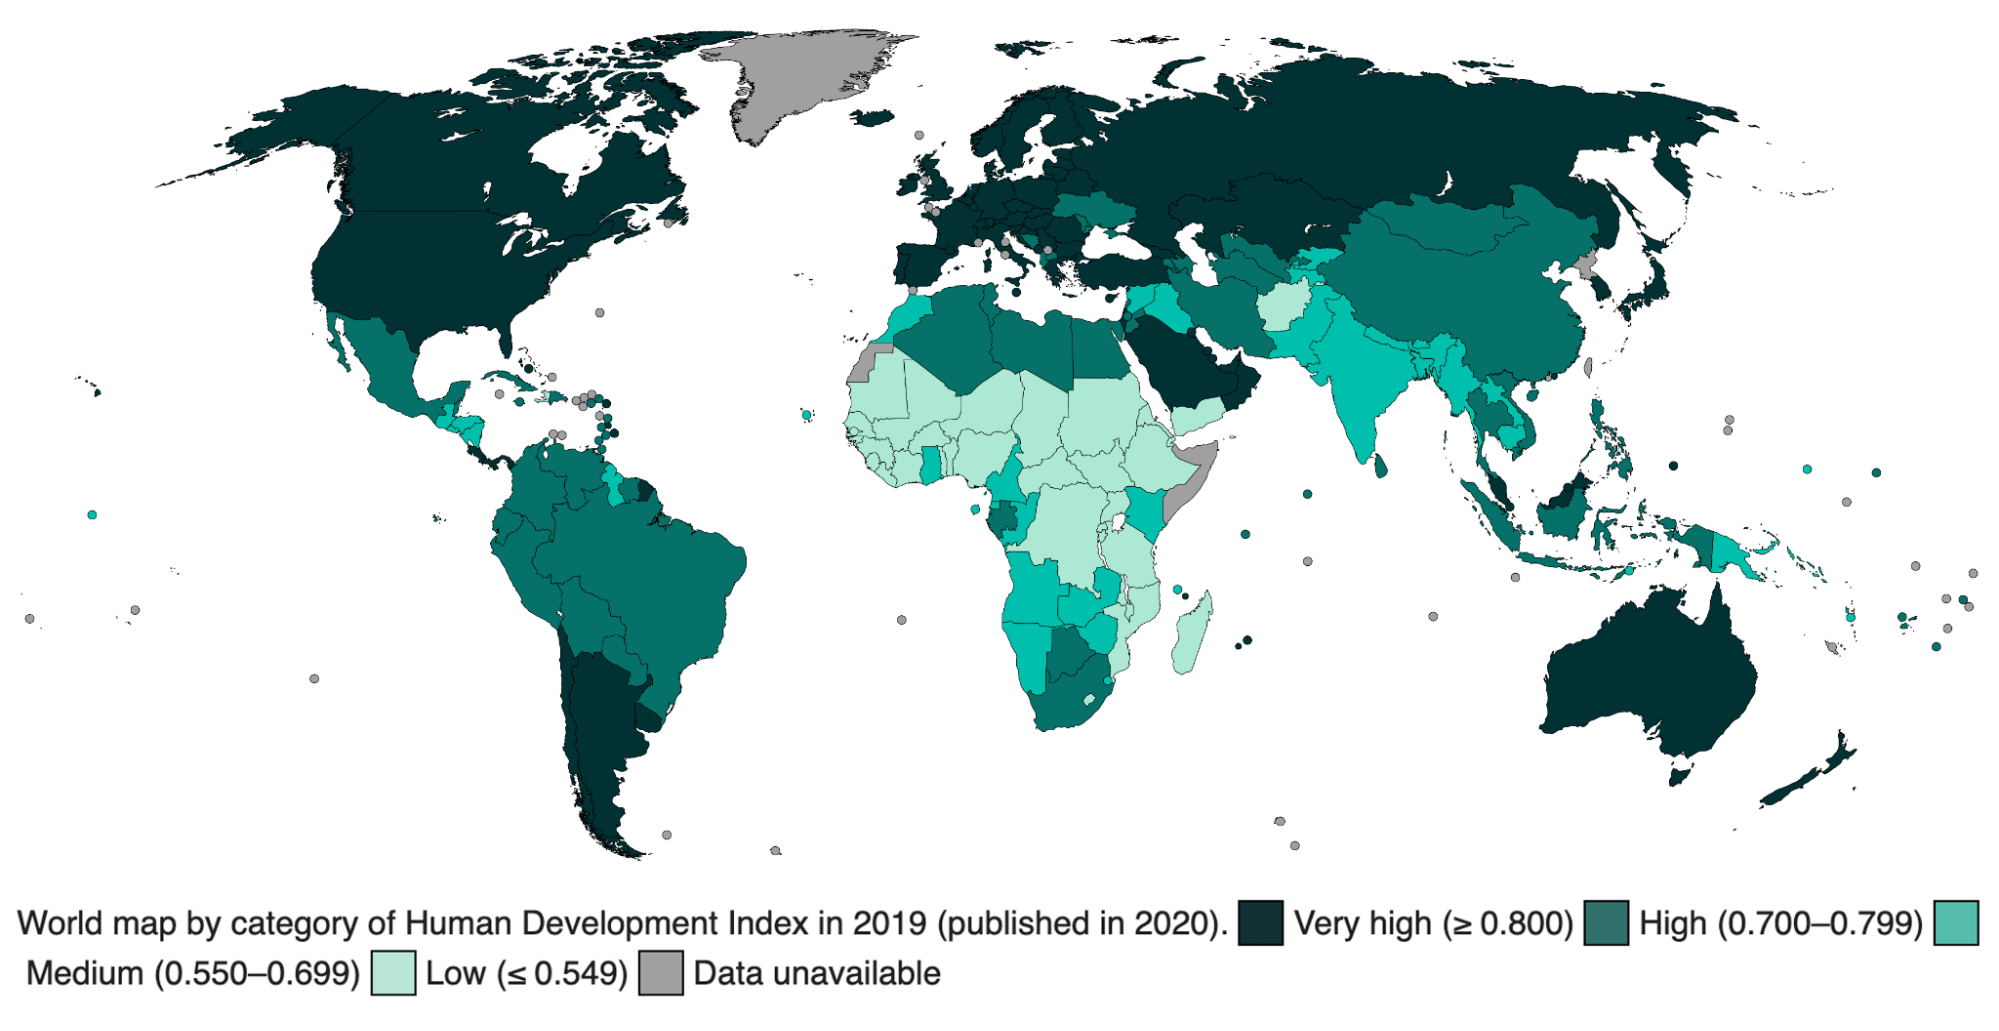
The HDI expresses the capabilities of people’s potential achievement. By using both financial and non-financial factors, it paints a deeper picture of the lives and issues in a region. For example, a nation with high income but low education will still have difficulty in overall opportunity. Figure 4.23 shows how countries rank according to the HDI in 2019.
The HDI has been widely used since the 1990s and reminds us that countries differ dramatically not only in their economic well-being but also in their social well-being.
Genuine Progress Indicator
The Genuine Progress Indicator (GPI) is another tool developed to replace, expand, or complement GDP. The Center for Sustainable Economy explains that the GPI “accounts for the benefits of care work [caregiving labor], higher education, modern infrastructure, and ecosystem services as well as the costs of pollution, deforestation, income inequality, crime and other social ills” (“New Measures of Progress” n.d.).
An “Ecological Footprint” indicator is included that reveals “whether the economy is operating safely within planetary boundaries or breaching of those boundaries by depleting or contaminating the stocks of natural capital on which all economic activity ultimately depends” (“New Measures of Progress” n.d.). This addition takes into account the “costs” of economic activity. In addition to crime, it includes direct social costs such as family breakdown and the time it takes to commute. The indicator also evaluates the pollution of air, water, and noise; the costs of resource and ozone depletion, and the degradation of farmland and wetlands (Lawn 2003).
Economic activity in the form of production can increase GDP, but impair nature’s abilities to balance and regenerate. So the calculations of GPI might include any economic impacts that hinder nature’s ability to clear waste, reduce erosion, or pollinate crops. Some costs to this impairment include added risk of mudslides, reduction of agricultural yields, and loss of species. GPI assesses whether a country’s economic activity is increasing or decreasing these issues, and whether the country is implementing solutions to mitigate them.
In 2021 U.S. Representative Ilhan Omar proposed that the U.S. federal government adopt the Genuine Progress Indicator (GPI). She introduced it as a more holistic measure of our collective socioeconomic welfare, as it includes overlooked social and environmental costs and benefits to economic activity.
Access to Opportunity, Services, and Protection
Another set of criteria that is helpful when assessing global inequality beyond monetary measure is access to opportunity, services, and protection. For example, some groups have limited opportunities to participate in the political process. Their voting rights, freedom of speech, or right to assembly might be curtailed. Distribution of political and physical resources often prevents individuals from some groups from running for office or supporting candidates. We also see political inequality when powerful members of society exert unequal influence over decisions made by political bodies.
Access to services encompasses various aspects, including education, healthcare, quality housing, transportation, and vacationing, as well as the extent of property rights one has, among other social goods and services. These services affect one’s quality of family and neighborhood life, their occupation, and job satisfaction.
With increasing importance, social inequality also relates to the environment. This is experienced as differences in access to natural resources, usable land, parks, or freshwater. It also means differences in how people are exposed to or protected by environmental risks and hazards, such as air or water pollution. As solutions to our environmental issues are made available, differences exist in access to those solutions. We’ll discuss inequality related to environmental solutions in Chapter 10.
Going Deeper
- For more information on poverty, watch this 9:01-minute video: “Globalization and Trade and Poverty: Crash Course Economics #16” [Streaming Video].
- For more on rankings of countries according to the basic HDI, the Gender Equality Index, and more, see the UNDP Human Development Data Center [Website] and the World Bank Open Data [Website].
Licenses and Attributions for Measuring Quality of Life
Open Content, Original
“Measuring Quality of Life” by Aimee Samara Krouskop is licensed under CC BY-SA 4.0.
Figure 4.19. “Share of the Population Living in Extreme Poverty” by Aimee Samara Krouskop and Michaela Willi Hooper, Open Oregon Educational Resources, is licensed under CC BY-SA 4.0. Based on data from Our World in Data.
Figure 4.20. “Structure of the Global Multidimensional Poverty Index” by Aimee Samara Krouskop and Michaela Willi Hooper, Open Oregon Educational Resources, is licensed under CC BY-SA 4.0. Based on data from Unpacking Deprivation Bundles to Reduce Multidimensional Poverty, Global Multidimensional Poverty Index 2022.
Open Content, Shared Previously
The second paragraph of “Poverty” is adapted from Chapter 10.1 Global Stratification and Classification by Tonja R. Conerly, Kathleen Holmes, and Asha Lal Tamang in Introduction to Sociology 3e, Openstax, licensed under CC BY 4.0.
Figure 4.21. “Life Expectancy Map, 2019” by Our World in Data is licensed under CC BY 4.0.
“Human Development Index” is adapted from a section in Chapter 10.1 Global Stratification and Classification by Tonja R. Conerly, Kathleen Holmes, and Asha Lal Tamang in Introduction to Sociology 3e, Openstax, licensed under CC BY 4.0. Modified to add UNDP’s illustration of the Human Development Index and the UNDP Global Human Development Indicators webpage.
Figure 4.22. “Illustration of the Human Development Index (HDI)” by the UNDP licensed under CC BY 3.0.
Explanatory content before figure 4.23 is adapted from “Chapter 9.1 The Nature and Extent of Global Stratification” by the University of Minnesota, Sociology, licensed under CC-BY-NC-SA 4.0.
Figure 4.23. “World map by category of Human Development Index in 2019 ” is on Wikipedia Simple English, by JackintheBox, and licensed under CC BY-SA 4.0.
figures, extents, or amounts of phenomena that we are investigating.
a statistical estimate based on averages, of the number of years a person can expect to live in a certain region.
the extent of a person’s physical, mental, and social well-being.
the unequal distribution of economic and social resources among the world's countries.
the amount of money a person needs to consume or earn per day to avoid living in extreme poverty.
the people at the top of the income and wealth distributions in the world
a system for the production, distribution, and consumption of the goods and services within a society.
the institution by which a society organizes itself and allocates authority to accomplish collective goals and provide benefits that a society needs.
the unequal distribution of valued resources, rewards, and positions in societies.

.png)