
11.7 Race and Organizations/Structures
The final section of this chapter challenges you to think about race at the structural level. Here we will explore how our social institutions perpetuate racial inequalities. We will examine a theory of racialized organizations before looking at a few specific examples of institutionalized discrimination.
11.7.1 Racialized Organizations
In Chapter 9, you learned about how organizations are gendered, meaning gender inequality is built into the structure of organizations such as work. Norms and practices within organizations continue to produce and reproduce outdated gender norms and devalue characteristics associated with traditional depictions of femininity (Mastracci and Arreloa 2016). As you may have gathered from the title of this section, organizations are not race-neutral bureaucratic structures. Organizations play a role in the social construction of race and ethnicity.
Sociologist Victor Ray developed a theory of organizations to explain how they are not race-neutral. In his theory of racialized organizations, Ray (2019) argues there are ways of thinking that connect organizational rules to social and material resources. There are four main ideas to this theory:
- racialized organizations enhance or diminish the agency of racial groups
- racialized organizations legitimate the unequal distribution of resources
- whiteness is a credential
- racialized decoupling of formal rules from organizational practice (Ray 2019).
We can use the racialized theory of organizations to understand how state policy and individual attitudes are shaped by organizations. By understanding organizations as a site of racial inequality, we are better able to identify the internal and external sources of change that need to occur to work towards equity.
11.7.2 Institutionalized Racism
Institutionalized or systemic racism refers to systems and structures that have policies and processes in place that disadvantage racial minority groups. When discriminatory practices are built into the structure of social institutions, we see inequitable outcomes for people of color. In this next section we will explore how racism is ingrained in our society by taking a closer look at housing and health.
11.7.2.1 Housing
Housing segregation refers to residential segregation or the grouping of people in residential areas by a defining characteristic such as age, socioeconomic status, religion, race or ethnicity. In the United States the government has played a role in racial housing segregation through discriminatory practices such as redlining.
11.7.2.1.1 Redlining
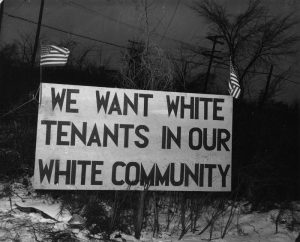
Redlining is the discriminatory practice of refusing loans to creditworthy applicants in neighborhoods that banks deem undesirable or racially occupied. Although homeownership became an emblem of American citizenship and the American dream during the twentieth century, black people and other nationalities were specifically limited in their abilities to purchase homes (figure 11.7). Both the federal government, which created the Home Owners’ Loan Corporation in 1933 and the Federal Housing Association (FHA) in 1934, along with the real estate industry, worked to segregate whites from other groups in order to preserve property values.
Lending institutions and the federal government did this by creating maps in which the places where people of color and/or foreign-born individuals lived were colored red. Then those areas were designated to be “dangerous” or “risky” in terms of loaning practices. Because families in these same groups were often denied access to the neighborhoods designated to be “good” or “the best” they were forced to take loans that required higher down payments and/or higher interest rates.
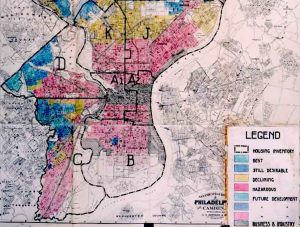
The Home Owners’ Loan Corporation, which regulated home loans, created residential security maps divided into four different categories (figure 11.8):
- Green: “The best” for businessmen
- Blue: “Good” for white-collar families
- Yellow: “Declining” for working-class families
- Red: “Detrimental” or “Dangerous” for foreign-born people, low-class whites, and “negroes”
These ratings indicated to lending institutions how “risky” it was to provide loans by area. It was then less likely that loans could be secured in the red and yellow neighborhoods; interest and payments would be higher. Unscrupulous private lenders used this opportunity to create unfair practices such as unreasonably high payments with devastating consequences if one payment or partial payment was missed, such as the black homeowner losing their home and all equity that had been earned (Coates 2014).
In 1968, these practices were outlawed by the Fair Housing Act, which was part of the Civil Rights Act. The Fair Housing Act is an attempt at providing equitable housing to all. It makes discriminating against someone based on skin color, sex, religion, and disability illegal. Also banned is the practice of real estate lowballing, where banks underestimate the value of a home, in effect forcing a borrower to come up with a larger down payment to compensate for the lower loan value. The offering of higher interest rates, insurance, and terms and conditions to minority loan applicants is illegal. Denying loans and services on the basis of an applicant’s protected class is also illegal.
Still, much damage was done prior to its passage. For decades, the federal government poured tax monies into home loans that almost exclusively favored white families. Home ownership is the most accessible way to build equity and wealth and it was denied to many minority families for decades. Once the Fair Housing Act passed, local governments, residential covenants, and deed modifications continued to discriminate well into the 2000s, and families in minoritized groups still had less success in achieving home loans.
The result of these institutionalized efforts resulted in residential segregation, the physical separation of two or more groups into different neighborhoods. Many times this is associated with race, but it can also be associated with income. Segregated neighborhoods did not come about organically, but through deliberate planning of policies and practices that have systematically denied equal opportunity to minority populations. Segregation has been present in the United States for many years, and while now it is illegal to do so, it has been institutionalized in neighborhood patterns. From information collected in the 2010 census, we see that a typical white person lives in a neighborhood that is 75 percent white and 8 percent black, while a typical African American person lives in a neighborhood that is 35 percent white and 45 percent black (Frey 2020).
Play this six-minute video for a summary of housing segregation in the United States: Housing Segregation and Redlining in America: A Short History | Code Switch | NPR [YouTube]
As a recipient of federal funding, the city of Portland is required to abide by the rules of the Fair Housing Act, but like many cities in the United States, Portland has a history of redlining and other discriminatory practices. In order to better understand Portland’s practices, learning about Oregon’s history is useful. The Oregon Encyclopedia contains a summary of black exclusion laws in Oregon; these laws were put in place when the state was founded in order to discourage people of color from settling in Oregon.
Between 1900 and 1930, Portland began zoning practices, the act of separating land based on what it will be used for, such as residential, industrial, and commercial. In 1924, Portland approved its first zoning code, Zone 1–Single-Family, Zone 2–Multi-Family, Zone 3–Business-Manufacturing, and Zone 4–Unrestricted. Most residential areas were designated Zone 2, except for 15 neighborhoods considered the “highest quality” that were designated Zone 1 (Hughes et. al 2019).
Between the 1930s and ’40s, Portland City Council rezoned large areas of multi-family zoning to single-family zoning. This was done to protect real estate values of single-family homes and make it easier for homeowners to obtain Federal Housing Administration loans in those areas. During this time, roughly 14.25 square miles was rezoned from multi-family to single-family housing. This was used as a tool to further reinforce racial segregation by restricting federal and private lending. It made it difficult, sometimes even impossible, for residents living in “redlined” neighborhoods to receive residential and commercial loans.
Neighborhood planning from 1960 to 1970 included the ideas of residents instead of only the real estate industry. In 1973, a Senate bill was passed which eventually led to the creation of the state’s land use planning program. This program required cities to have a 20-year plan to accommodate growth. There was a strong interest from Portland residents in housing policies which would distribute low-income housing throughout the entire Portland area. Although many strong neighborhood associations formed, power continued to reside with the more affluent, mostly white neighborhoods.
In 1994, the Community and Neighborhood Planning Program was adopted to address issues that sprouted after the Comprehensive Plan. With this they did the opposite of what had been done for many years in the past by expanding the multi-family zones. The program sought to expand and intermix multi-family housing, but it was met with resistance and controversy that led to uneven results.
VisionPDX came forward in 2005 as an effort to engage community members, especially those from underrepresented communities, in developing a shared vision of Portland. They wanted to focus on providing a space for other folks who previously had no say in the future of Portland to now have the opportunity for input. This new way of thinking about equity in planning led to the development of new goals and policies in the most updated version of the Comprehensive Plan in 2016.
Today, single-family zoning accounts for approximately 74 percent of the total land area for housing in Portland. Since the 1920s, very little change has occurred with the original 15 single-family zones. These neighborhoods have remained stable and demographically homogeneous with low levels of vulnerability to displacement and tend to be the zones for white households. Similarly, the zones originally designated as less desirable are homes for many families from marginalized groups, and contain fewer resources and amenities desired by families. In 2019, Oregon passed legislation that eliminates exclusive single-family zoning in much of the state but there are some questions regarding how long it will take to go into effect.
So what can we learn from this? Portland’s land use planning history, intentional or not, has resulted in discrimination and segregation. These planning practices and the decisions made have predominantly benefited and privileged white homeowners while communities of color have been burdened, excluded, and displaced. Decision-making for collective improvement is often complicated when it affects individual outcomes. The same people who may believe in equity may also resist change when they perceive that it affects them individually. This is called the “Not in my Backyard” (NIMBY) phenomenon and likely affected Portland’s failure to move toward creating more mixed neighborhoods. Portland and all cities can do better. Fair housing regulations can be achieved by understanding the history and then creating policy change which will lead to more equitable outcomes.
11.7.2.1.2 Bluelining
Bluelining is a current banking and lending issue as a result of climate change. Real estate that is considered high risk due to low elevation may not qualify for loans. With the current rate of ocean warming, sea levels are expected to rise and warm water will generate storms that displace millions of people in the United States and worldwide. Flooding could displace 126 million people, or 40 percent of the U.S. population, by 2021. Climigration is the act of people relocating to areas less devastated by flooding, storms, drought, lack of clean water or economic disaster due to the forces of climate change.
Bluelining means that some homeowners are literally under water. Many American families relocate as jobs disappear or land becomes flooded or arid. In response to immediate disaster, many families move to live with relatives or friends. Climate change has also changed the economic desirability of entire regions, creating a new divide between the poor and the privileged. In the Southern California region of Los Angeles, shade has become an increasingly precious commodity, giving respite from the searing heat that bakes the community during longer, hotter warm seasons.
11.7.2.1.3 Reservation Land and Home Ownership
There is another group of families unable to build capital via home ownership: Native American Indians who reside on reservations. When the United States government sequestered Native Americans to reservation lands, it also retained ownership of that land, creating a “ward: guardian relationship” between the government and the Indian Nations, as characterized by Supreme Court Chief Justice John Marshall in 1831 (Cherokee Nation v. The State of Georgia ). The government holds reservation lands “in trust” for the tribe nations.
While there is much public debate about other aspects of tribal rights such as casinos, and the effects of using Native or Indian images and names for sport teams, there is little discussion about the ways the U.S. government has limited the abilities of Native Americans to own property within the communities where they live (Schaefer 2016). This most basic way of building equity in a country that values individualism and capitalism has been restricted for the people who have inhabited it the longest. Native Americans have the highest poverty rate of any racial-ethnic group (28 percent in 2015) and it is likely that the control the government has exerted over their living conditions contributes to this circumstance (U.S. Census Bureau 2015).
11.7.2.2 Health
Health and healthcare systems are an area where we see large disparities among racial and ethnic groups. As we consider the interactions of race, class, and gender, our nation’s health becomes complicated. Family and individual health is affected by the environments in which people live, work, learn, and play. Social determinants of health also affect a wide range of quality of life factors, such as social engagement, access to resources, safety and security are all impacted by the settings where families spend their time. Simply put, place matters when it comes to health.
Health disparities are linked to the social determinants of health. They are preventable differences in the burden of disease, injury, violence, or opportunities to achieve optimal health that are experienced by socially disadvantaged populations (Centers for Disease Control [CDC] 2008). Populations can be defined by factors such as race or ethnicity, gender, education or income, disability, geographic location (e.g., rural or urban), or sexual orientation. Health disparities are inequitable and are directly related to the historical and current unequal distribution of social, political, economic, and environmental resources.
When examining health in the United States, it is hard to miss the disparities among races. The discrepancy between black and white Americans shows the gap clearly; in 2021, the average life expectancy for white males was approximately seven years longer than for black males: 73.7 compared to 66.7 (Arias 2022). Black people also have a higher incidence of several other diseases and causes of mortality, from cancer to heart disease to diabetes. Ethnic minorities, including Mexican Americans and Native Americans, also have higher rates of these diseases and causes of mortality than whites.
According to a report from the Kaiser Family Foundation, although cancer mortality rates have declined across all racial and ethnic groups, black people continued to have the highest cancer mortality rate in 2018 (Tong, Hill, and Artiga 2022). Overall, rates of cancer screenings are lower among black, Latinx, Asian and American Indian or Alaska native populations compared to their white counterparts.
Another environmental issue that impacts racial health equity is extreme heat. Historic housing policies, including redlining, contribute to disparities in heat exposure. Residential segregation which forced many low-income people and people of color into areas with fewer resources has been compounded by the disinvestment in these areas over time. People of color are exposed to additional environmental health risks, such as higher exposure to pollution, hazardous waste, and heat since surface temperatures in historically redlined areas are warmer than in non-redlined areas (Ndugga et al. 2021).
Lisa Berkman (2009) notes that this gap started to narrow during the Civil Rights movement in the 1960s, but it began widening again in the early 1980s. What accounts for these perpetual disparities in health among different ethnic groups? Much of the answer lies in the level of healthcare that these groups receive. Even after adjusting for insurance differences, racial and ethnic minority groups receive poorer quality of care and less access to care than dominant groups (Agency for Healthcare Research and Quality 2010). Racial inequalities in care include:
- Black Americans, Native Americans, and Alaskan Natives received inferior care than white Americans for about 40 percent of measures.
- Asian ethnicities received inferior care for about 20 percent of measures.
- Among whites, Hispanic whites received 60 percent inferior care of measures compared to non-Hispanic whites.
- When considering access to care, the figures were comparable.
In the next section, “Pedagogical Element: Racial Tensions in the United States,” you will learn more about how prejudice and discrimination intersections with violence and institutionalized racism.
11.7.3 Activity: Racial Tensions in the United States
The death of Michael Brown in Ferguson, Missouri on August 9, 2014 illustrates racial tensions in the United States as well as the overlap between prejudice, discrimination, and institutional racism. On that day, Brown, a young unarmed black man, was killed by a white police officer named Darren Wilson. During the incident, Wilson directed Brown and his friend to walk on the sidewalk instead of in the street. While eyewitness accounts vary, they agree that an altercation occurred between Wilson and Brown. Wilson’s version has him shooting Brown in self-defense after Brown assaulted him, while Dorian Johnson, a friend of Brown also present at the time, claimed that Brown first ran away, then turned with his hands in the air to surrender, after which Wilson shot him repeatedly (Nobles and Bosman 2014). Three autopsies independently confirmed that Brown was shot six times (Lowery and Fears 2014).
The shooting focused attention on a number of race-related tensions in the United States. First, members of the predominantly black community viewed Brown’s death as the result of a white police officer racially profiling a black man (Nobles and Bosman 2014). In the days after, it was revealed that only three members of the town’s 53-member police force were black (Nobles and Bosman 2014). The national dialogue shifted during the next few weeks, with some commentators pointing to a nationwide sedimentation of racial inequality and identifying redlining in Ferguson as a cause of the unbalanced racial composition in the community, in local political establishments, and in the police force (Bouie 2014). Redlining is the practice of routinely refusing mortgages for households and businesses located in predominately minority communities, while sedimentation of racial inequality describes the intergenerational impact of both practical and legalized racism that limits the abilities of black people to accumulate wealth.
Ferguson’s racial imbalance may explain in part why, even though in 2010 only about 63 percent of its population was black, in 2013 black people were detained in 86 percent of stops, 92 percent of searches, and 93 percent of arrests (Missouri Attorney General’s Office 2014). In addition, de facto segregation in Ferguson’s schools, a race-based wealth gap, urban sprawl, and a black unemployment rate three times that of the white unemployment rate worsened existing racial tensions in Ferguson while also reflecting nationwide racial inequalities (Bouie 2014).
This situation has not changed much in the United States. After Michael Brown, dozens of unarmed black people have been shot and killed by police. Studies find no change to the racial disparity in the use of deadly force by police (Belli 2020).
Discussion
- Do you think that racial tension can be reduced by stopping police action against racial minorities?
- What types of policies and practices are important to reduce racial tension?
- Who is responsible? Why?
11.7.4 Licenses and Attributions for Race and Organizations/Structures
“Race and Organizations/Structures” by Jennifer Puentes is licensed under CC BY 4.0.
“Racialized Organizations” by Jennifer Puentes is licensed under CC BY 4.0.
“Institutionalized Racism” by Jennifer Puentes is licensed under CC BY 4.0.
“Housing” from “Finding a Home: Inequities” by Elizabeth B. Pearce; Carla Medel; Katherine Hemlock; and Shonna Dempsey in Contemporary Families: An Equity Lens, which is licensed under CC BY 4.0. Access for free at https://openoregon.pressbooks.pub/families/chapter/finding-a-home-inequities/; edited for consistency and clarity; all other content in this section is original content by Jennifer Puentes and is licensed under CC BY 4.0.
“Health” some sections from “Health Equity” by Elizabeth B. Pearce; Amy Huskey; Jessica N. Hampton; and Hannah Morelos in Contemporary Families: An Equity Lens, which is licensed under CC BY 4.0. Access for free at https://openoregon.pressbooks.pub/families/chapter/health-equity/#footnote-414-18; edited for consistency, clarity, updated and added life expectancy information; all other content in this section is original content by Jennifer Puentes and is licensed under CC BY 4.0.
“Pedagogical Element: Racial Tensions in the United States” from “Big Picture: Racial Tensions in US” in “11.3 Prejudice, Discrimination, and Racism” by Tonja R. Conerly, Kathleen Holmes, Asha Lal Tamang in Openstax Sociology 3e, which is licensed under CC BY 4.0. Access for free at https://openstax.org/books/introduction-sociology-3e/pages/11-3-prejudice-discrimination-and-racism; edited for clarity.