5.1 Chapter Overview and Learning Objectives
5.1.1 Learning Objectives
- Identify different groups within real world situations.
- Explain the ways that group size and structure influences group dynamics.
- Differentiate among styles of leadership.
- Interpret the impact of groups on individual behavior.
- Distinguish strong and weak ties in your social networks.
- Distinguish the types of formal organizations.
- Recognize the characteristics of bureaucracies and collectivist organizations.
- Explain why organizations tend to appear similar.

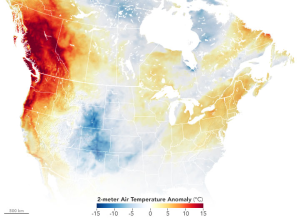
In late June 2021, temperatures across the Pacific Northwest region of the United States spiked to over 100 degrees (figure 5.1). This was particularly problematic because it was early in the summer when people had not adjusted to the summer heat. In addition, temperatures did not cool off much at night, so it was difficult to cool down living spaces if you did not have an air conditioner.
In preparation for the heatwave, Oregon’s Multnomah County government opened several cooling centers and nine libraries to serve as spaces for those without air conditioning. County employees reached out to vulnerable residents, while teams of people roamed the city handing out water and other items to help people cool off (Flaccus 2021).
Lyle Crawford, in his early 60s, was in his home as the temperatures hit 108 degrees. He was alone. He had few close friends and was further isolated because of the pandemic. He had a box fan to help provide some air circulation. When his sister called him to see how he was doing, he didn’t pick up. So she left a message on his answering machine. It would be the last time she heard his voice (Guernsey and Vines 2021).
By some estimates, over 800 people died in Oregon, Washington, and British Columbia as a result of the heat wave (Guilfoil 2022). Heat waves are often the deadliest type of severe weather in the United States (Lewis 2021). How could we use our sociological imagination to explain the consequences of the heat wave? What social factors explain some people’s exposure to the risks associated with the heat wave? What role did organizations play in response?
5.1.2 Licenses and Attributions for Overview
Figure 5.1. NASA Earth Observatory image of temperature anomalies on June 27th, 2021 compared to 2014-2020 average for the same day during the 2021 western North America heat wave by NASA Earth Observatory/Joshua Stevens. Public Domain, via Wikimedia Commons.
“Overview” by Matthew Gougherty is licensed under CC BY 4.0.
