
4.4 Measuring Global Stratification
What does global inequality look like? Today, despite the many initiatives to address it, there is an extreme difference between the wealthiest and poorest countries. There are a number of ways that social scientists measure this stratification. In social science, measures are figures, extents, or amounts of phenomena that we are investigating. We identify appropriate measures to study society by describing and ascribing meaning to the key facts or concepts. The study of stratification, or the distribution of economic and social resources across populations, is a vast topic. So we can describe and ascribe meaning in many ways to evaluate that distribution.
Some measurements are straightforward and easy to count, such as residents’ income. Other measurements, like the quality of residents’ health, are more ambiguous. In the case of ambiguous measurements, sociologists will use indicators to stand in for those concepts. These indicators will allow the level of “health” (or other levels) to be measured based on our chosen concept. For example, we might choose to study the health of residents by how long they live. “Life expectancy” would be our indicator of health. We’ll discuss life expectancy further in this chapter.
It’s important to distinguish the three ways we can study global stratification: between countries, within countries, and within countries as compared to others. For example, a between-country analysis might compare overall wealth between China and its neighbor Mongolia. A within-country analysis might compare the wealth of Mongolian nomads versus Mongolian urban dwellers. We can also compare the level of inequality within countries to others. That is, we’d compare the level of inequality within Mongolia with the level of inequality in China.
Economic Measures Between Countries
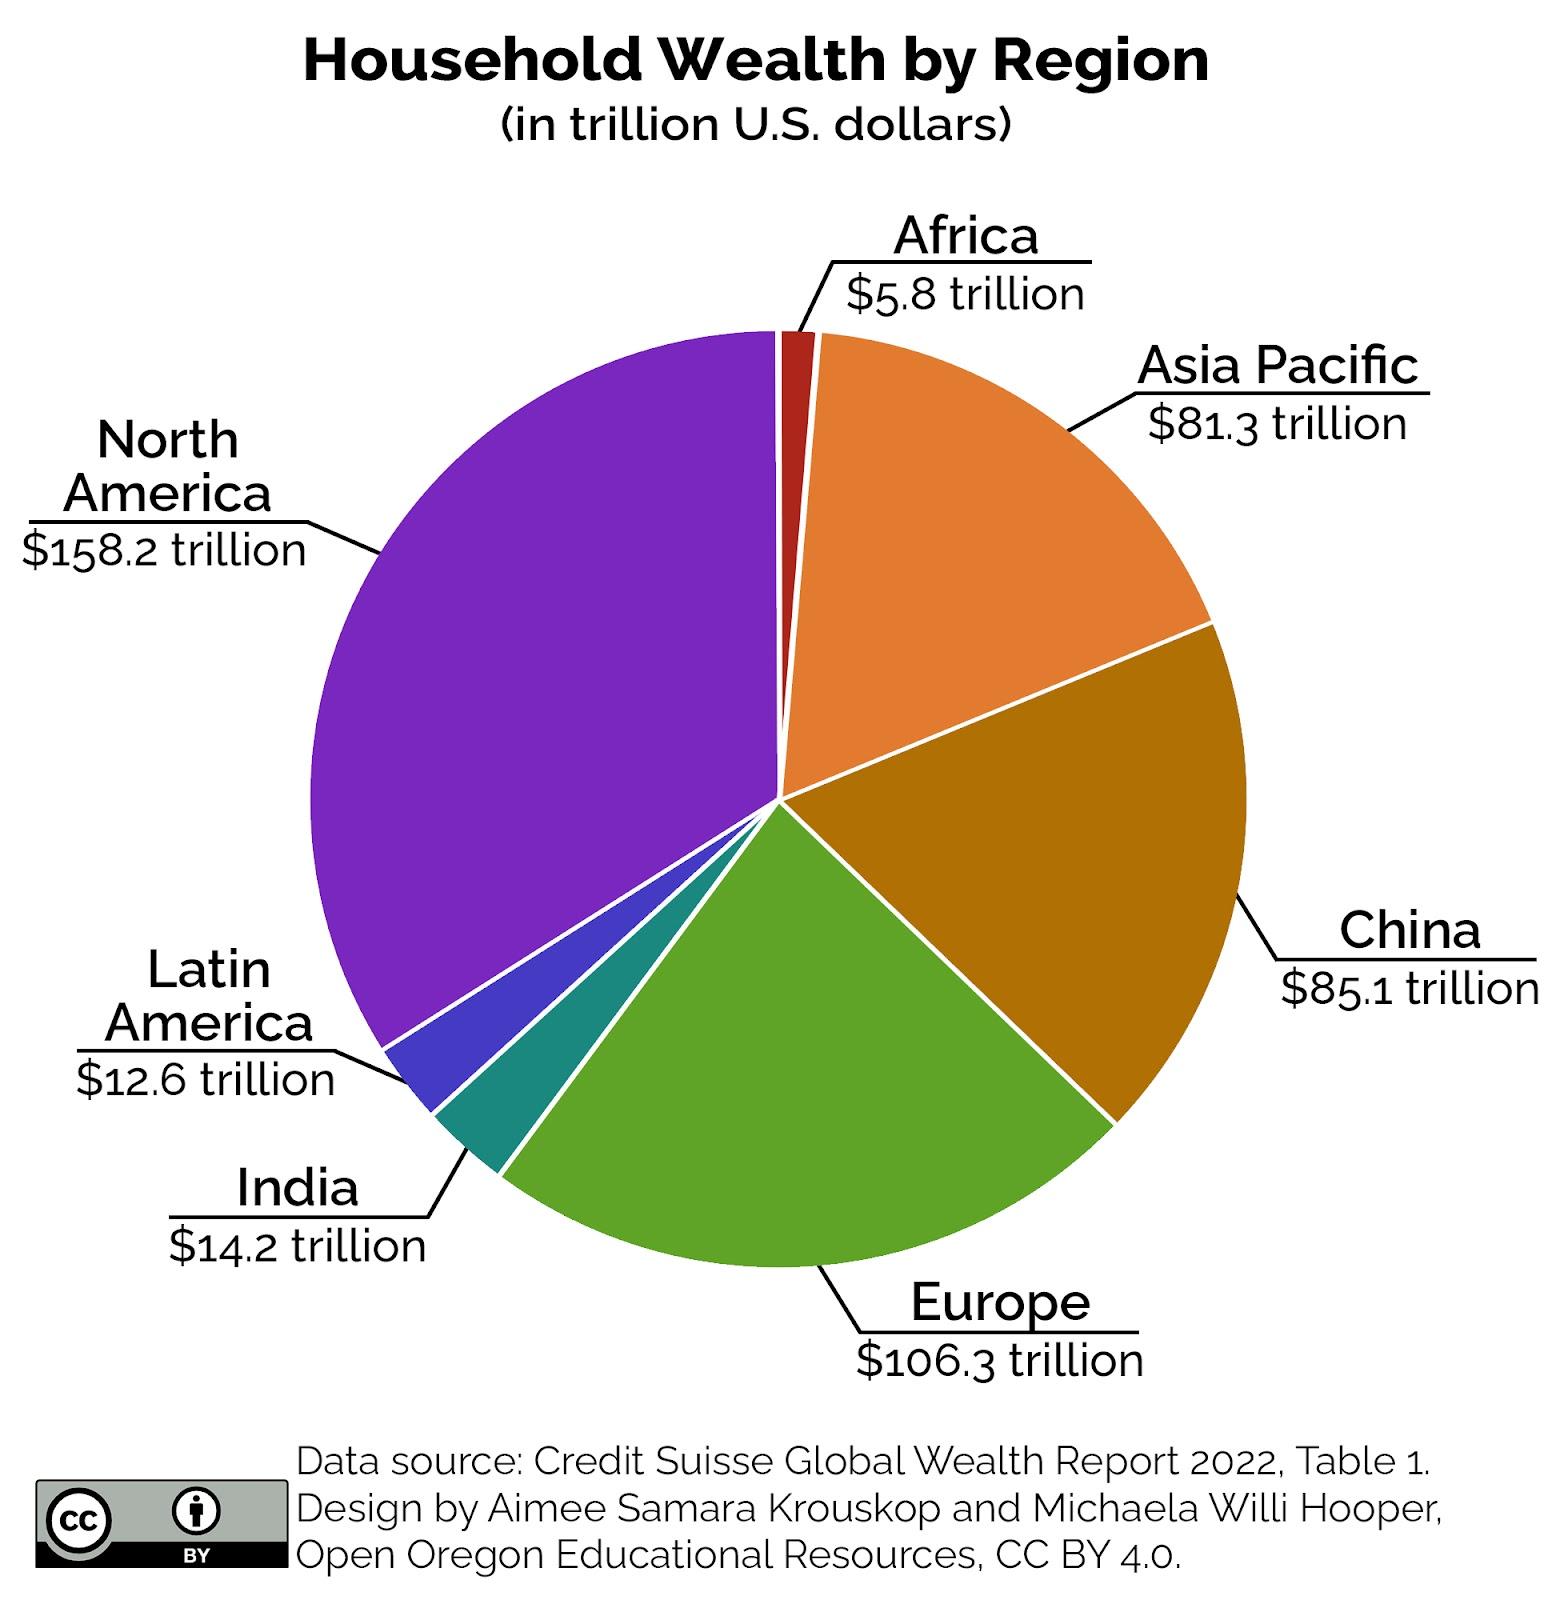
In order to determine the stratification or ranking of a country, economists created various models of global stratification. All of these models have one thing in common: they rank countries according to their economic status. First, we can measure global stratification between countries by wealth. Wealth refers to assets or physical possessions which can be converted into a form that can be used for transactions, minus their debts. Often this is calculated by household. Figure 4.4 shows the world’s regions by their total household wealth in 2021.
Finally, gross domestic product (GDP) is usually calculated annually and measures the monetary value of final goods and services produced in a country in a given period of time. It considers goods and services produced by residents, both domestically and abroad. This is a calculation of the value of items and services bought by the final user. Because the GDP indicates a country’s productivity and performance, comparing GDP rates helps establish a country’s economic health in relation to other countries. Some countries rise to the top, and others fall to the bottom.
Gross national income (GNI) measures the total income earned by residents of a country, including earnings from foreign sources. GNI is presented as per capita, or per person. It is calculated by tallying the dollar value of a country’s final income in a year, divided by its population. GNI is mostly used to compare economies according to their purchasing power.
Both GNI and GDP are used to gain insight into global stratification based on a country’s standard of living. Since their conception, GDP and GNI have been criticized for their limitations in three general ways. First, they are blind to environmental degradation; second, they poorly capture variations in human well-being; and third, they ignore inequality.
Economic Measures Within Countries and as Compared with Other Countries
One straightforward method of comparing economic inequality within countries is to use the 90/10 income inequality ratio: the wage or salary income earned by individuals at the 90th percentile (those earning more than 90 percent of other workers) compared to the earnings of workers at the 10th percentile (those earning higher than the bottom 10 percent). This method does not always provide a full picture of income inequality (it literally leaves out the middle). But it can provide insight. For example, a 90/10 ratio of five means that the richest 10 percent of the population earn five times more than the poorest 10 percent. We’ll look further into inequality within countries based on social location later in this chapter.
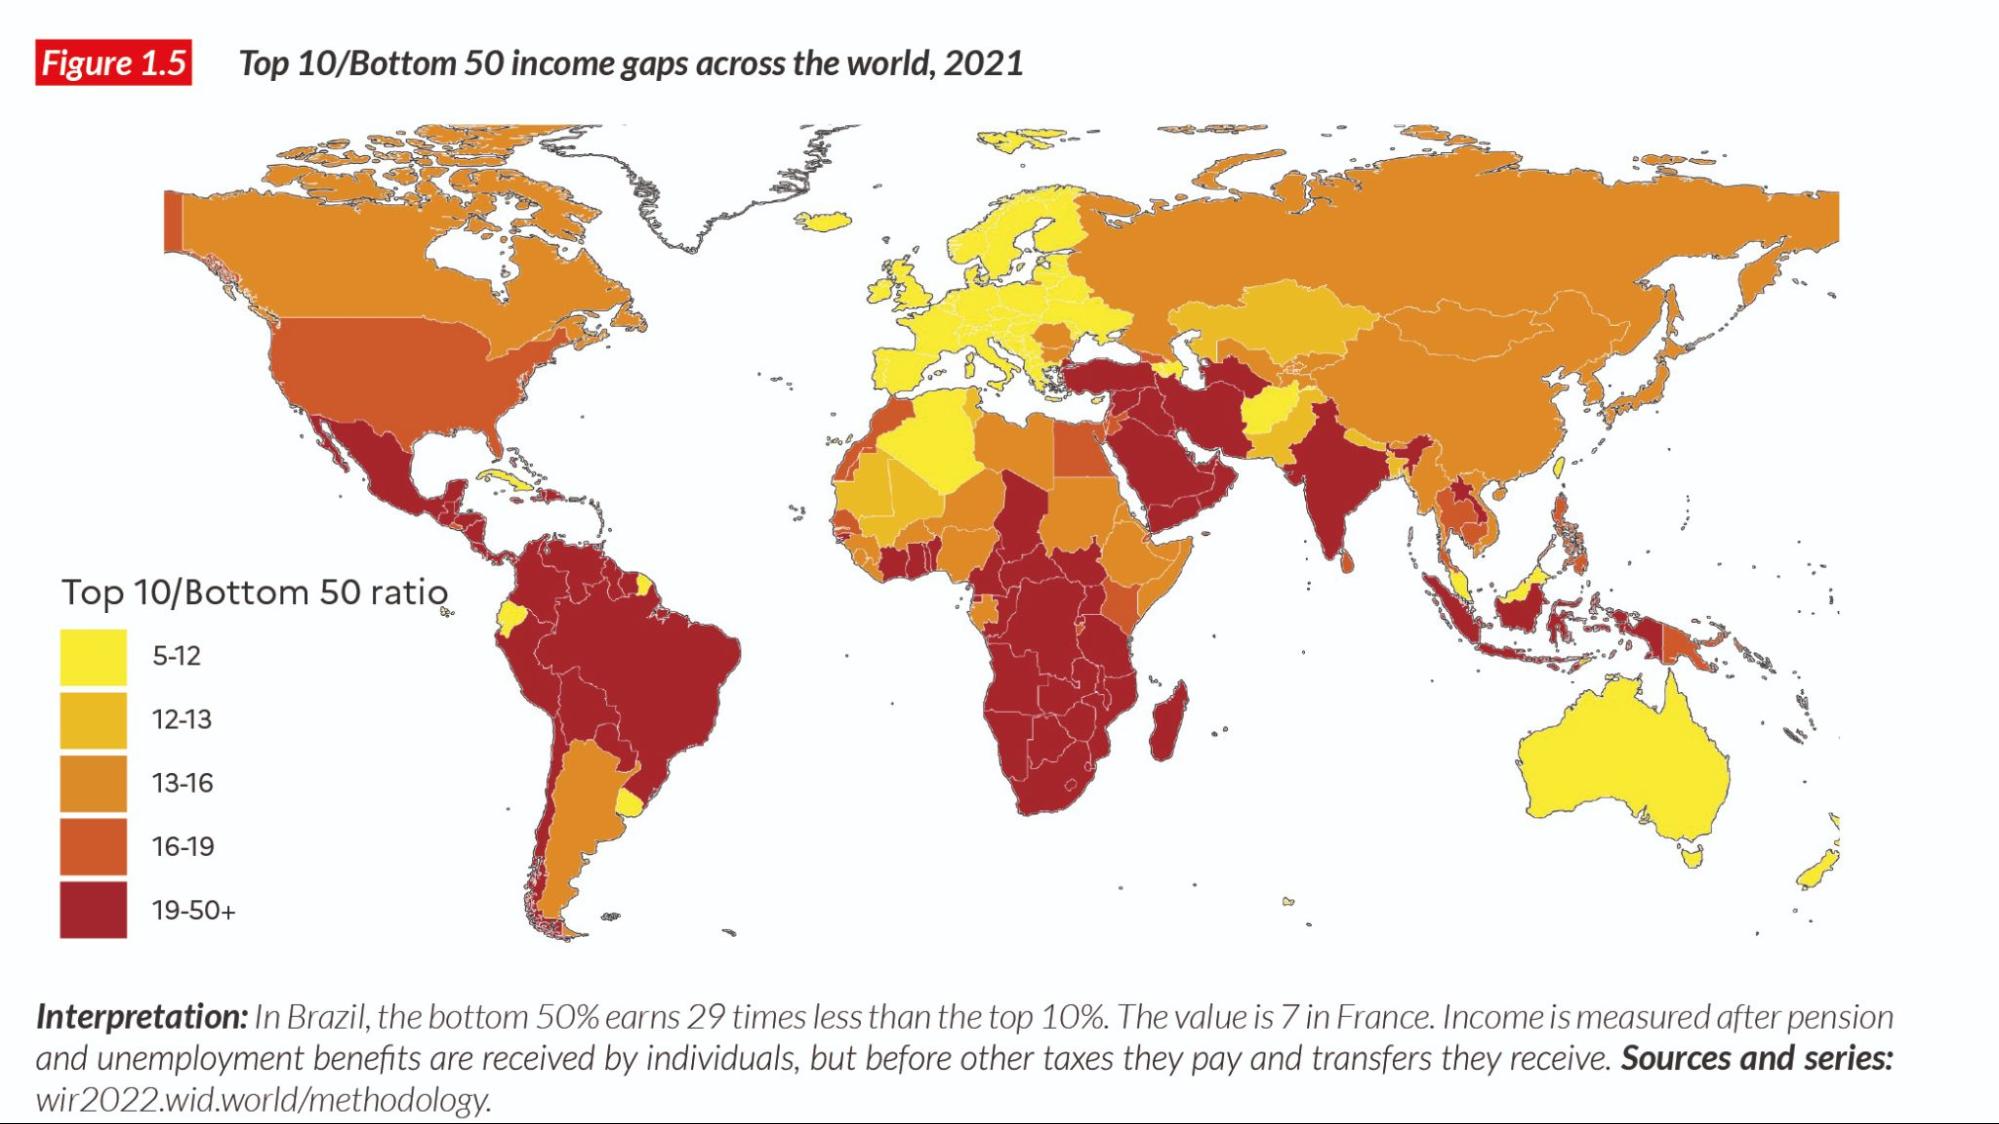
Researchers also compare the levels of internal inequality between countries. Take a look at figure 4.5. It’s a regional map that shows the top 10 and the bottom 50 income gaps across the world in 2021. Mexico, Central America, most of South America, much of middle and southern Africa, India, several West Asian countries (e.g., Saudi Arabia, Libya), experience some of the greatest income gaps. The United States is in the second tier, experiencing the second greatest income inequality, along with Egypt, Kenya, New Guinea, and other countries in dark orange. Algeria, Cuba, Ecuador, Afghanistan, and Australia, along with Western and Northern Europe, have the least internal inequality.
Licenses and Attributions for Measuring Global Stratification
Open Content, Original
“Measuring Global Stratification” by Aimee Samara Krouskop is licensed under CC BY-SA 4.0.
Figure 4.4. “Household Wealth by Region” by Aimee Samara Krouskop and Michaela Willi Hooper is licensed under CC BY 4.0. Data from Credit Suisse Global Wealth Report 2022, Table 1.
Open Content, Shared Previously
Figure 4.5. Top 10/bottom 50 income gaps across the world, 2021 is published in the World Inequality Report 2022 by World Inequality Lab, licensed under CC BY 4.0.
“Economic Measures Between Countries” is adapted from “9.3 Global Stratification and Inequality” by Tonja R. Conerly, Kathleen Holmes, and Asha Lal Tamang in Introduction to Sociology 3e, Openstax, licensed under CC BY 4.0. Household Wealth by Region Infographic added (figure 4.4).
The first paragraph of “Economic Measures Within Countries and as Compared with Other Countries” is adapted from a section in Chapter 10.1 Global Stratification and Classification by Tonja R. Conerly, Kathleen Holmes, and Asha Lal Tamang in Introduction to Sociology 3e, Openstax, which is licensed under CC BY 4.0.
figures, extents, or amounts of phenomena that we are investigating.
the extent of a person’s physical, mental, and social well-being.
a statistical estimate based on averages, of the number of years a person can expect to live in a certain region.
the unequal distribution of economic and social resources among the world's countries.
the financial assets or physical possessions which can be converted into a form that can be used for transactions.
the wage or salary income earned by individuals earning more than 90 percent of other workers, compared to the earnings of workers earning higher than the bottom 10 percent.
