
2.5 The Dark Figure of Crime
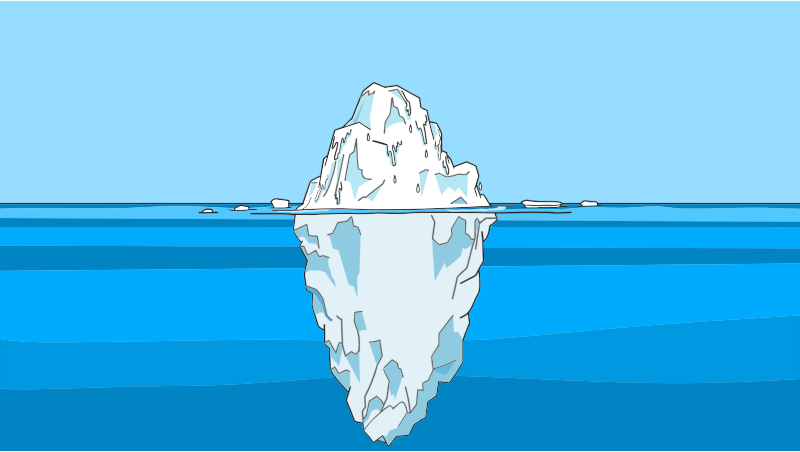
What does crime data have in common with an iceberg? Figure 2.15 is an incredibly useful illustration of crime and what our data sources are able to tell us about it. So far, we have talked about the two primary official sources of information on crime in the United States. The UCR provides us with data about crime that is reported to police, documented, and submitted to the FBI. The NCVS provides us with data about crimes that victims are willing and able to tell us about. In other words, these sources provide a picture of crime that we can see—the tip of the iceberg that sits above the water. What about everything else that is not reported or documented? This is known as the dark figure of crime and is represented by the majority of the iceberg that is under the surface and out of sight.
Why Crimes Go Unreported
Have you ever been the victim of a crime that you did not report or committed a criminal offense that no one found out about? Consider what circumstances could lead someone to not report a crime they witnessed or experienced. Let me give you an example. I used to live in an apartment complex where my car was stolen twice and broken into more times than I can count. Both times it was stolen, I reported the crime, the police found my car, and I eventually got it back. However, I only reported the first time it was broken into. Why? I learned very quickly that nothing good came of reporting the break-in. Reporting the break-in caused my insurance rate to increase and, because my insurance deductible was higher than the cost of having the locks fixed, I had to pay for the repairs out of pocket anyway. Furthermore, even if I didn’t report it directly, if there was a police report, the insurance company would find out about it and charge me more. Since they were not paying to fix the car, I did not want them to know about it. Plus, I knew the police were too busy to chase down whoever had stolen my cassette tapes (yes, cassette tapes!). I saw no point in involving the police or the insurance company, and I got to know the locksmith. That means for my car alone, although there were more than 10 break-ins, only one would ever have made it to the UCR and into our official crime statistics.
Choosing not to report something like someone stealing my Metallica tape may seem insignificant, but more severe crimes go unreported too, and the reasons for this go far beyond insurance rates (figure 2.16). The Bureau of Justice Statistics (BJS) reports that possibly more than half of violent crimes (nearly 3.4 million violent victimizations per year) went unreported to the police between 2006 and 2010. Reasons why a crime could go unreported include:
- The victim may not know what happened to them was, in fact, a crime.
- The person who committed the offense is a member of the family, a friend, or an acquaintance.
- The victim thinks what happened to them is not worth reporting.
- The victim fears retaliation.
- The victim also committed a crime.
- The victim does not trust the police.
- The victim does not want to discuss their victimization with others.
- The victim does not want to go through the lengthy criminal trial process.
Activity: Janell and Martin
Janell
Janell’s home was broken into again. This is the second time. Her laptop, tablet, and TV were all stolen this time. Last time, some hidden cash was stolen, but she had figured out a better hiding place, and this time it wasn’t touched. Janell did not call the police last time. She has not decided whether she will call them this time. The problem is, she knows who did this—both times—and she doesn’t want to turn in her own brother. He struggles with addiction, and she knows he steals to pay for the drugs. She doesn’t know if getting the law involved would help or make things even worse.
Martin
Martin’s little sister was sexually assaulted at a party. He just found out, and he is furious. She was drinking, and this guy saw that as an opportunity to victimize her. She does not want to go to the police. She said they won’t believe her, and they will treat her badly or even blame her because she was drinking. Plus, the guy will probably still get away with it anyway. Martin doesn’t agree with her but will support whatever she wants to do. He is thinking of handling it himself and making sure this guy pays for hurting his sister.
Discussion questions:
- How common do you think these examples are in the dark figure of crime? Why do you think decisions like these happen? What can or should be done about it?
- What are some consequences of crimes being underreported?
Crimes that go unreported can have a significant impact not only on our data sources but also throughout the entire system and field of criminology. Crime data that fails to capture the true extent of criminal offending may incorrectly influence crime prevention or treatment policies, funding for criminal justice agencies, and the development of theory. Remember, if we can understand crime, we can predict it, and if we can predict it, we can potentially prevent it, but only if the data we are using is complete and accurate!
Which Data Should We Use?
As criminologists, we are looking for the most accurate picture we can find of what is happening with crime so we can figure out why it occurs. Each type of data has pros and cons. Additionally, each source adds a bit of knowledge, making it more likely to produce a better picture of what is occurring, depending on the area of study. In other words, something is better than nothing, but the hope is that something is as good as it can possibly be.
Just because the FBI and BJS house our official stats on crime does not mean we cannot find helpful information about crime in other places. For example, the annual Monitoring the Future [Website] survey tracks substance use among youth in schools, while the National Survey on Drug Use and Health [Website] provides national estimates of substance use and mental illness in the United States. The Officer Down Memorial Page [Website] is a nonprofit organization that captures information on law enforcement deaths and collects information a little bit differently than LEOKA. Independent journalists and researchers have also started their own data collections, such as the Washington Post police shootings database (the Washington Post requires a subscription, which your library may provide access to). Links have been provided for these sources in case you want to learn more. We just have to be vigilant in how we understand and use different data sources. It is important to look at both methodology and potential biases.
For example, take databases on mass shooting incidents in the United States. Remember when we talked about operational definitions in Chapter 1? Each database may operationalize “mass shooting” differently, and that can really impact the numbers we see. Take a look at figure 2.17. Depending on which data source you looked at, you might think there were 6 mass shootings in the United States in 2019—or you might think there were 503. That’s a huge difference! Which source we use may depend on what type of information we are seeking. Is the location of the incident important to our question or theory? What about the motivation of the shooter?
| Data Source | Casualty Threshold (for injuries or death by firearm) | Location of Incident | Motivation of Shooter | Number of U.S. Mass Shootings in 2019 | Number of Mass Shooting Fatalities in 2019 |
|---|---|---|---|---|---|
| Mother Jones (Follman et al., 2020) | Three people fatally injured (excluding shooter) | Public | Indiscriminate (excludes crimes of armed robbery, gang violence, or domestic violence) | 10 | 73 |
| Gun Violence Archive (n.d.) | Four people fatally or nonfatally injured (excluding shooter) | Any | Any | 418 | 465 |
| Mass Shooter Database(Violence Prevention Project, n.d.) | Four people fatally injured (excluding shooter) | Public | Indiscriminate (excludes crimes of armed robbery, gang violence, or domestic violence) | 6 | 60 |
| AP/USA TODAY/ Northeastern University Mass Killings database ( Associated Press and USA Today, 2019; Callahan, 2019) | Four people fatally injured (excluding shooter) | Any | Any | 19 (in 2018) | 112 (in 2018) |
| Everytown for Gun Safety (2019) | Four people fatally injured (excluding shooter) | Any | Any | 19 (in 2018) | 112 (in 2018) |
| Mass Shooting Tracker (n.d.) | Four people fatally or nonfatally injured (including shooter) | Any | Any | 503 | 628 |
| Mass Shootings in America database (Stanford University Libraries, n.d.) |
Three people fatally or nonfatally injured (excluding shooter) |
Any | Not identifiably related to gangs, drugs, or organized crime | 62 (in 2015) | 202 (in 2015) |
When determining which data source is best, consider which one would provide the best statistics for the desired information. For example, the best data source for reported homicides in the United States may not be the best reference if we are seeking information about domestic violence rates or estimated drug abuse rates amongst teens in high school. The right source or sources will depend on the statistics being sought and the reason they will be used.
Check Your Knowledge
Licenses and Attributions for the Dark Figure of Crime
Open Content, Original
“The Dark Figure of Crime” by Taryn VanderPyl is licensed under CC BY 4.0. Revised by Jessica René Peterson.
Figure 2.15. Image by MoteOo is licensed under the Pixabay License.
“The Dark Figure of Crime Question Set” was created by ChatGPT and is not subject to copyright. Edits for relevance, alignment, and meaningful answer feedback by Colleen Sanders are licensed under CC BY 4.0.
All Rights Reserved Content
Figure 2.16. “Sexual assault and the Justice System: why so many victims don’t report” by The Independent is shared under the Standard YouTube License.
Figure 2.17. “Table 1. Variation in How Mass Shootings Are Defined and Counted” by Rosanna Smart and Terry L. Schell from Gun Policy in America, RAND Corporation, is included under fair use.
