
2.3 Federal Bureau of Investigation’s Uniform Crime Report
The FBI’s Uniform Crime Reporting Program (UCR) is the oldest, largest, and most commonly used crime data collection system. The UCR tracks the known occurrences of specific crimes that have been reported to the police and the number of arrests made as a result. The goal of the UCR is to gather and provide reliable information to law enforcement so they can make data-informed decisions in their policies and practices. Although the intended audience has predominantly been law enforcement, anyone is able and encouraged to access and use this database.
Activity: Local Crime Rates
Do you know what the crime stats look like in your local community? You have the option to find out by exploring the publicly available UCR website and their Crime Data Explorer tool [Website].
To look at the most recent data, follow steps 1–4, and answer questions 5 and 6.
- Go to the Crime Data Explorer and scroll down to “Explore by Location and Dataset.”
- Select “Crime” and your state (e.g., Oregon) under the dropdown boxes.
- You can then filter by agency—try your local county agency first (e.g., Jackson County Sheriff’s Office).
- Try your local municipal agency next if you have one (e.g., Medford Police Department).
- What differences do you see when you compare the two agencies?
- How can the information from both local agency types help create a picture of crime in your community?
This database is used by law enforcement, researchers, the media, students, and the public. It was started in 1929 by the International Association of Chiefs of Police to meet the need for reliable crime statistics for the country. In 1930, the FBI was put in charge of collecting, publishing, and archiving those statistics. In 2021, the FBI formally transitioned to a newer single data collection process.
There are over 18,000 city, university and college, county, state, tribal, and federal law enforcement agencies in the United States. They are all asked to voluntarily participate in the UCR program by submitting their data on the number of crimes reported and number of arrests in their jurisdiction to the FBI each month. Note that participation is voluntary. That means submitting data to the UCR is strongly encouraged, but it is not required.
The FBI recognizes the voluntariness of the program and that the contributing factors to crime rates cannot be represented in these data. They explain, “Since crime is a sociological phenomenon influenced by a variety of factors, the FBI discourages ranking locations or making comparisons as a way of measuring law enforcement effectiveness. Some of this data may not be comparable to previous years because of differing levels of participation over time” (FBI, 2022a). In addition to pointing out that voluntary participation means differing levels of reporting over time, they also specifically recognize that crime is not a simple, straightforward act. As criminologists argue, crime is influenced by many factors, and none of those are recorded in this (or any) database. In fact, no simple statistic can capture the complexity of criminal behavior. Nonetheless, this information is still important to collect and track, even though the methods are challenging.
Despite these challenges, the UCR has been our best source for knowing what is happening with crime on a national level. Many important decisions about crime patterns, budgeting needs, law enforcement initiatives, and other policies have been based upon the educated guess represented by the UCR.
With all this in mind, and prompted by feedback gathered from the law enforcement agencies that contribute to and use this data set, the FBI has been making improvements. To fill in more of the information gaps, the UCR now consists of five main data collections as shown in figure 2.4. We will briefly look at each of these data collections, their uses, and their strengths and weaknesses. Anytime you want to view the data from one of these data collections, you can use the FBI’s Crime Data Explorer tool [Website] to filter by dataset.
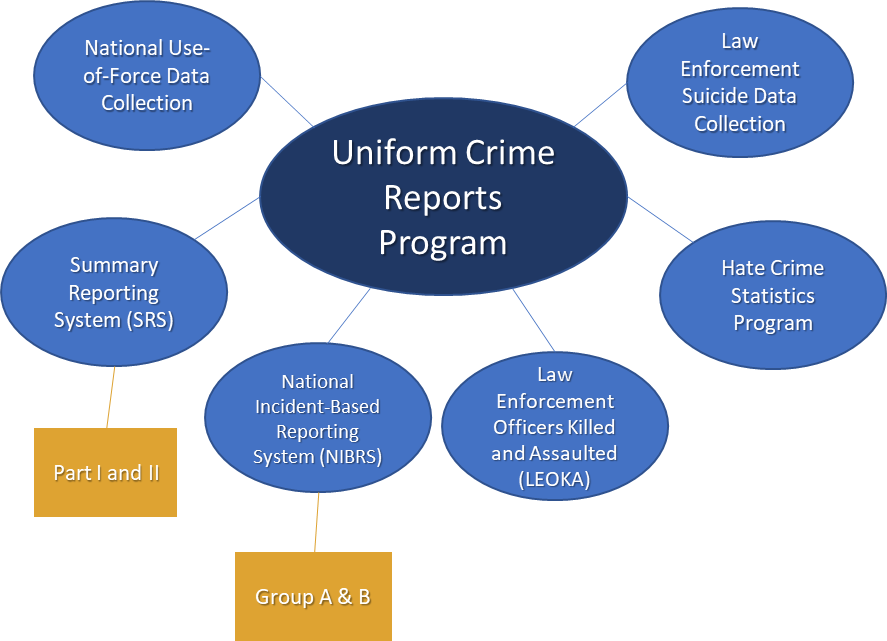
National Incident-Based Reporting System
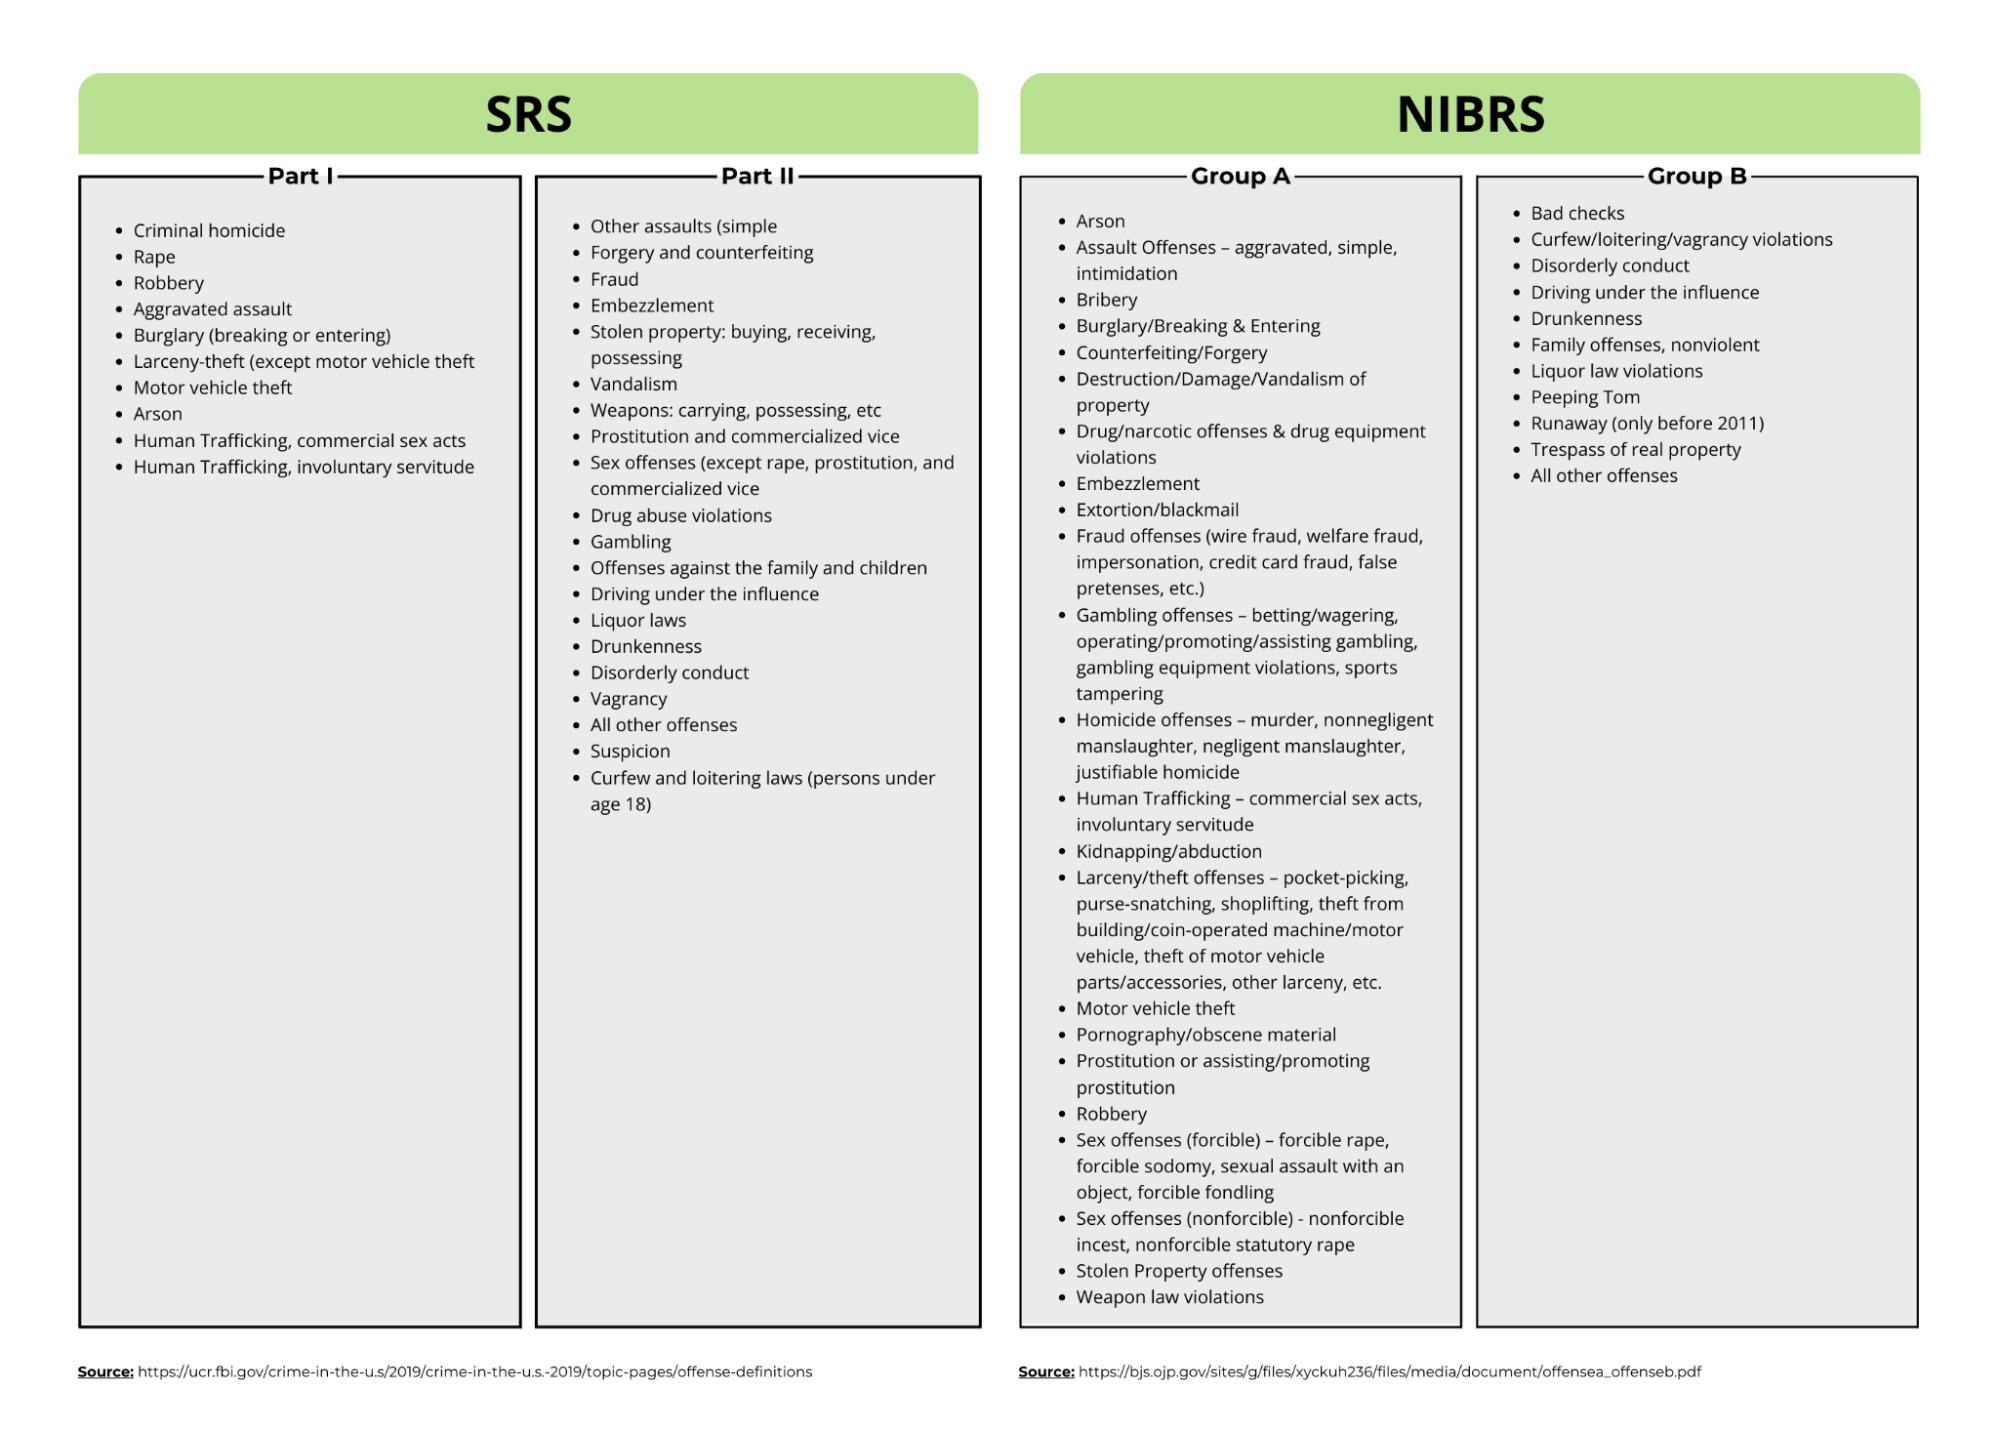
The FBI’s traditional method of collecting data for the UCR program was through the Summary Reporting System (SRS). Additionally, the National Incident-Based Reporting System (NIBRS) was created in the 1980s to improve the quality of crime data submitted by law enforcement agencies to the UCR. NIBRS collects data on 23 crime categories (Group A) and 52 offenses (figure 2.5). It also collects detailed information on each incident, including date and time, the demographics and relationship of the people involved, and location. NIBRS is unique because it collects data on crimes reported to the police as well as incidents where multiple crimes are committed, such as when a robbery escalates into a rape. That may seem obvious, but the SRS traditionally only tracked one crime per incident, so NIBRS has far more detailed information by comparison.
Let’s say that we wanted to know about murders in Portland, Oregon, during the summer of 2020. The SRS can give us the number of arrests that were made for murder during that time. In contrast, NIBRS can give us the number of arrests for murder plus the demographics of the people who committed murder and the people who were murdered, the relationship between them, the location of the murders, as well as whether any of them were under the influence of drugs or alcohol, if any property was affected during the murders, and if anyone involved was affiliated with a gang. NIBRS gives us more robust information and, consequently, a far more thorough understanding of what happened in this city. In other words, NIBRS paints a more thorough picture of the context surrounding each offense. See figure 2.5 to compare the crime categories collected through the SRS and NIBRS.
Because of the improved quality of data gathered through this system, the FBI transitioned the UCR program to NIBRS-only collection in January of 2021. However, the process has not been without issues. Switching to NIBRS may require technical assistance and is very costly for agencies. For example, the initial cost for setup in a South Carolina town of less than 30,000 people cost between $130,000 and $200,000. Federal grant funds are available to help agencies make the switch, but less than 60% of agencies were able to report via NIBRS throughout 2021, and the FBI was not able to release all of the quarterly data that year (Hanson, 2022). See figure 2.6 for a map of agency participation in April 2022.
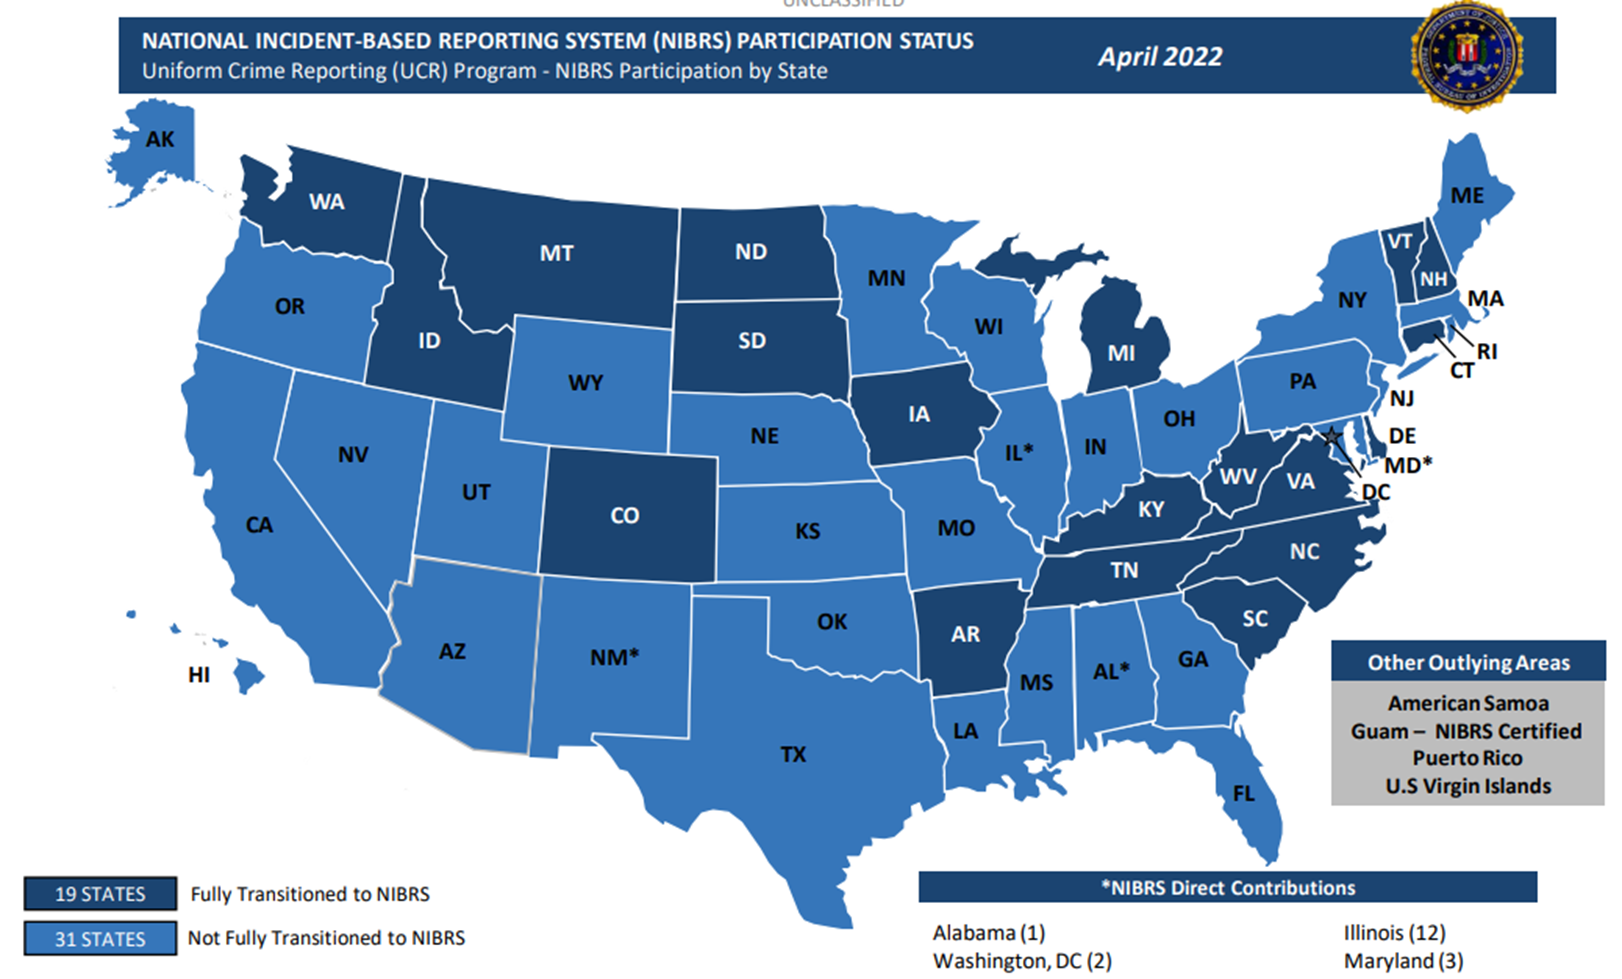
In 2022, the Los Angeles Police Department (LAPD), which had approximately 9,000 police officers, and the New York Police Department (NYPD), which had approximately 36,000 officers, did not report to the FBI. Since data from large metropolitan agencies can drive major crime trends both in their states and nationally, the absence of data of this scale can negatively impact the scope, accuracy, and representativeness of crime data more broadly. The FBI is continually working to fix these issues by assisting in American law enforcement agencies’ transition to NIBRS.
The FBI is hopeful regarding the future benefits of NIBRS and reports,
When used to its full potential, NIBRS identifies, with precision, when and where crime takes place, what form it takes, and the characteristics of its victims and perpetrators. Armed with such information, law enforcement can better define the resources it needs to fight crime, as well as use those resources in the most efficient and effective manner. (FBI, 2022c)
We must also consider what criminologists will be able to figure out when they, too, are “armed with such information.” Criminologists, in addition to law enforcement agencies, need this more complete information to try to understand why crimes occur, apply theories, and learn how to interrupt these patterns. For example, a criminologist may compare the NIBRS data for Portland, Oregon, in the summer of 2020 to the summer of 2019 to assess the impact of COVID-19. Remember, they are not just looking at what happened in terms of crime; a criminologist is trying to figure out why it happened. Data collections like NIBRS are an important piece of the puzzle when it comes to looking at the complete picture.
Hate Crime Statistics Data Collection
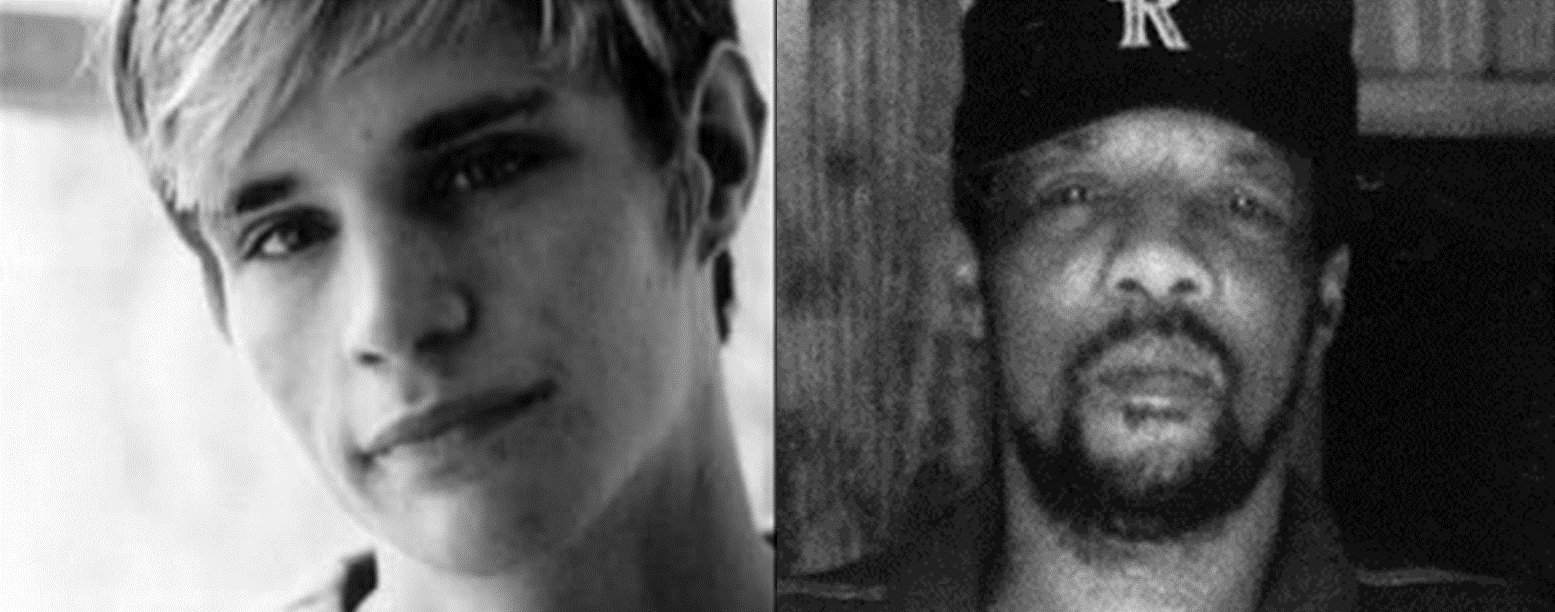
Congress passed the Hate Crime Statistics Act (101 U.S.C. § H.R.1048) in 1990 and updated it in 2009 through the Matthew Shepard and James Byrd, Jr. Hate Crimes Prevention Act (figure 2.7). If you are interested in some important laws and policies regarding hate crimes in the United States, you can read more about them on the Department of Justice website. The Hate Crime Statistics Act of 1990 was initially focused on collecting data related to “crimes that manifest evidence of prejudice based on race, religion, sexual orientation, or ethnicity.” It was the first law to recognize and include the LGBTQIA+ community. Additional bias categories have been added over time. For example, crimes related to disability were added in 1994, and gender and gender identity biases were added in 2009. In 2013, the religion category was expanded to include seven additional religions and anti-Arab bias motivation.
Crimes against any members of particular groups identified in this law are referred to as either hate crimes or bias crimes. Bias crimes are criminal acts based on a particular bias or prejudice. Criminologists follow the progression of hate crime legislation for a number of reasons, not the least of which is how it reflects historical changes in societal attitudes and practices.
The 1968 federal hate crime law was established in response to the civil rights movement to protect people from harassment or harm while they were trying to enjoy freedoms newly available to them, such as going to certain schools, living in certain neighborhoods, or working at certain jobs. Although these laws were beginning to be enforced, there was no central tracking system. The Hate Crime Statistics Act established the national data collection on bias-motivated crimes that became the responsibility of the FBI, although the act did more than what we are covering here. Thanks to this data collection, criminologists are able to look at the motives of hate and bias as criminogenic factors that influenced particular offenses as well as how those motives were influenced by changes in society.
The particulars of hate crime data collected for each incident include the following: bias motivation, victim type (individual adults, juveniles, businesses, institutions, or even society), information about the person who committed the offense, location type (there are 46 different location types, such as house of worship, school, or public transportation), and jurisdiction (federal, state, or local). If you would like to see the full list of bias categories, you can find them on the FBI’s Hate Crime Statistics web page.
For a recent example, consider the 2017 stabbing on the MAX Light Rail train in Portland, Oregon. One day after assaulting a Black woman on the public transit system, Jeremy Christian stabbed and killed two white men and injured a third when they tried to intervene in yet another hate crime incident. Christian, a white supremacist and white nationalist, was shouting racist and anti-Muslim slurs at two Black teenage girls on the MAX. Even in court, while witnesses and survivors were giving testimony, he continued his attack, yelling, “I should have killed you, bitch,” among other racist and hateful rants. Christian was found guilty and convicted of 15 counts, including aggravated murder, attempted aggravated murder, and first-degree assault. He was sentenced to two life sentences without the possibility of parole plus an additional 51.5 years. This is just one example of the type of offense recorded in the Hate Crimes Statistics database.
You may notice that this dataset centers the victim rather than the person who committed the offense. It also prioritizes the motive for the crime. Not only does this pull in two important areas of study in criminology—victimology and criminogenic factors—but this database captures a level of information that many do not.
Law Enforcement Officers Killed and Assaulted
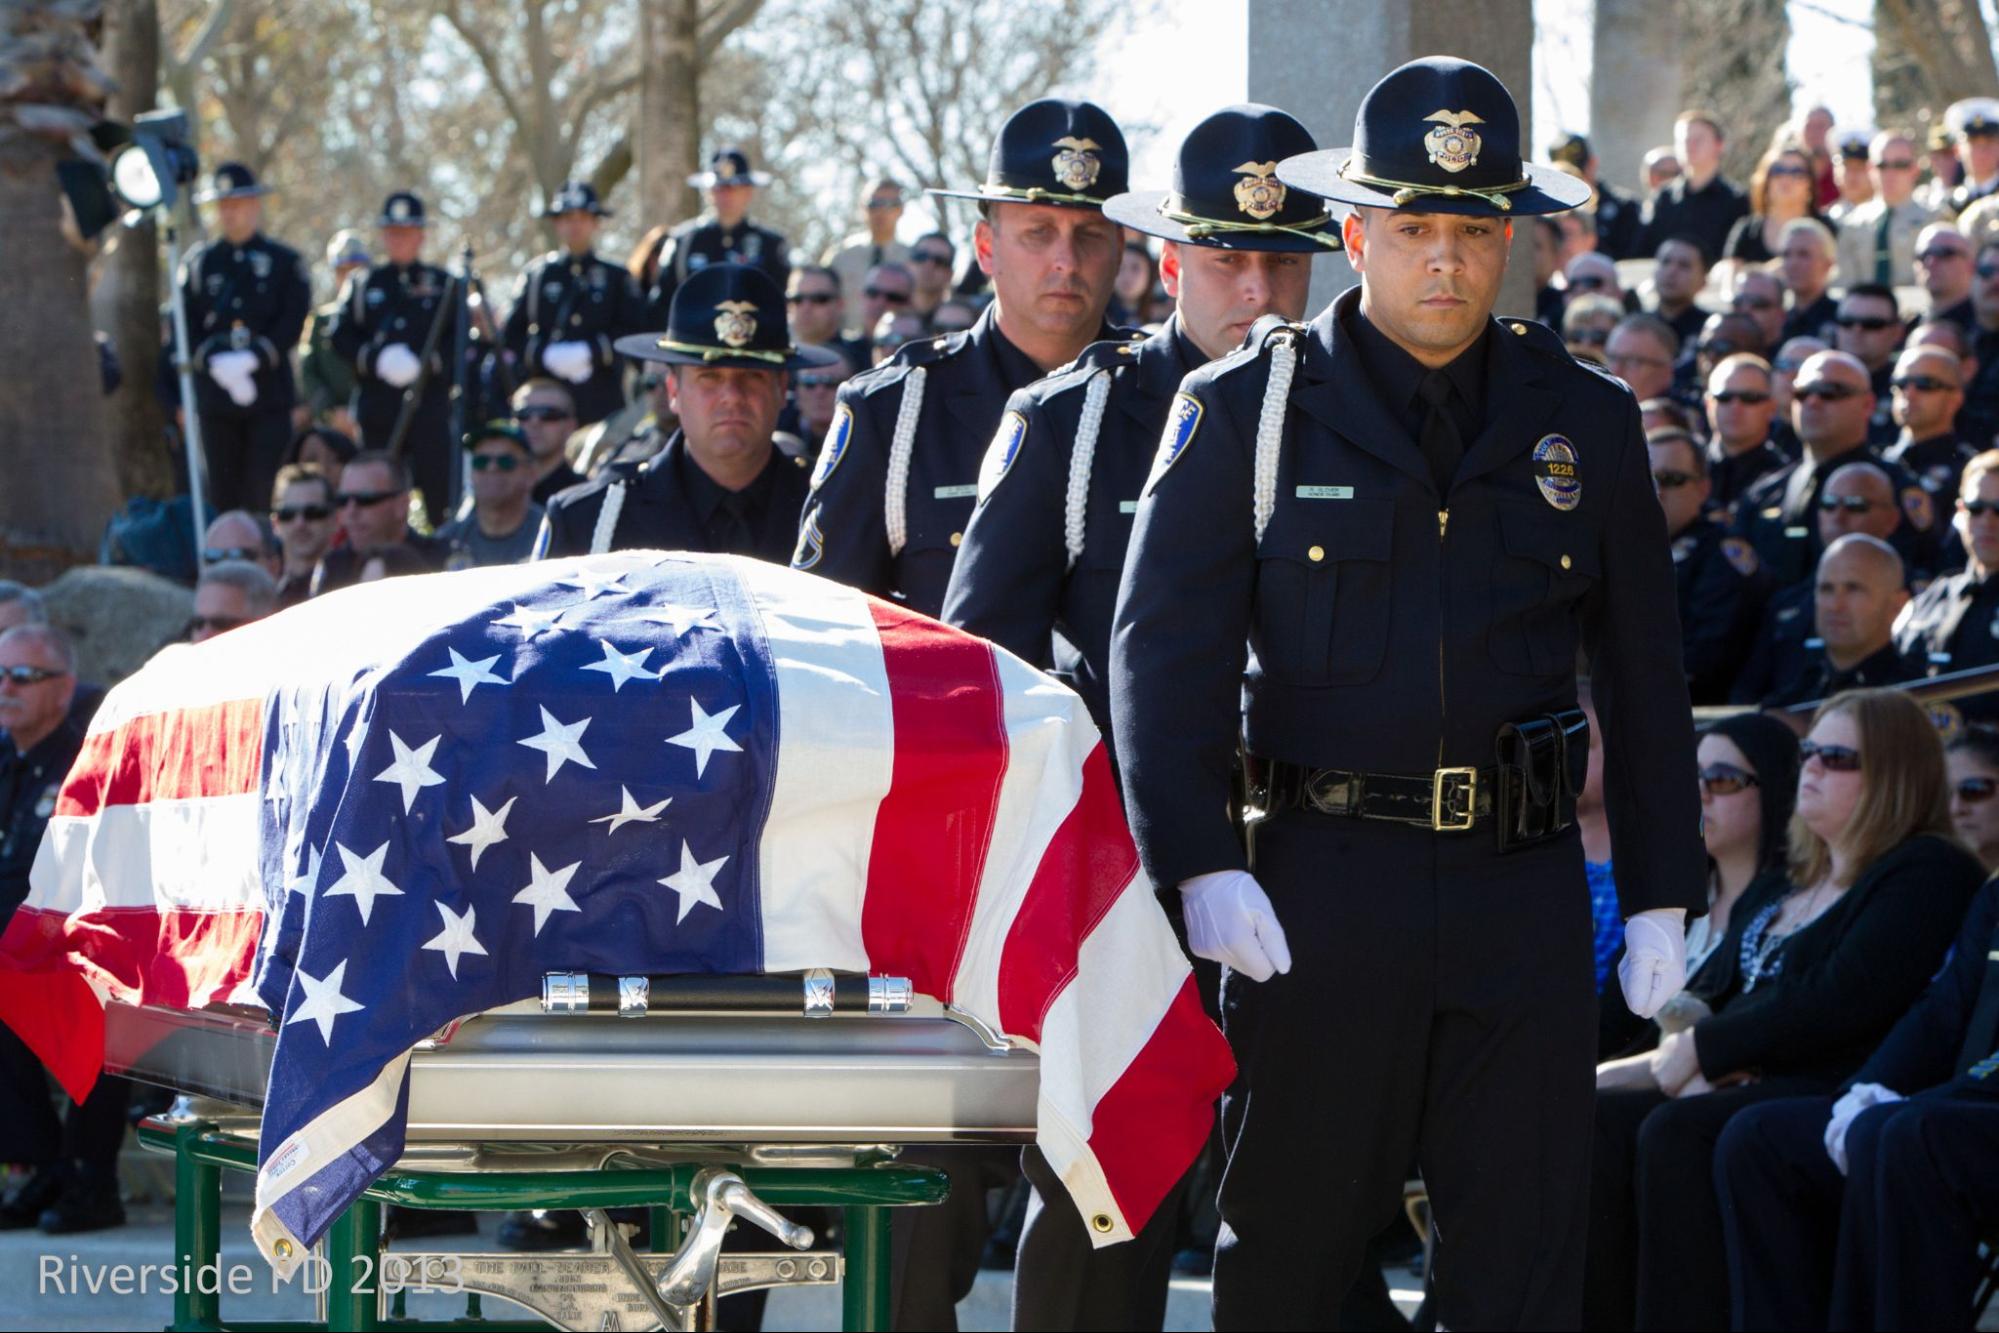
The Law Enforcement Officers Killed and Assaulted (LEOKA) database provides information on incidents in which law enforcement officers were killed or injured in the line of duty. The FBI explains, “The goal is to provide relevant, high quality, potentially lifesaving information to law enforcement agencies focusing on why an incident occurred, as opposed to what occurred during the incident, with the hope of preventing future incidents” (FBI, 2022b). Notice the focus here on why instead of what. That is a criminological approach to understanding the reasons and criminogenic factors that influence criminal behavior against this specific category of victim—law enforcement officers (figure 2.8).
LEOKA primarily focuses on deaths or injuries among police officers who are on the street interacting with the public. More specifically, it publishes data on felonious deaths (those resulting from willful and intentional acts by a suspect), accidental deaths (e.g., a traffic accident), and assaults of sworn city, university and college, county, state, tribal, and federal law enforcement officers who were acting in their official capacity when the injury or death occurred. This means that, generally speaking, LEOKA does not capture the injuries or deaths of officers that result from natural causes like heart attacks, suicide, or personal situations like domestic violence. Furthermore, it does not provide statistics on the deaths or injuries of corrections officers, court bailiffs, parole and probation officers, judges, attorneys, private security officers, or Federal Bureau of Prisons officers. This database is predominantly used by the FBI to inform their Officer Safety Awareness Training (OSAT) program. This program helps officers learn how to better recognize scenarios and circumstances that have an increased likelihood of fatal danger and trains them on prevention and new safety measures. If you are interested, you can learn more and view the LEOKA data on the FBI’s LEOKA Program website.
National Use-of-Force Data Collection
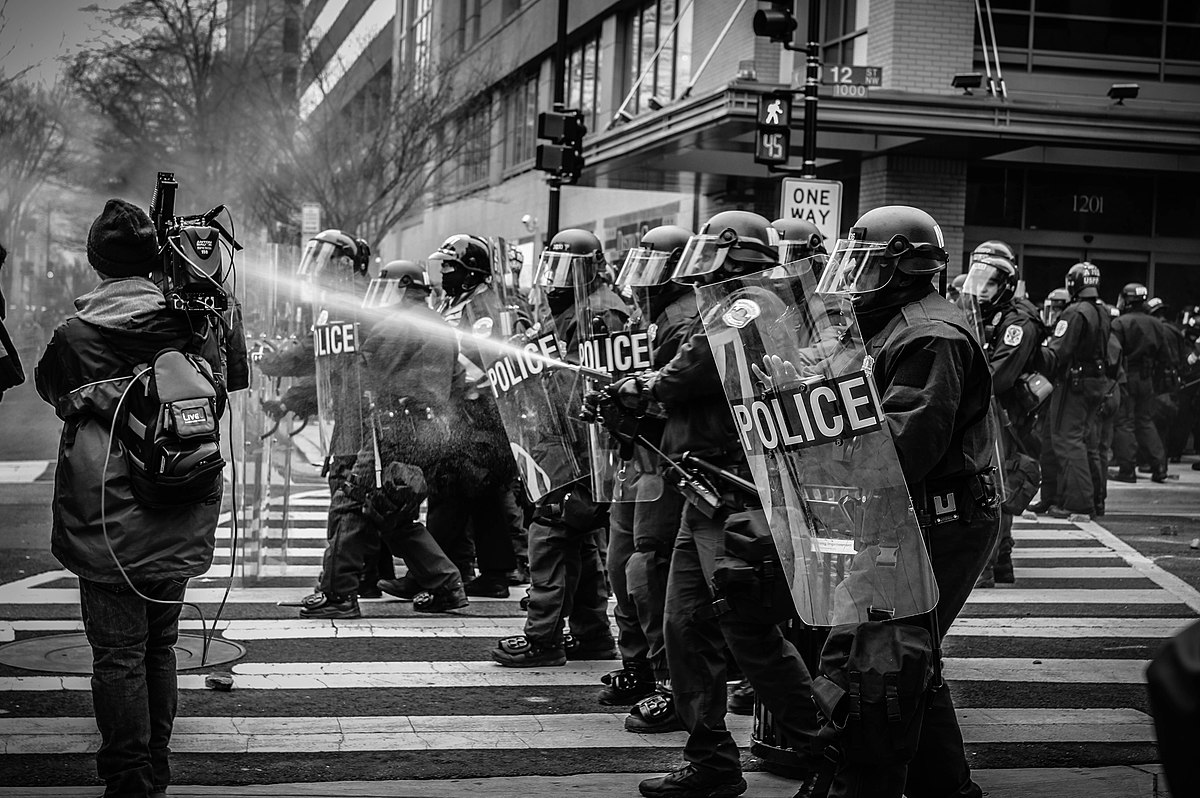
The National Use-of-Force Data Collection was created in 2015 to improve the collection of statistics on use of force by law enforcement with the goal of providing transparency and improving trust with the public, which is reflected in its slogan “Transparency. Accountability. Trust.” This relatively new data collection aims to improve the manner in which statistics about law enforcement’s use of force are collected, analyzed, and used.
The collected data includes any use of force that results in the death or serious bodily injury of someone and any time an officer fires their weapon at or toward anyone (figure 2.9). Importantly, the FBI notes, “The National Use-of-Force Data Collection offers big-picture insights, rather than information on specific incidents. The collection does not assess or report whether officials followed their department’s policy or acted lawfully” (FBI, 2022d). If you want to learn more about this database, you can view the Use-of-Force Data Collection’s website.
Law Enforcement Suicide Data Collection
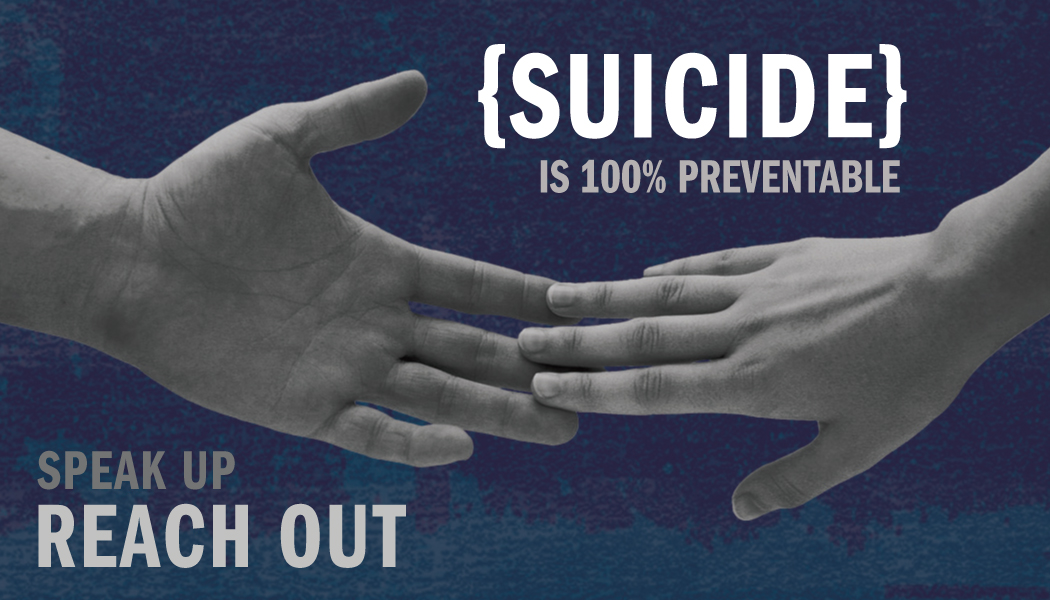
As the newest of the FBI’s UCR data collections, the goal of the Law Enforcement Suicide Data Collection (LESDC) is to learn more about the loss of current and former law enforcement officers, corrections employees, 911 operators, judges, and prosecutors to prevent future deaths by suicide and suicide attempts (figure 2.10). This database contains the circumstances and events that occurred before the death by suicide or suicide attempt, as well as the location, demographics, occupation, and the method used. The data submitted does not include any information that directly identifies the involved officer. LESDC opened in January 2022 for data submissions, and the first report was published in June of the same year. If you want to learn more from the FBI, see the LESDC website.
Limitations and Challenges
Each database has its own limitations and challenges. Completely reliable crime reporting is more complicated than it sounds. Remember that reporting to the UCR is voluntary. That means some of the 18,000+ agencies may not consistently submit their data in a timely manner every month. Consequently, the UCR may not be as accurate as needed for this database to be completely reliable. In other words, just because it is the largest and most commonly used source for crime data in the United States does not mean it actually gives us a complete picture of what is going on.
For example, some agencies may be more likely to report crime than others, which could skew what is known about the reality of crime in certain areas or among certain populations. If Agency A has a dedicated analyst who is really good at accurately compiling and submitting their agency’s reports in a timely manner to the FBI, we might see “more” crime in Agency A’s community than in communities with agencies that lack such a person.
Additionally, the number of arrests made in a given location is not necessarily equal to the amount of criminal activity occurring in that location. If Agency C’s chief and community members do not want to see juveniles enter into the criminal justice system and instead advocate for alternative programming for those who commit offenses, Agency C’s police officers will likely start making fewer arrests of juveniles. In this case, a downward trend in the number of arrests made by officers in Agency C does not really mean that the arrestable behavior has stopped or decreased. In contrast, let’s say Agency C decides to crack down on domestic violence and starts arresting someone on every home disturbance call. As the number of arrests for domestic violence increases, it might look like there is a spike in intimate partner violence. Such misunderstandings of the actual crime levels could potentially lead to inappropriate changes to policy and practices. Figure 2.11 summarizes some of the pros and cons of the UCR program, emphasizing what the data source can and cannot tell us.
| Pros | Cons |
|---|---|
| Stable methodology and collection methods have been established for nearly a century. | The program is not comprehensive; agencies are not legally required to participate, and some may be more inclined or able to report data than others. |
| Analyses are available at many geographic levels including by state, region, city, and agency; metropolitan versus nonmetropolitan; and so on. | NIBRS has improved data collection, but older data may miss crimes since it traditionally only counted the “most severe” crime per incident. |
| It includes data on multiple types of crime, including those against businesses, across all ages. | The transition period (2021) between the SRS and NIBRS reporting systems has been a major interruption to crime data trends. |
| Overall participation from law enforcement agencies is extensive. | It only tells us what is known to the police. Criminal behavior is not equal to arrests as some incidents might be handled informally. Arrest trends also represent changes in policies, norms, reporting, and so on. |
| Arrest data indicate that enough evidence existed about the reported crime to result in an arrest. | Arrests do not equal criminal convictions, and the UCR cannot tell us what happens in these cases after arrest. |
Learn More: Examples of What the Data Really Tells Us

Crime data in the UCR is only good when it is accurate. Even when it is, it might have as much or more to say about policy and society than crime itself (figure 2.12). To illustrate this phenomenon, let’s consider the Detroit Police Department’s rape and homicide reports, and national drug arrest trends for juveniles.
The Detroit Police Department has a scandalous history of inaccurate crime reporting. Journalists in the early 2000s looked at trends starting in the ’90s and found that the agency was responsible for both underreporting and overreporting offenses to the FBI. In 1999, the agency reported 790 rapes and 648 arrests for rape. This equals eight arrests for every 10 rapes, which far exceeded the national rate of arrests. The Detroit Police Department also reported arresting 27 people for every 10 murders, a rate that was three times the national rate for murder arrests. When such inaccurate data comes from a large police agency, it can severely skew national statistics.
According to the Monitoring the Future survey, national trends in lifetime use of any illicit substance by young people before leaving high school have fluctuated between about 41% and 66% since 1975, but they remained consistently around 50% between 2011 and 2018. However, between 2009 and 2018, arrests for drug use by juveniles decreased by nearly 60%. Although kids were steadily reporting use of drugs before age 18, arrest numbers did not tell the same story.
Overreporting of arrests can have a variety of effects on community members. For example, it may fuel fear among some because the increased arrests imply that more crime is occuring. Alternatively, it may give some residents a feeling of safety if they believe dangerous people have been arrested, even if there is no statistical local improvement in safety. Underreporting or overreporting crime may also benefit police departments and politicians in different ways. Perceptions of a safe city (underreporting crime) might help a politician get re-elected, while perceptions of a dangerous city (overreporting crime) could help agencies get more funding to hire more police officers. Additionally, assuming that a reduction or increase in arrests indicates an equal change in criminal behavior is not necessarily accurate.
Sources: (Fazlollah, 2001; Advance Local Media, 2009; Belluck, 2001; Johnston, et al., 2019; U.S. Department of Justice, 2018)
Check Your Knowledge
Licenses and Attributions for Sources of Federal Bureau of Investigation’s Uniform Crime Report
Open Content, Original
“Federal Bureau of Investigation’s Uniform Crime Report” by Taryn VanderPyl is licensed under CC BY 4.0. Revised by Jessica René Peterson.
Figure 2.4. “Five main data collections within the FBI’s Uniform Crime Report (UCR)” by Jessica René Peterson is licensed under CC BY 4.0.
Figure 2.5. “Compare the Traditional SRS Crimes with the NIBRS Crimes of the UCR” by Jessica René Peterson and Mindy Khamvongsa, Open Oregon Educational Resources, is licensed under CC BY 4.0.
Figure 2.6. “NIBRS Participation Status” by the FBI is in the Public Domain.
Figure 2.8. “Riverside Police Officer Michael Crain Memorial Service at Riverside National Cemetery” by DetectiveGreg is licensed under CC BY ND 2.0.
Figure 2.9. “grayscale photo of police riot team on pedestrian lane” by Spenser H is licensed under the Unsplash License.
Figure 2.10. “Suicide prevention-DOD” by the United States Department of Defense is in the Public Domain.
Figure 2.11. “What Does the UCR Really Tell Us? Table” by Jessica René Peterson is licensed under CC BY 4.0.
Figure 2.12. “jail-arrested-arrest-prison311-1-620×400” by BMN Network is licensed under CC BY 2.0.
“Federal Bureau of Investigation’s Uniform Crime Report Question Set” was created by ChatGPT and is not subject to copyright. Edits for relevance, alignment, and meaningful answer feedback by Colleen Sanders are licensed under CC BY 4.0.
All Rights Reserved Content
Figure 2.7. Images of Matthew Shepard and James Byrd Jr. included under fair use.
