
4.7 Measuring Social Inequality Within Countries
Although inequality between countries has generally narrowed, inequality within countries is rising (United Nations n.d.[a]). This is because economic growth derived from globalization tends to be unevenly distributed within countries. In 2015 all of the United Nations (UN) member states adopted a 2030 Agenda for Sustainable Development. It’s a “shared blueprint for peace and prosperity for people and the planet, now and into the future.” The agenda includes 17 Sustainable Development Goals. Goal 10 is to “reduce inequality within and among countries” (Department of Economic and Social Affairs n.d.). Let’s look at how some branches of the UN and other organizations identify and address internal inequality as a global concern.
The UN Department of Economic and Social Affairs reports that 71 percent of the world’s population lives in countries where inequality has grown (2019). The “Inequality – Bridging the Divide” page at the UN website shares that within-country inequality matters to UN work because these “are the inequalities people feel day to day, month to month, year to year. This is how people stack up and compare themselves with their neighbors, family members, and society.” They calculate economic differences, along with intersecting realities of social location, as they consider a country’s internal inequality (UNDESA n.d.).
While researchers tend to focus on economic inequalities, other aspects of social inequality are just as harmful. Stereotyping, prejudice, and discrimination (at times legally sanctioned) create and aggravate conditions of economic inequality globally, just as it does in the United States. Human rights organizations work to address these social inequalities, often applying the UN’s Universal Declaration of Human Rights (see that declaration in Going Deeper). Let’s look at how some international human rights organizations identify and address social inequality as a global concern.
Social Inequalities Based on Gender and Sexual Orientation
Global social research has focused on inequalities related to gender and sexual orientation over the last several decades, applying many tools to measure them. Figure 4.12 shows a map developed by the World Inequality Database [Website], an online tool providing interactive, visual data about global inequality. It offers insights into gender inequality between countries based on the percentage of income shared by women. Looking at their interactive map [Website], you can see how countries and regions differ in their share of female labor income.
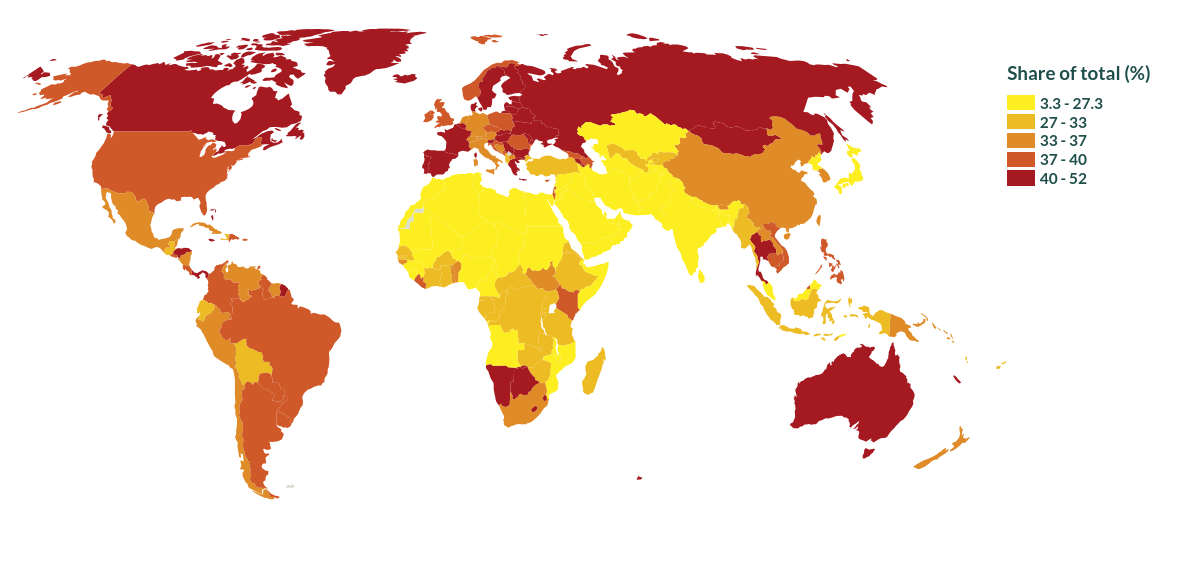
On the interactive version of that map [Website] you can also see the different indicators that the database uses to measure female labor income. You can choose to see two measures of average income: per adult national income or per adult GDP.
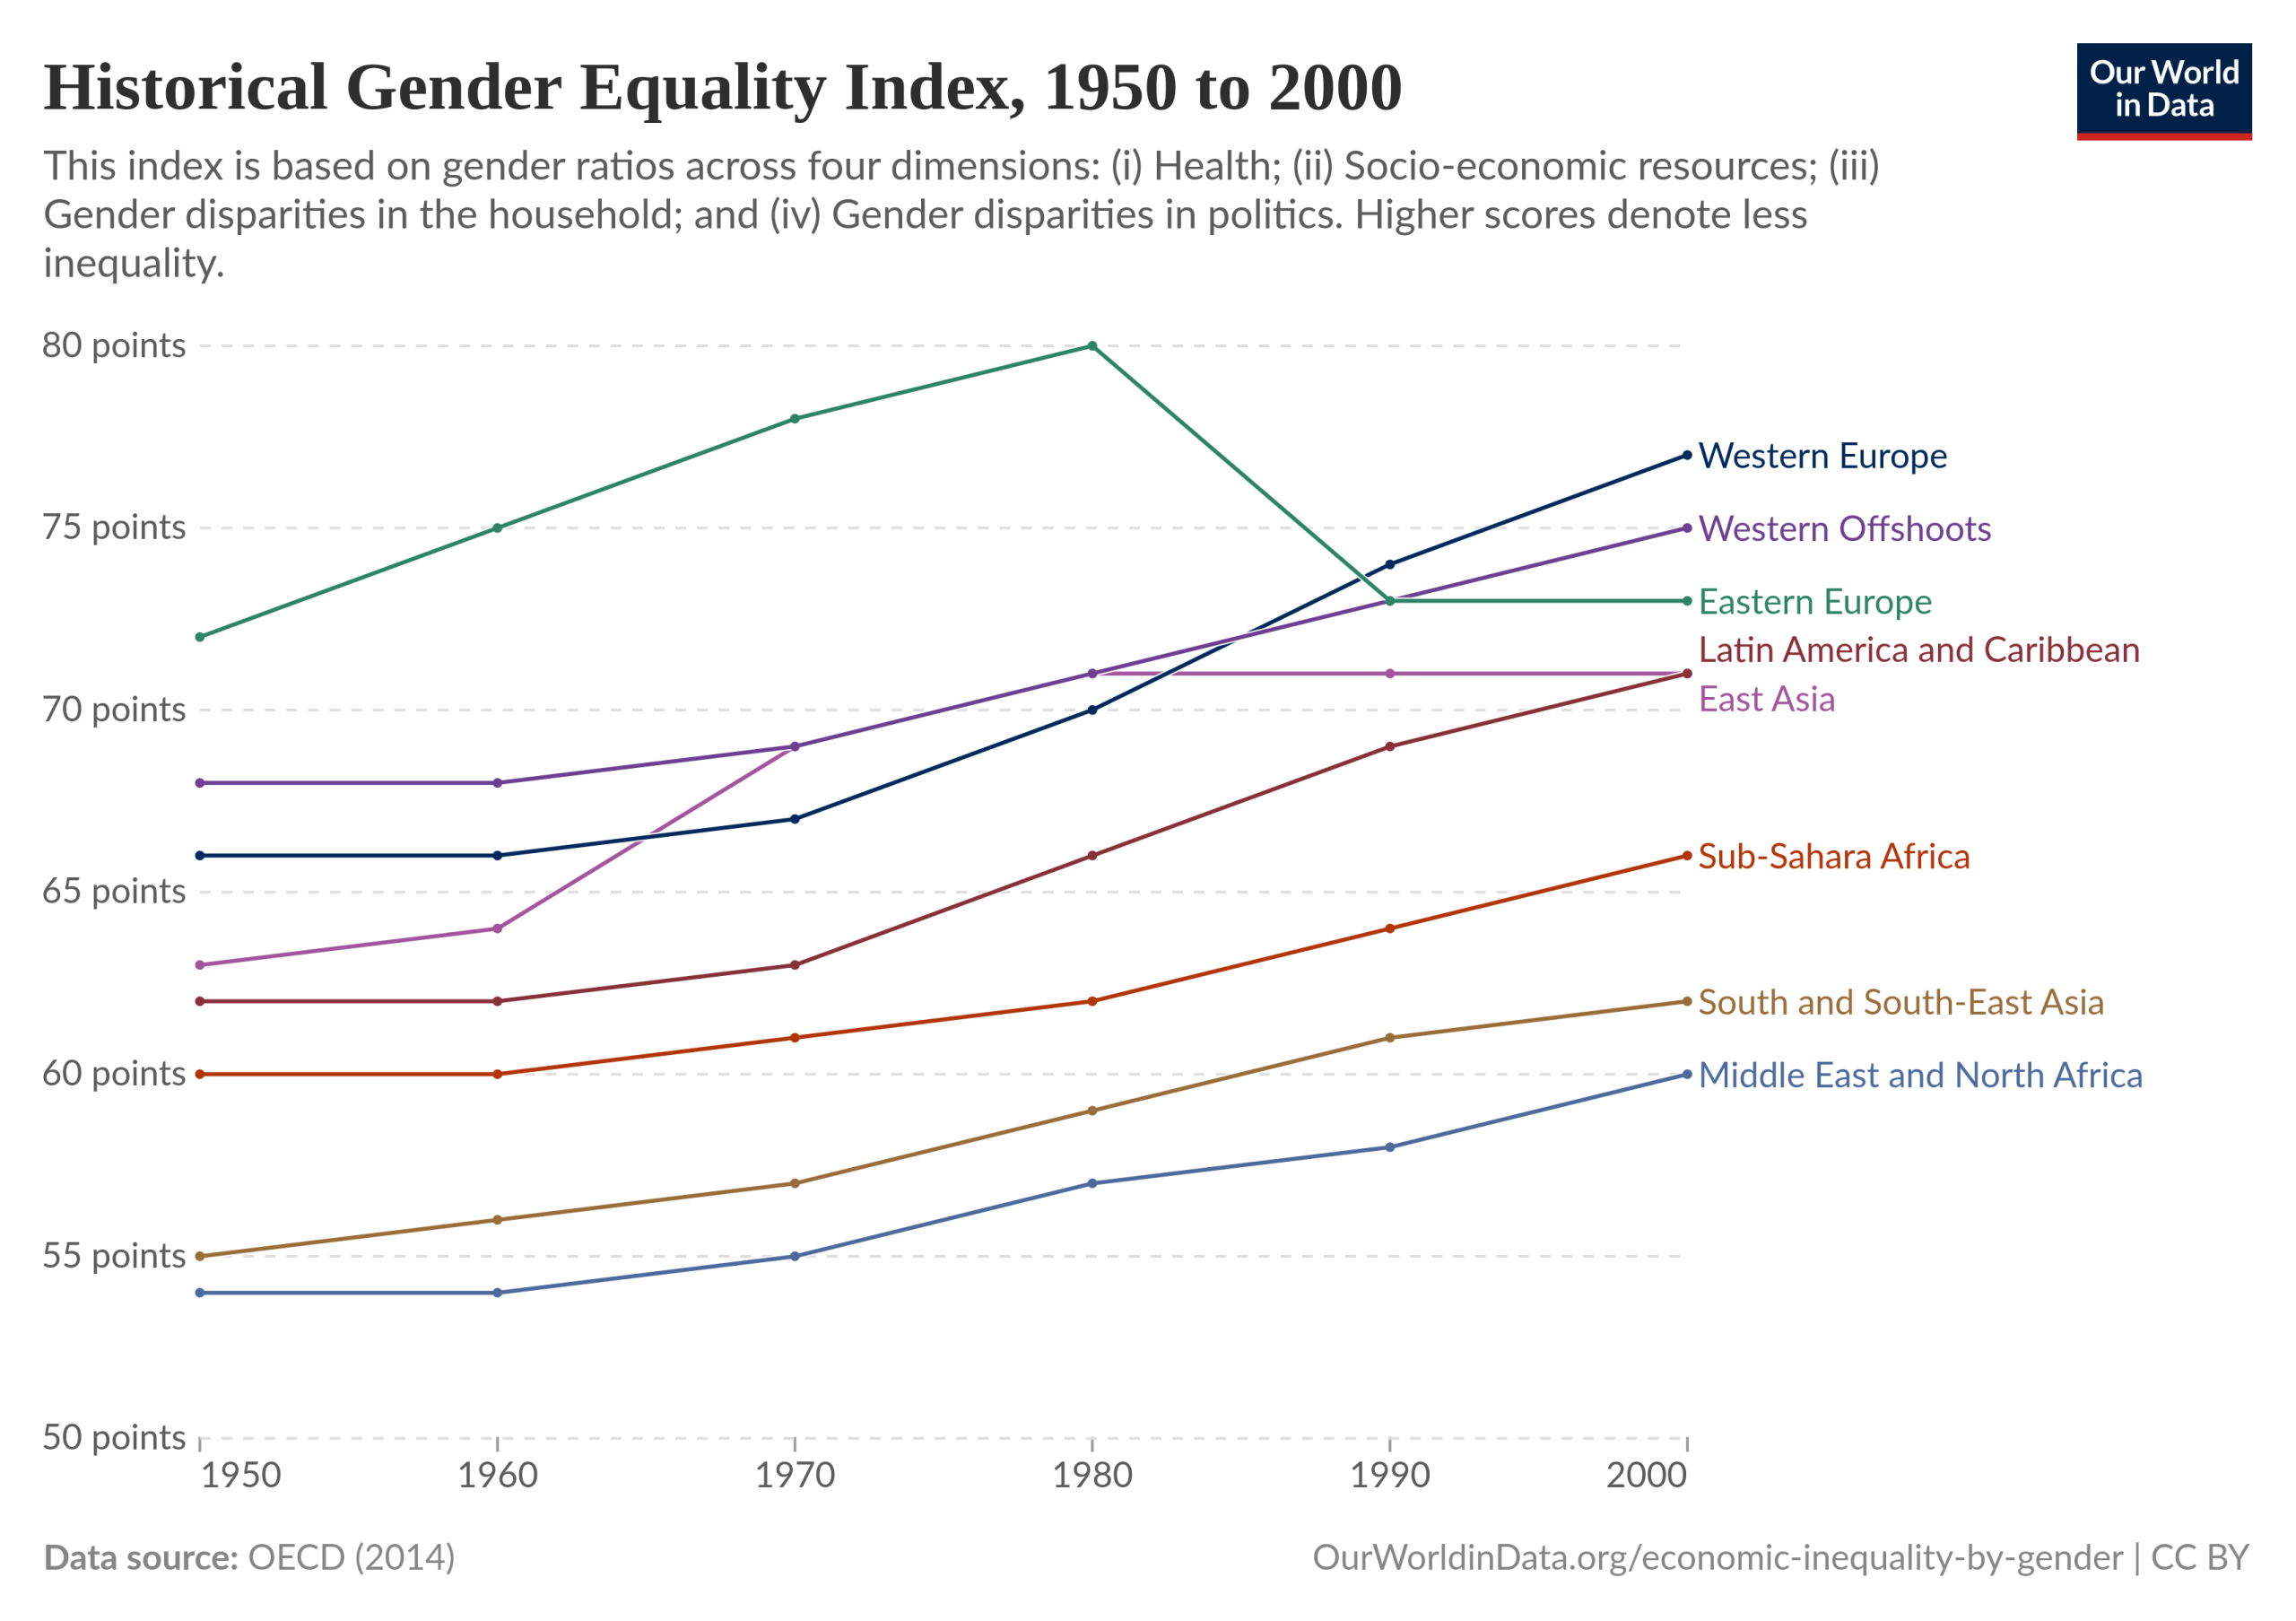
Another way to measure gender inequality is with the Gender Inequality Index. It focuses on:
- Health
- Socioeconomic resources
- Gender disparities in the household
- Gender disparities in politics
Figure 4.13 shows a snapshot of the Historical Gender Equality Index [Website] map at the World Inequality Lab website. (Optional: You can see how index scores changed between 1950 and 2000 across global regions by pressing “Play” on the map view at the link.)
The World Economic Forum produced a Global Gender Gap Report for 2021. Within, they note that the time predicted it will take to close the gender gap has increased by a generation, from 99.5 years to 135.6 years. This gap has been exacerbated by the COVID-19 pandemic (World Economic Forum 2021).
The social inequalities related to gender identity and sexual orientation presented in Chapter 3 are also present throughout the world. While people who identify as non-binary have always existed throughout the world, stigma and discrimination, as well as violence and oppression against gender-diverse people, are part of the story of internal global inequality. The lives of transgender people are also subject to stigma and discrimination.
While these concerns do not yet receive the same attention as inequalities surrounding women and girls, some organizations are tracking the issues and working to create change. For example, the organization Transrespect versus Transphobia Worldwide (TvT) documented 2,982 cases of reported killings of trans and gender-diverse people worldwide between January 2008 and September 2018. We know that these kinds of totals are low, as there are no reliable methods of capturing these crimes (Transrespect versus Transphobia Worldwide 2018).
Social Inequalities Based on Ethnicity and Race
Global research on global inequalities across ethnic lines has not been as robust as research on gender inequalities. However, some recent attention has been devoted to this topic. In 2021, researchers with the UNDP reported that inequality among ethnic groups is consistently stark in many countries. The report highlights that in Latin America, Indigenous Peoples are among the poorest, and that in India, five out of six multidimensionally poor people are from lower tribes or castes (UNDP 2021).
What do we know about global inequalities across racial lines? As part of the UN’s sustainable goals, the organization designated the years 2015 to 2024 as the “International Decade for People of African Descent.” The International Decade “…aims to celebrate the important contributions of people of African descent worldwide, advance social justice and inclusion policies, eradicate racism and intolerance, promote human rights, and assist in creating better, more prosperous communities” (United Nations n.d.[b]).
Take a few minutes to browse the UN pages dedicated to the International Decade for People of African Descent [Website] (figure 4.14). What inequalities do you see the UN is identifying with people of African descent? What initiatives do you see the UN working on to address inequalities with this population?

Let’s turn to South Africa as an example of how racial discrimination affects lives in a global context. During the 1950s and until the mid-1990s, there existed “Pass Laws” in the country that prohibited interracial sex and marriage and strictly segregated residential areas, schools, trains, buses, beaches, toilets, parks, stadiums, ambulances, hospitals, and cemeteries. These laws were similar to the state and local “Jim Crow” laws in the United States that legalized racial segregation.
Enforced with police brutality, the Pass Laws served as only part of South Africa’s system of apartheid, a policy or system of segregation or discrimination on grounds of race. It is one of the most extreme cases of institutionalized and legal discrimination in the world. Through decades of social movement, with many lives lost, apartheid in South Africa ended in the early 1990s. However, today South Africa still experiences one of the highest levels of inequality in the world (Sulla et al. 2022).
One of the areas where that continued inequality is noticed is in its apartheid-era architecture. This includes city planning that segregates communities along racial lines. Plans set Black townships (predominantly Black neighborhoods formerly organized by apartheid legislation) 40 kilometers away from town. This kind of architecture forces Black South Africans to spend 40 percent of their income commuting, making it difficult for communities to develop economic and gathering opportunities.
Watch this 2:40-minute video, “Apartheid Architecture” [Streaming Video], that introduces Wandile Mthiyan, CEO and cofounder of social enterprise firm Ubuntu Design Group (he was also previously an Obama Foundation Fellow and One Young World Ambassador) (figure 4.15).
In the video, Mthiyan explores the science behind apartheid architecture and explains how it continues to disenfranchise Black townships and shantytown communities 26 years after apartheid was abolished. As you watch, consider: How does architecture in your area support institutionalized racial segregation?
https://www.youtube.com/watch?v=oR-Puj3Ssx0
Going Deeper
Read the full UN Universal Declaration of Human Rights [Website].
World Inequality Database
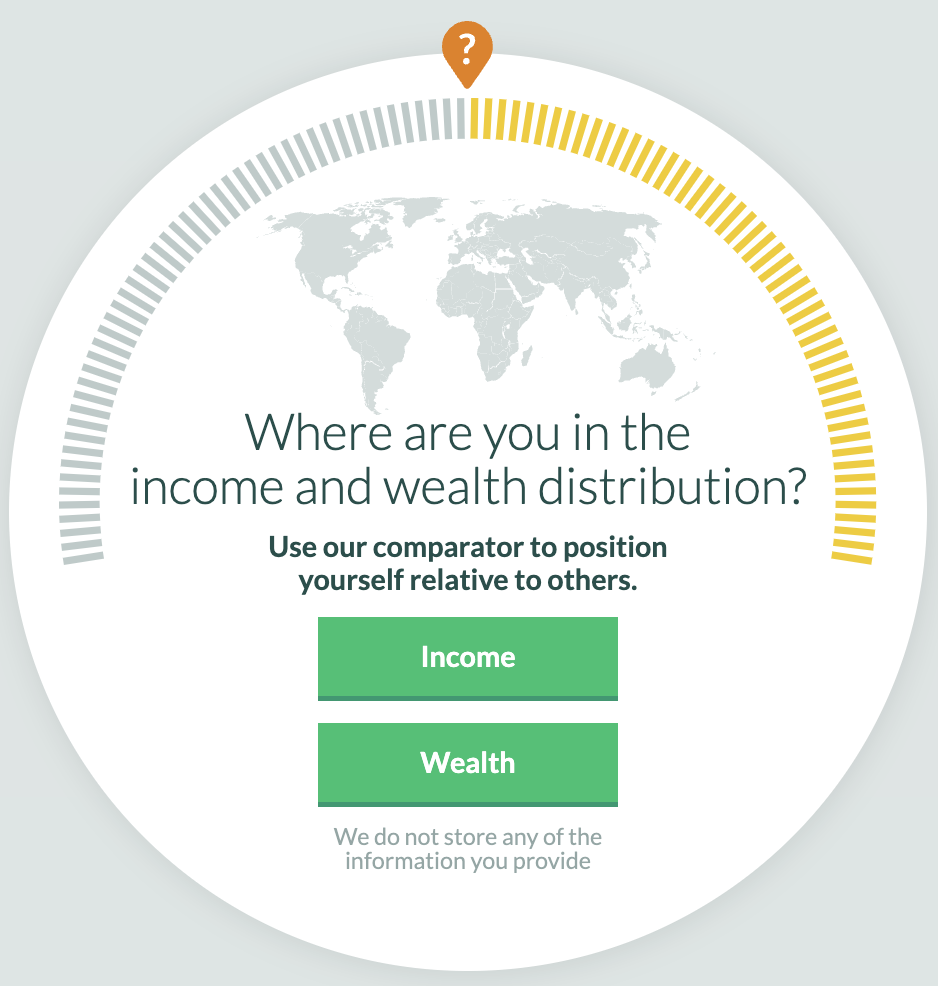
To learn about global inequality in relation to your life, take a look at the comparative tool provided by the World Inequality Database (figure 4.16). You can choose to make comparisons of your income or wealth within the United States or within other countries. Answer about five questions. Does anything surprise you?For more visual global inequality data, see the interactive “Worldview” page [Website] of the World Inequality Database [Website].For more on women and poverty, read Oxfam’s summary: “Why the Majority of the World’s Poor are Women” [Website].The Girl Effect
Read about global organizations working to bring resources to girls and bridge the gender inequity gap. Watch this pair of videos produced by the organization Girl Effect. The first, “The Girl Effect: The Clock Is Ticking” [Streaming Video], is 3:04 minutes long (figure 4.17). The second, “Yegna, the Sound of All of Us” [Streaming Video], is 2:42 minutes long and tells the story of a project supported by Girl Effect in Ethiopia (figure 4.18).To hear more about South Africa and apartheid architecture, watch “Why South Africa Is Still So Segregated” [Streaming Video] (10:15) and “Apartheid: The Rise and Fall of South Africa’s ‘Apartness’ Laws” [Streaming Video] (6:26).
Licenses and Attributions for Measuring Social Inequalities Within Countries
Open Content, Original
“Measuring Social Inequalities Within Countries” by Aimee Samara Krouskop is licensed under CC BY-SA 4.0.
Open Content, Shared Previously
Figure 4.12. “Female labor income share across countries” by World Inequality Database is licensed under CC BY 4.0.
Figure 4.13. “Historical Gender Equality Index, 1995–2000” by Our World in Data is licensed under CC-BY. Based on data from the Organisation for Economic Co-operation and Development (OECD 2014).
Figure 4.16. World Inequality Database income and wealth distribution tool by World Inequality Database is licensed under CC BY 4.0.
All Rights Reserved Content
Figure 4.14. Screenshot of the International Decade for People of African Descent 2015–2024 webpage by UN.org is included under fair use.
Figure 4.15. “Apartheid Architecture” by Wandile Mthiyane is licensed under the Standard YouTube License.
Figure 4.17. “The Girl Effect: The Clock Is Ticking” by Girl Effect is licensed under the Standard YouTube License.
Figure 4.18. “Yegna, the Sound of All of Us” by Girl Effect is licensed under the Standard YouTube License.
the growing interdependence of the world’s economies, cultures, and populations due to cross-national exchanges of goods and services, technology, investments, people, ideas, and information.
the unequal distribution of valued resources, rewards, and positions in societies.
figures, extents, or amounts of phenomena that we are investigating.
the extent of a person’s physical, mental, and social well-being.
the systemic and extensive nature of social inequity and harm woven throughout social institutions as well as embedded within individual consciousness.
a formalized sorting system that places students on “tracks” (advanced versus low achievers) that perpetuate inequalities.
a state where "everyone has fair access to the resources and opportunities to develop their full capacities, and everyone is welcome to participate democratically with others to mutually shape social policies and institutions that govern civic life.”
the laws and practices that requires disabled students be included in mainstream classes - not separate rooms or schools.
the physical separation of two groups, particularly in residence, but also in workplace and social functions.
a group of two or more related parts that interact over time to form a whole that has a purpose, function, or behavior.
a policy or system of segregation or discrimination on grounds of race
the financial assets or physical possessions which can be converted into a form that can be used for transactions.
differences in access to resources or opportunity between groups that are the result of treatment by a more powerful group; this creates circumstances that are unnecessary, avoidable, and unfair.
