8.4 Social Classes in the United States
In this section, we will explore how class operates in the United States. We will begin by exploring those high up in the class hierarchy and then discuss the middle class. We will end by examining poverty in the United States, how it is patterned, and explanations for its persistence.
Upper Class
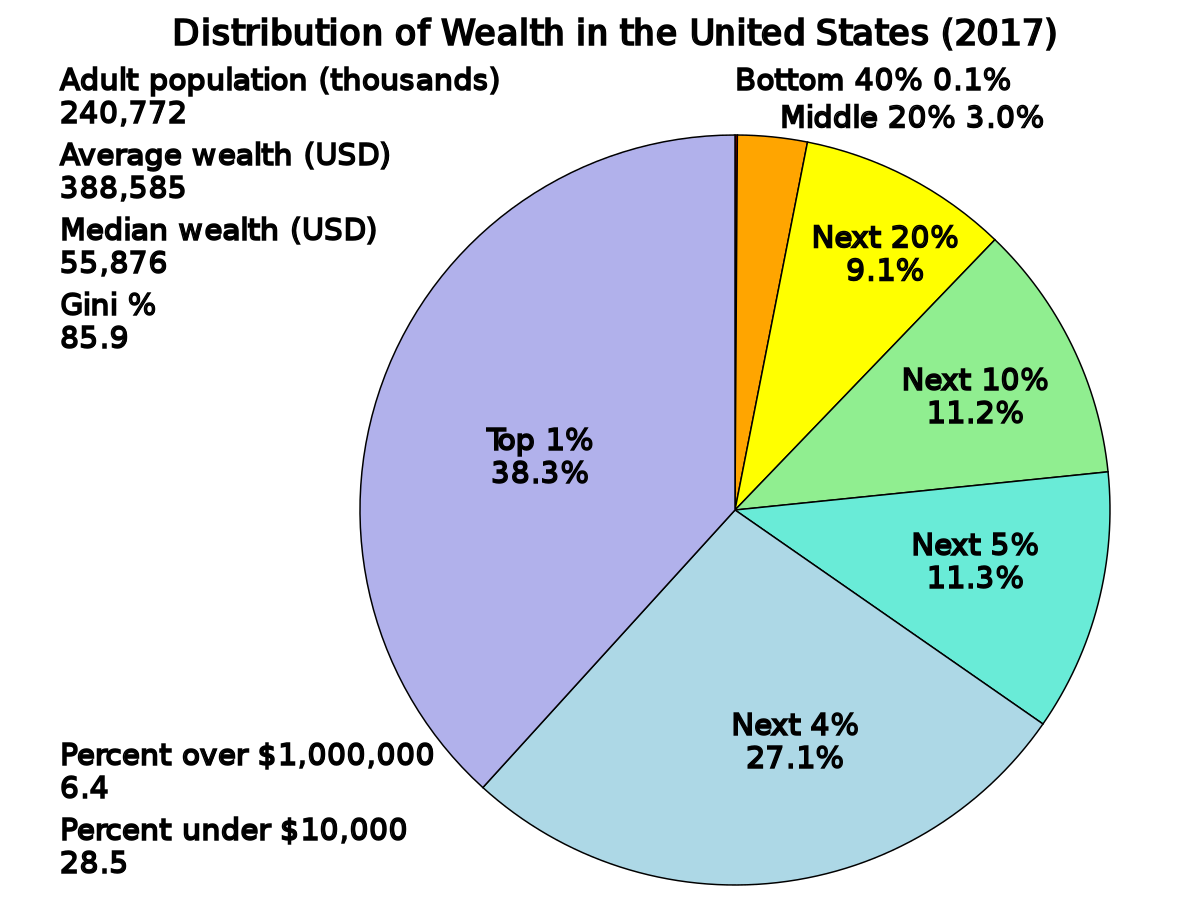
The upper class is at the top of the social hierarchy. In the United States, people with extreme wealth make up one percent of the population, and they own roughly one-third of the country’s wealth (figure 8.5) (Beeghley 2008).

Money provides not only access to material goods, but also access to power. As corporate leaders, members of the upper class make decisions that affect the job status of millions of people. As media owners of the major network television stations, radio broadcasts, newspapers, magazines, publishing houses, and sports franchises, they influence the collective identity of the nation. As board members of the most influential colleges and universities, they influence cultural attitudes and values. As philanthropists, they establish foundations to support social causes they believe in. As campaign contributors and legislation drivers, they fund political campaigns to sway policymakers, sometimes to protect their economic interests and at other times to support or promote a cause.
Sociologists have explored the composition and dynamics of the American elites. American sociologist C. Wright Mills coined them the “power elite” (2000) The power elite is the class in command of the major hierarchies and organizations of modern society. Mills points to the government, corporations, and the military as the three main institutions in which the elite circulate. As an example, someone who held a high position in the government might go on to serve on the board of a corporation. Someone who was a corporate executive (such as Michael Bloomberg, Mitt Romney, or Donald Trump) might then be elected to a high position in the government.
This interconnectedness of the power elite also takes place outside of formal institutions due to overlapping social networks and connected groups. Mills suggests that the power elite use a particular ideology to justify their location. They promote the belief that they have a finer moral character and that there is something about them that makes them “naturally” elite. In doing so, they downplay the importance of shared experiences and training in reproducing elite statuses. Furthermore, the power elite in the United States tend to deny that they are powerful.
American sociologist G. William Domhoff also studied elites in the United States. He found that they developed separate social institutions to help create social cohesion and mold wealthy people into the upper class (Domhoff 2021). This social cohesion develops from both common membership in specific institutions and friendships based on social interaction within the institutions.
Domhoff focuses on education and social clubs as areas where the upper class builds their cohesion and can reproduce itself. In terms of education, children of the upper class receive a distinctive education that socializes them into their privileged class position. This education starts in preschool and elementary school, with the kids of the upper class going to local private schools. As the children of the upper class get older, there is a strong chance that they will spend a few years away at a boarding school in a rural setting (Cookson and Persell 1985; Khan 2011). In terms of higher education, those from the upper class generally go to a small number of private colleges and universities (Karabel 2006; Stevens 2011).
Private social clubs also play an important role in the lives of upper-class adults. These clubs are formed around a variety of activities, with many families belonging to several types of clubs in different cities (Domhoff 2021).
Middle Class
Many people consider themselves middle class, but there are differing ideas about what that means. People with annual incomes of $150,000 call themselves middle class, as do people who annually earn $30,000. That helps explain why, in the United States, the middle class is broken into upper and lower subcategories.
Lower-middle-class members tend to complete a two-year associate’s degree from community or technical colleges or a four-year bachelor’s degree. Upper-middle-class people tend to continue to postgraduate degrees. They’ve studied subjects such as business, management, law, or medicine.

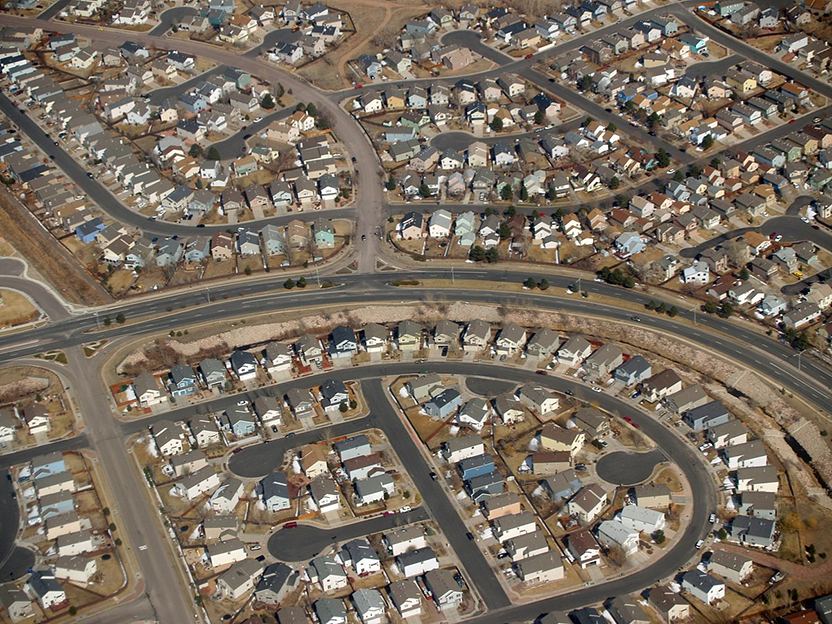
Middle-class people work hard and live fairly comfortable lives (figure 8.6). Upper-middle-class people tend to pursue careers, own their homes, and travel on vacation. Their children receive high-quality education and healthcare (Gilbert 2010). Parents can better support the specialized needs and interests of their children, such as more extensive tutoring, art lessons, and athletic efforts, which can lead to greater social mobility for the next generation. Families within the middle class may have access to some wealth, but they must also work to earn an income to maintain this lifestyle.
In the lower-middle class, people hold jobs supervised by members of the upper-middle class. They fill technical, lower-level management, or administrative support positions. Compared to lower-class work, lower-middle-class jobs carry more prestige and come with slightly higher paychecks. With these incomes, people can afford a decent, mainstream lifestyle, but they struggle to maintain it. They generally don’t have enough income to build significant savings. In addition, their class standing is more precarious than those in the upper tiers of the class system. When companies need to save money, lower-middle-class people are often the ones to lose their jobs.
Sociologists have conducted a variety of studies on the middle class. In one influential study, sociologist Michèle Lamont (1992) explored the symbolic boundaries that middle-class men drew to determine who was part of the middle class and who was not. Lamont found that the men drew boundaries based on cultural, socioeconomic, and moral criteria. Focusing on the socioeconomic criteria, she discovered that they associated money with freedom, control, and security. Money provided a certain comfort level that became a symbol and reward of professional success. It also provided cars, homes, and vacations.
The middle-class men also valued membership in prestigious groups and associations, including churches, chambers of commerce, political parties, and alumni associations. All of these organizations provide additional opportunities to meet other middle-class people and build connections with them. Furthermore, belonging to such groups and associations provides information on socioeconomic status, signaling that members have achieved a certain income level and that they’ve been accepted by the right kinds of people.
The middle class tends to raise their children in a particular way. They engage in what sociologist Annette Lareau calls “concerted cultivation.” Concerted cultivation is when parents “deliberately try to stimulate their children’s development and foster their cognitive and social skills” (Lareau 2003:5). To accomplish this, middle-class parents encourage their children to become involved in activities outside the home. This leads middle-class children to develop a set of skills and dispositions that help them navigate institutions that value such skills. As a result, the children start developing a sense of entitlement, the belief that they deserve these benefits.
Lower Class
The lower class is also referred to as the working class. Just like the middle and upper classes, the lower class can be divided into subsets: the working class, the working poor, and the underclass. Compared to the lower-middle class, people from the lower economic class have less formal education and earn smaller incomes. They work jobs that require less training or experience than middle-class occupations and often do routine tasks under close supervision.
Working-class people, the highest subcategory of the lower class, often land steady jobs. The work is hands-on and often physically demanding, such as landscaping, cooking, cleaning, or building.
Michèle Lamont (2000) also conducted a study looking at the boundaries drawn by working-class men. She found that, unlike men from the middle class, working-class men placed a stronger emphasis on moral boundaries. Emphasizing morality helped the workers maintain a sense of self-worth. The moral boundaries allowed them to affirm their dignity independently of their relatively low social status and to locate themselves above others. Particularly, they drew a line between themselves and the more economically advantaged whom they perceived as less morally pure.
Working-class families tend to engage in the accomplishment of the natural growth method of child-rearing. In this approach, families provide the basic necessities, which is an accomplishment given the harsh economic conditions they face. Parents assume that their children’s growth will occur naturally. As a result, there is less emphasis placed on participating in after-school activities. Instead, the children engage in child-initiated play with friends and family (Lareau 2003).
While there are benefits to this approach to raising children, our institutions tend to favor middle-class child-rearing techniques. For example, schools tend to expect heavy parental involvement. For working-class kids, this disconnect between their socialization and what institutions expect from them leads to a sense of constraint (Lareau 2003; Calarco 2018).
Beneath the working class is the working poor. They have unskilled, low-paying employment. Their jobs rarely offer benefits such as healthcare or retirement planning, and their positions are often seasonal or temporary. They may work as migrant farm workers, house cleaners, or day laborers. Member education is limited. Some lack a high school diploma.
How can people work full-time and still be poor? Even working full-time, millions of the working poor earn incomes too meager to support a family. The government requires employers to pay a minimum wage that varies from state to state and often leaves individuals and families below the poverty line. In addition to low wages, the value of the wage has not kept pace with inflation. “The real value of the federal minimum wage has dropped 17 percent since 2009 and 31 percent since 1968” (Cooper, Gould, and Zipperer 2019). Furthermore, the living wage, the amount necessary to meet minimum standards, differs across the country because the cost of living differs. Therefore, the amount of income necessary to survive in an area such as New York City differs dramatically from a small town in Oklahoma (Glasmeier 2020).
A Closer Look: Wealth and Inequality in the Western United States

Recently, some sociologists explored class disparities in small towns across the Western United States. In his book Billionaire Wilderness: The Ultra-Wealthy and the Remaking of the American West (2020), Justin Farrell examines the class relationships between billionaires/millionaires and working-class people in Jackson, Wyoming. He found that billionaires and millionaires were attracted to Wyoming not only because they wanted to be “closer to nature” and authentic rural communities but also because living in Wyoming offered significant tax breaks. The resulting high concentration of wealthy people created the “richest county in the United States and the county with the nation’s highest level of income inequality” (Farrell 2020:3).
For the billionaires, the natural environment provided “therapeutic” experiences and became the focus of their engagement with the community. Instead of supporting organizations that provided social services, the ultra-wealthy turned their philanthropic efforts toward environmental and arts organizations, what Farrell calls “gilded green philanthropy.” The billionaires and millionaires adopted some of the fashion of the working class and used working-class people to help navigate the stigma they thought they faced. In contrast, the working class, which was largely Latinx, struggled to get by, especially when it came to finding affordable housing.
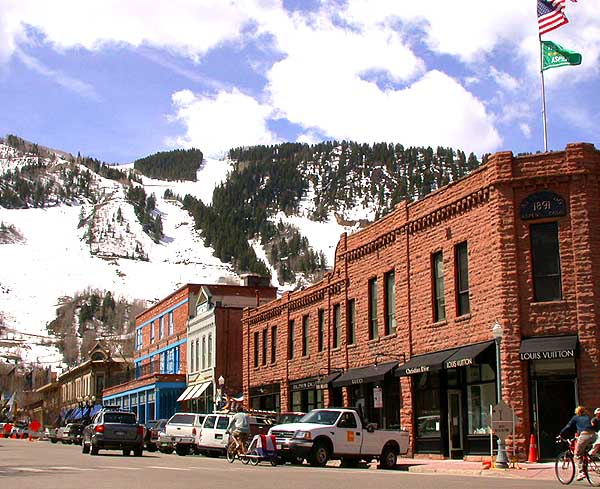
Focusing on a similarly wealthy community, Jenny Stuber (2021) explored Aspen, Colorado, (figure 8.7) in her book Aspen and the American Dream: How One Town Manages Inequality in the Era of Supergentrification. In the book, Stuber begins with a contradiction, asking “How is it possible for a town to exist where the median household income is $73,000, but the median home price is about $4 million?” (Stuber 2021:1). She found that the unique place-based class culture of Aspen allowed the middle class to survive. In Aspen, its history of progressiveness, a priority on “Keeping Aspen, Aspen,” and an extensive affordable housing program made it possible for middle-class families to continue to live in the community. Families making up to $300,000 per year were eligible for subsidized housing (Stuber 2021:55). The city used a variety of tax policies to help fund the program and land use codes to help control the growth of the town.
In her book Dividing Paradise: Rural Inequality and the Diminishing American Dream, Jennifer Sherman examined a rural valley in Eastern Washington that was close to a variety of natural amenities. While the wealth disparities were not as vast as those in Jackson or Aspen, there still existed a complicated class dynamic. She documented the influx of “newcomers,” who tended to be wealthier and have higher amounts of economic, cultural, and social capital than the existing working-class community, called the “old timers.”
The newcomers felt a sense of community and connected to what was going on in the valley. They also had better access to housing, well-paying jobs, and social support. In contrast, old-timers felt increasingly isolated and struggled to get by. They faced an unstable and unaffordable housing market, while working low-wage and seasonal jobs. The newcomers displayed “class blindness,” the inability to comprehend how their class advantages worked for them, while blaming the struggles of old timers on individual characteristics (Sherman 2021:63).
As you reflect on these three studies, what similarities can you identify between the locations? What are some major differences in these places? How might the characteristics of these places contribute to wealth inequality?
Poverty
In the United States, poverty is most often referred to as a relative rather than an absolute measurement. Absolute poverty is an economic condition in which a family or individual cannot afford basic necessities, such as food and shelter, so day-to-day survival is in jeopardy. Relative poverty is an economic condition in which the income of a family or individual is less than 50 percent of the average median income. This is sometimes called the poverty level or the poverty line.
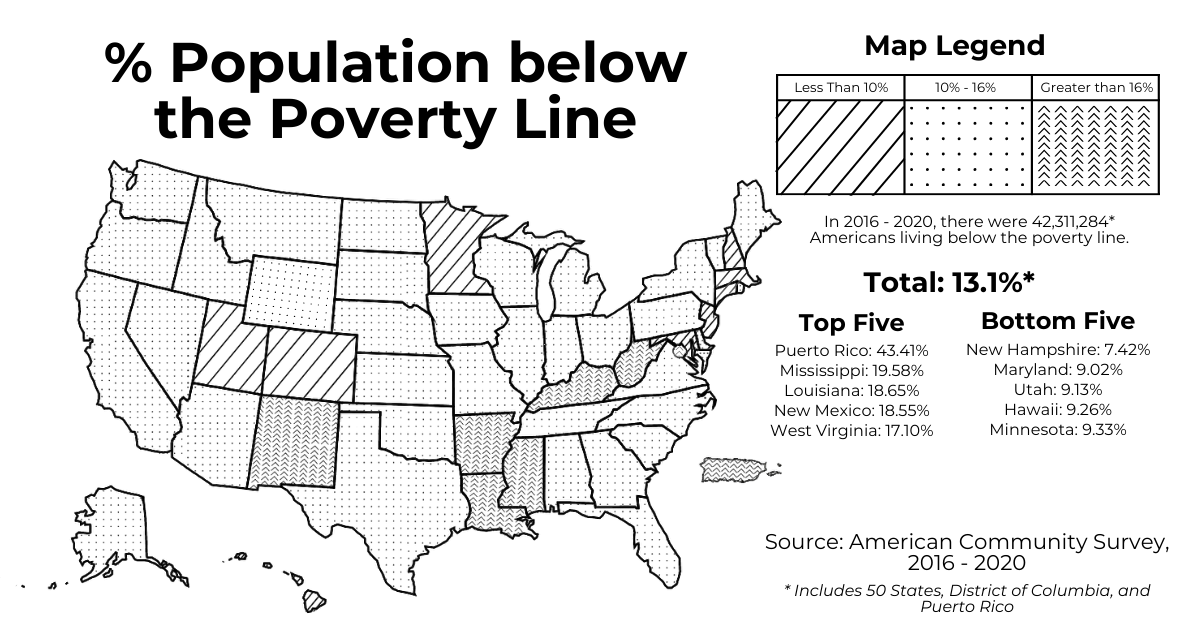
The Social Security Administration established the official poverty line in the 1960s as a way to measure the number of people living in poverty and to assess how much it changed. In the United States, the government uses the poverty line (figure 8.8), to indicate the total annual income below which a family would be impoverished. It is based on a minimum family food budget and assumes the average low-income family spends a third of their income on food. The official U.S. poverty rate in 2020 was 11.4 percent, which equates to about 37.2 million people (Shrider et al. 2021)

There has been a continuing debate about the poverty line. Conservatives argue that if benefits provided to poor people, such as Medicaid, subsidized housing, and reduced-price school lunches, are included in the measure, then the extent of poverty is much less than reported. Liberals argue the federal poverty line underestimates poverty and that the thresholds are too low. They point to costs other than food, such as childcare, heating, and housing, that should be incorporated into the measure. There are also regional differences in the cost of living, and therefore the poverty line neglects poor people in expensive cities.
Demographically, some groups are more likely to experience poverty than others. These include (Shrider et al. 2021):
- Single-parent families: For female-headed single-parent households, the poverty rate was 23.4 percent in 2020. For male-headed single-parent households, the poverty rate was 11.5 percent. For married couples, the poverty rate was 4.7 percent. With a couple, there is the potential for dual incomes and more childcare options.
- Children: In 2020, 16.1 percent of children under the age of 18 were living in poverty. The United States generally has lower-quality childcare services than other developed countries. Without high-quality, affordable childcare, it can become difficult for a parent to work steadily.
- Minority groups: While White people make up the largest group of people living in poverty (15.9 million people), minority groups disproportionately experience poverty. In 2020, 19.5 percent of Black people experienced poverty, and 17 percent of Hispanics experienced poverty. This can be traced to numerous factors, such as low wages, discrimination (in housing, education, health care), and differences in education level. We will explore the influence of race on these processes in Chapter 11.
- People with disabilities: In 2020, 25 percent of adults (18 to 64) with a disability lived in poverty. Significant numbers of those who are poor have struggled with disabilities since childhood. A serious disability can make it hard to get a job and can hamper other aspects of life. It is important to note that poverty can lead to and worsen disabilities, but disabilities are not unique to poor families.
There are several explanations for why people become poor. A lot of Americans believe in rags-to-riches stories and the American Dream (exemplified by the sayings “if you work hard, you’ll get ahead” and “pull yourself up by the bootstraps”). From this perspective, the poor are those who fail to work hard. Poverty is seen as the result of individual laziness or lack of motivation. In other words, the poor only have themselves to blame for their situation. Often, moral or genetic deficiencies will be attributed to those experiencing poverty. You have the opportunity to learn more about commonly held myths related to poverty in the next section “Pedagogical Element: Myths of Poverty.”
Structural explanations attribute poverty to the institutions of society, such as trends in the labor markets or corporations. It assumes poverty is a result of economic and social imbalances within the society. These can include larger forces such as severe recession, low wages, and the rise of part-time work. During severe recessions, breadwinners can lose their jobs or have their incomes reduced. People can lose their homes to foreclosure. They may use their retirement savings to live on and rack up credit card debt. When wages are low, people may not be able to cover all of their expenses. Another structural condition is the rise of part-time and gig work. These types of work receive minimal benefits and often have a minimum wage. As a result, those with jobs end up living on bare-bones budgets and have difficulty affording the basics of life.
More recently, sociologists have adopted a relational perspective to understand poverty. Rather than being something that is individually determined or the product of social forces, poverty is seen as emerging through interactions between those who have resources and those who do not (Desmond and Western 2018). Exploitation is one of the transactional mechanisms between people that helps produce poverty. This could be owners exploiting workers or landlords exploiting tenants. Discrimination and violence also play a role in producing poverty.
Activity: Myths of Poverty
Poverty affects different groups in many ways. However, there are a number of misconceptions when it comes to understanding the experience of poverty and who lives in poverty.
Mark Rank, a well-known sociologist who studies poverty, has identified several myths that people tend to believe about poverty. Read the six myths about poverty [Website] Rank describes on his website, then discuss:
- Where do the myths originate?
- Which groups might benefit from the myths?
- Are there other myths you might add to the list?
Licenses and Attributions for Social Classes in the United States
Open Content, Original
“Social Classes in the United States” by Matthew Gougherty is licensed under CC BY 4.0.
“A Closer Look: Wealth and Inequality in the Western United States” by Matthew Gougherty is licensed under CC BY 4.0.
Open Content, Shared Previously
First two paragraphs in “Upper Class,” first four paragraphs in “Middle Class,” first two paragraphs and last two paragraphs in “The Lower Class,” first paragraph in “Poverty” are from “9.2 Social Stratification and Mobility in the United States” by Tonja R. Conerly, Kathleen Holmes, Asha Lal Tamang in Introduction to Sociology 3e, OpenStax, which is licensed under CC BY 4.0. Edited for consistency, clarity, and brevity.
Figure 8.5. “Distribution of Wealth in the United States” by Delphi234 is in the Public Domain, CC0 1.0.
Figure 8.6. “Suburbia” by David Shankbone is licensed under CC BY-SA 3.0.
Figure 8.7. “Downtown of Aspen, Colorado” by Matthew Trump is licensed under CC BY-SA 3.0.
Figure 8.8. “% Below the Poverty Line” by Mindy Khamvongsa for Open Oregon Educational Resources, is licensed under CC BY 4.0
a set of people who share similar status based on factors like wealth, income, education, family background, and occupation.
the net value of money and assets a person has. It is accumulated over time.
shared beliefs about what a group considers worthwhile or desirable.
the class in command of the major hierarchies and organizations of modern society.
a group of people who live in a defined geographic area, interact with one another, and share a common culture.
mechanisms or patterns of social order focused on meeting social needs, such as government, the economy, education, family, healthcare, and religion.
a person’s wages or investment dividends. Earned on a regular basis.
a stratification system that is based on social factors and individual achievement. It has some degree of openness.
conceptual distinctions made by people to categorize social things.
a middle-class child rearing technique in which parents try to actively foster their childrens’ development.
a person’s distinct identity that is developed through social interaction.
the process wherein people come to understand societal norms and expectations, to accept society’s beliefs, and to be aware of societal values.
using social connections and networks as a resource.
an economic condition in which a family or individual cannot afford basic necessities, such as food and shelter, so that day-to-day survival is in jeopardy.
an economic condition in which a family or individuals have 50 percent income less than the average median income.
any collection of at least two people who interact with some frequency and who share some sense of aligned identity.
actions against a group of people. Discrimination can be based on race, ethnicity, age, religion, health, and other categories.
a category of identity that ascribes social, cultural, and political meaning and consequence to physical characteristics.

