
Learning Objectives
By the end of this section, you will be able to:
- Define absolute advantage, comparative advantage, and opportunity costs
- Explain the gains of trade created when a country specializes
The American statesman Benjamin Franklin (1706–1790) once wrote: “No nation was ever ruined by trade.” Many economists would express their attitudes toward international trade in an even more positive manner. The evidence that international trade confers overall benefits on economies is pretty strong. Trade has accompanied economic growth in the United States and around the world. Many of the national economies that have shown the most rapid growth in the last few decades—for example, Japan, South Korea, China, and India—have done so by dramatically orienting their economies toward international trade. There is no modern example of a country that has shut itself off from world trade and yet prospered. To understand the benefits of trade, or why we trade in the first place, we need to understand the concepts of comparative and absolute advantage.
In 1817, David Ricardo, a businessman, economist, and member of the British Parliament, wrote a treatise called On the Principles of Political Economy and Taxation. In this treatise, Ricardo argued that specialization and free trade benefit all trading partners, even those that may be relatively inefficient. To see what he meant, we must be able to distinguish between absolute and comparative advantage.
A country has an absolute advantage in producing a good over another country if it uses fewer resources to produce that good. Absolute advantage can be the result of a country’s natural endowment. For example, extracting oil in Saudi Arabia is pretty much just a matter of “drilling a hole.” Producing oil in other countries can require considerable exploration and costly technologies for drilling and extraction—if indeed they have any oil at all. The United States has some of the richest farmland in the world, making it easier to grow corn and wheat than in many other countries. Guatemala and Colombia have climates especially suited for growing coffee. Chile and Zambia have some of the world’s richest copper mines. As some have argued, “geography is destiny.” Chile will provide copper and Guatemala will produce coffee, and they will trade. When each country has a product others need and it can be produced with fewer resources in one country over another, then it is easy to imagine all parties benefitting from trade. However, thinking about trade just in terms of geography and absolute advantage is incomplete. Trade really occurs because of comparative advantage.
Recall from the chapter Choice in a World of Scarcity that a country has a comparative advantage when a good can be produced at a lower cost in terms of other goods. The question each country or company should be asking when it trades is this: “What do we give up to produce this good?” It should be no surprise that the concept of comparative advantage is based on this idea of opportunity cost from Choice in a World of Scarcity. For example, if Zambia focuses its resources on producing copper, its labor, land and financial resources cannot be used to produce other goods such as corn. As a result, Zambia gives up the opportunity to produce corn. How do we quantify the cost in terms of other goods? Simplify the problem and assume that Zambia just needs labor to produce copper and corn. The companies that produce either copper or corn tell you that it takes 10 hours to mine a ton of copper and 20 hours to harvest a bushel of corn. This means the opportunity cost of producing a ton of copper is 2 bushels of corn. The next section develops absolute and comparative advantage in greater detail and relates them to trade.
Visit this website for a list of articles and podcasts pertaining to international trade topics.

A Numerical Example of Absolute and Comparative Advantage
Consider a hypothetical world with two countries, Saudi Arabia and the United States, and two products, oil and corn. Further assume that consumers in both countries desire both these goods. These goods are homogeneous, meaning that consumers/producers cannot differentiate between corn or oil from either country. There is only one resource available in both countries, labor hours. Saudi Arabia can produce oil with fewer resources, while the United States can produce corn with fewer resources. Table 1 illustrates the advantages of the two countries, expressed in terms of how many hours it takes to produce one unit of each good.
| Country | Oil (hours per barrel) | Corn (hours per bushel) |
|---|---|---|
| Saudi Arabia | 1 | 4 |
| United States | 2 | 1 |
| Table 1. How Many Hours It Takes to Produce Oil and Corn | ||
In Table 1, Saudi Arabia has an absolute advantage in the production of oil because it only takes an hour to produce a barrel of oil compared to two hours in the United States. The United States has an absolute advantage in the production of corn.
To simplify, let’s say that Saudi Arabia and the United States each have 100 worker hours (see Table 2). We illustrate what each country is capable of producing on its own using a production possibility frontier (PPF) graph, shown in Figure 1. Recall from Choice in a World of Scarcity that the production possibilities frontier shows the maximum amount that each country can produce given its limited resources, in this case workers, and its level of technology.
| Country | Oil Production using 100 worker hours (barrels) | Corn Production using 100 worker hours (bushels) | |
|---|---|---|---|
| Saudi Arabia | 100 | or | 25 |
| United States | 50 | or | 100 |
| Table 2. Production Possibilities before Trade | |||
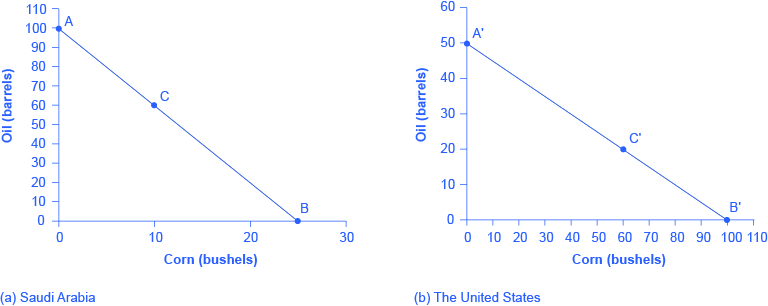
Arguably Saudi and U.S. consumers desire both oil and corn to live. Let’s say that before trade occurs, both countries produce and consume at point C or C’. Thus, before trade, the Saudi Arabian economy will devote 60 worker hours to produce oil, as shown in Table 3. Given the information in Table 1, this choice implies that it produces/consumes 60 barrels of oil. With the remaining 40 worker hours, since it needs four hours to produce a bushel of corn, it can produce only 10 bushels. To be at point C’, the U.S. economy devotes 40 worker hours to produce 20 barrels of oil and the remaining worker hours can be allocated to produce 60 bushels of corn.
| Country | Oil Production (barrels) | Corn Production (bushels) |
|---|---|---|
| Saudi Arabia (C) | 60 | 10 |
| United States (C’) | 20 | 60 |
| Total World Production | 80 | 70 |
| Table 3. Production before Trade | ||
The slope of the production possibility frontier illustrates the opportunity cost of producing oil in terms of corn. Using all its resources, the United States can produce 50 barrels of oil or 100 bushels of corn. So the opportunity cost of one barrel of oil is two bushels of corn—or the slope is 1/2. Thus, in the U.S. production possibility frontier graph, every increase in oil production of one barrel implies a decrease of two bushels of corn. Saudi Arabia can produce 100 barrels of oil or 25 bushels of corn. The opportunity cost of producing one barrel of oil is the loss of 1/4 of a bushel of corn that Saudi workers could otherwise have produced. In terms of corn, notice that Saudi Arabia gives up the least to produce a barrel of oil. These calculations are summarized in Table 4.
| Country | Opportunity cost of one unit — Oil (in terms of corn) | Opportunity cost of one unit — Corn (in terms of oil) |
|---|---|---|
| Saudi Arabia | ¼ | 4 |
| United States | 2 | ½ |
| Table 4. Opportunity Cost and Comparative Advantage | ||
Again recall that comparative advantage was defined as the opportunity cost of producing goods. Since Saudi Arabia gives up the least to produce a barrel of oil, (1414 < 22 in Table 4) it has a comparative advantage in oil production. The United States gives up the least to produce a bushel of corn, so it has a comparative advantage in corn production.
In this example, there is symmetry between absolute and comparative advantage. Saudi Arabia needs fewer worker hours to produce oil (absolute advantage, see Table 1), and also gives up the least in terms of other goods to produce oil (comparative advantage, see Table 4). Such symmetry is not always the case, as we will show after we have discussed gains from trade fully. But first, read the following Clear It Up feature to make sure you understand why the PPF line in the graphs is straight.
Can a production possibility frontier be straight?
When you first met the production possibility frontier (PPF) in the chapter on Choice in a World of Scarcity it was drawn with an outward-bending shape. This shape illustrated that as inputs were transferred from producing one good to another—like from education to health services—there were increasing opportunity costs. In the examples in this chapter, the PPFs are drawn as straight lines, which means that opportunity costs are constant. When a marginal unit of labor is transferred away from growing corn and toward producing oil, the decline in the quantity of corn and the increase in the quantity of oil is always the same. In reality this is possible only if the contribution of additional workers to output did not change as the scale of production changed. The linear production possibilities frontier is a less realistic model, but a straight line simplifies calculations. It also illustrates economic themes like absolute and comparative advantage just as clearly.
Gains from Trade
Consider the trading positions of the United States and Saudi Arabia after they have specialized and traded. Before trade, Saudi Arabia produces/consumes 60 barrels of oil and 10 bushels of corn. The United States produces/consumes 20 barrels of oil and 60 bushels of corn. Given their current production levels, if the United States can trade an amount of corn fewer than 60 bushels and receives in exchange an amount of oil greater than 20 barrels, it will gain from trade. With trade, the United States can consume more of both goods than it did without specialization and trade. (Recall that the chapter Welcome to Economics! defined specialization as it applies to workers and firms. Specialization is also used to describe the occurrence when a country shifts resources to focus on producing a good that offers comparative advantage.) Similarly, if Saudi Arabia can trade an amount of oil less than 60 barrels and receive in exchange an amount of corn greater than 10 bushels, it will have more of both goods than it did before specialization and trade. Table 5 illustrates the range of trades that would benefit both sides.
| The U.S. Economy, after Specialization, Will Benefit If It: | The Saudi Arabian Economy, after Specialization, Will Benefit If It: |
|---|---|
| Exports no more than 60 bushels of corn | Imports at least 10 bushels of corn |
| Imports at least 20 barrels of oil | Exports less than 60 barrels of oil |
| Table 5. The Range of Trades That Benefit Both the United States and Saudi Arabia | |
The underlying reason why trade benefits both sides is rooted in the concept of opportunity cost, as the following Clear It Up feature explains. If Saudi Arabia wishes to expand domestic production of corn in a world without international trade, then based on its opportunity costs it must give up four barrels of oil for every one additional bushel of corn. If Saudi Arabia could find a way to give up less than four barrels of oil for an additional bushel of corn (or equivalently, to receive more than one bushel of corn for four barrels of oil), it would be better off.
What are the opportunity costs and gains from trade?
The range of trades that will benefit each country is based on the country’s opportunity cost of producing each good. The United States can produce 100 bushels of corn or 50 barrels of oil. For the United States, the opportunity cost of producing one barrel of oil is two bushels of corn. If we divide the numbers above by 50, we get the same ratio: one barrel of oil is equivalent to two bushels of corn, or (100/50 = 2 and 50/50 = 1). In a trade with Saudi Arabia, if the United States is going to give up 100 bushels of corn in exports, it must import at least 50 barrels of oil to be just as well off. Clearly, to gain from trade it needs to be able to gain more than a half barrel of oil for its bushel of corn—or why trade at all?
Recall that David Ricardo argued that if each country specializes in its comparative advantage, it will benefit from trade, and total global output will increase. How can we show gains from trade as a result of comparative advantage and specialization? Table 6 shows the output assuming that each country specializes in its comparative advantage and produces no other good. This is 100% specialization. Specialization leads to an increase in total world production. (Compare the total world production in Table 3 to that in Table 6.)
| Country | Quantity produced after 100% specialization — Oil (barrels) | Quantity produced after 100% specialization — Corn (bushels) |
|---|---|---|
| Saudi Arabia | 100 | 0 |
| United States | 0 | 100 |
| Total World Production | 100 | 100 |
| Table 6. How Specialization Expands Output | ||
What if we did not have complete specialization, as in Table 6? Would there still be gains from trade? Consider another example, such as when the United States and Saudi Arabia start at C and C’, respectively, as shown in Figure 1. Consider what occurs when trade is allowed and the United States exports 20 bushels of corn to Saudi Arabia in exchange for 20 barrels of oil.
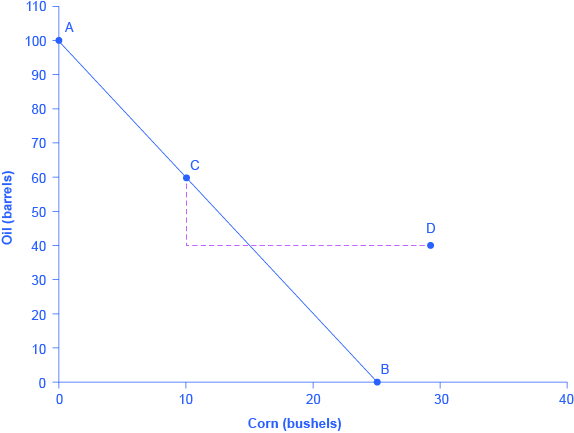
Starting at point C, reduce Saudi Oil production by 20 and exchange it for 20 units of corn to reach point D (see Figure 2). Notice that even without 100% specialization, if the “trading price,” in this case 20 barrels of oil for 20 bushels of corn, is greater than the country’s opportunity cost, the Saudis will gain from trade. Indeed both countries consume more of both goods after specialized production and trade occurs.
Visit this website for trade-related data visualizations.

Key Concepts and Summary
A country has an absolute advantage in those products in which it has a productivity edge over other countries; it takes fewer resources to produce a product. A country has a comparative advantage when a good can be produced at a lower cost in terms of other goods. Countries that specialize based on comparative advantage gain from trade.
Self-Check Questions
- True or False: The source of comparative advantage must be natural elements like climate and mineral deposits. Explain.
- Brazil can produce 100 pounds of beef or 10 autos; in contrast the United States can produce 40 pounds of beef or 30 autos. Which country has the absolute advantage in beef? Which country has the absolute advantage in producing autos? What is the opportunity cost of producing one pound of beef in Brazil? What is the opportunity cost of producing one pound of beef in the United States?
- In France it takes one worker to produce one sweater, and one worker to produce one bottle of wine. In Tunisia it takes two workers to produce one sweater, and three workers to produce one bottle of wine. Who has the absolute advantage in production of sweaters? Who has the absolute advantage in the production of wine? How can you tell?
Review Questions
- What is absolute advantage? What is comparative advantage?
- Under what conditions does comparative advantage lead to gains from trade?
- What factors does Paul Krugman identify that supported the expansion of international trade in the 1800s?
Critical Thinking Questions
- Are differences in geography behind the differences in absolute advantages?
- Why does the United States not have an absolute advantage in coffee?
- Look at Self-Check Question 3. Compute the opportunity costs of producing sweaters and wine in both France and Tunisia. Who has the lowest opportunity cost of producing sweaters and who has the lowest opportunity cost of producing wine? Explain what it means to have a lower opportunity cost.
Problems
France and Tunisia both have Mediterranean climates that are excellent for producing/harvesting green beans and tomatoes. In France it takes two hours for each worker to harvest green beans and two hours to harvest a tomato. Tunisian workers need only one hour to harvest the tomatoes but four hours to harvest green beans. Assume there are only two workers, one in each country, and each works 40 hours a week.
- Draw a production possibilities frontier for each country. Hint: Remember the production possibility frontier is the maximum that all workers can produce at a unit of time which, in this problem, is a week.
- Identify which country has the absolute advantage in green beans and which country has the absolute advantage in tomatoes.
- Identify which country has the comparative advantage.
- How much would France have to give up in terms of tomatoes to gain from trade? How much would it have to give up in terms of green beans?
References
Krugman, Paul R. Pop Internationalism. The MIT Press, Cambridge. 1996.
Krugman, Paul R. “What Do Undergrads Need to Know about Trade?” American Economic Review 83, no. 2. 1993. 23-26.
Ricardo, David. On the Principles of Political Economy and Taxation. London: John Murray, 1817.
Ricardo, David. “On the Principles of Political Economy and Taxation.” Library of Economics and Liberty. http://www.econlib.org/library/Ricardo/ricP.html.
Glossary
- absolute advantage
- when one country can use fewer resources to produce a good compared to another country; when a country is more productive compared to another country
- gain from trade
- a country that can consume more than it can produce as a result of specialization and trade
Solutions
Answers to Self-Check Questions
- False. Anything that leads to different levels of productivity between two economies can be a source of comparative advantage. For example, the education of workers, the knowledge base of engineers and scientists in a country, the part of a split-up value chain where they have their specialized learning, economies of scale, and other factors can all determine comparative advantage.
- Brazil has the absolute advantage in producing beef and the United States has the absolute advantage in autos. The opportunity cost of producing one pound of beef is 1/10 of an auto; in the United States it is 3/4 of an auto.
- In answering questions like these, it is often helpful to begin by organizing the information in a table, such as in the following table. Notice that, in this case, the productivity of the countries is expressed in terms of how many workers it takes to produce a unit of a product.
Country One Sweater One Bottle of wine France 1 worker 1 worker Tunisia 2 workers 3 workers Table 7. In this example, France has an absolute advantage in the production of both sweaters and wine. You can tell because it takes France less labor to produce a unit of the good.
