
4.6 Scored Assessment
Charting Social Justice Data (Comprehensive Review)
Download Data File: SC4 Data
Task 1 International Incarceration rates
- Open the file named SC4 Data and then Save As SC4 Social Justice.
- On the International tab, use a function in cell D20 to find the average of the Individuals incarcerated data.
- Create a bar chart that looks like this:
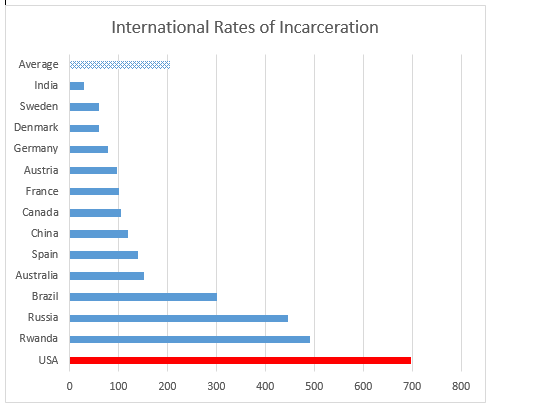
- Move and or resize it so that it does not cover any of the data.
- In cell A25 write a brief note explaining why a bar (or column) chart is a better choice for this data than a pie chart.
- Set the Print Area so that everything prints, except for the explanation you added in cell A25.
- Preview the International worksheet in Print Preview and make any changes needed to print professionally on one page.
Task 2 Disenfranchisement Rate
Felony disenfranchisement is the exclusion from voting of people otherwise eligible to vote (known as disfranchisement) due to conviction of a criminal offense, usually restricted to the more serious class of crimes: felonies. Jurisdictions vary as to whether they make such disfranchisement permanent, or restore suffrage after a person has served a sentence, or completed parole or probation. Affected individuals suffer “collateral consequences” including loss of access to jobs, housing, and other facilities.
Opponents have argued that such disfranchisement restricts and conflicts with principles of universal suffrage. It can affect civic and communal participation in general.
https://en.wikipedia.org/wiki/Felony_disenfranchisement
On the Disenfranchisement rate sheet, use the Recommended Chart tool to create the following three charts. Put each chart on its own individual sheet. (Note: Not an object in a spreadsheet.)
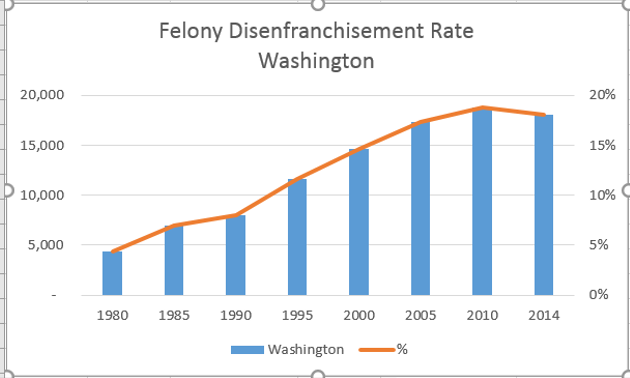
Chart1 — Felony Disenfranchisement Rate Washington
Notes
This is called a Clustered column chart in the Recommended charts tool, but it is really a combo chart – with some data displayed as columns and some data displayed as a line.
You will need to edit the Chart Title.
You may need to adjust the chart size to make it look like the illustration.
Put the chart on its own individual sheet — don’t leave it as an object on the spreadsheet.
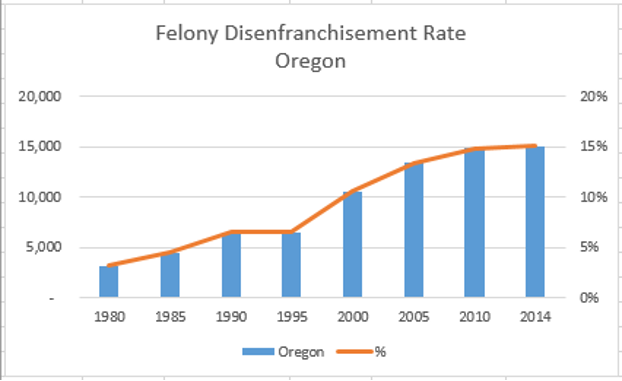
Chart2 — Felony Disenfranchisement Rate Oregon
Notes:
Take a look at both the Washington and Oregon charts. They are the same kind of chart, but your charts may look different because the data is a bit different.
To make them more similar – make sure that the vertical axes are the same in both charts. Format the left vertical (value) axis, so that the Maximum is 20000. Format the right vertical axis, so that the Maximum is .20.
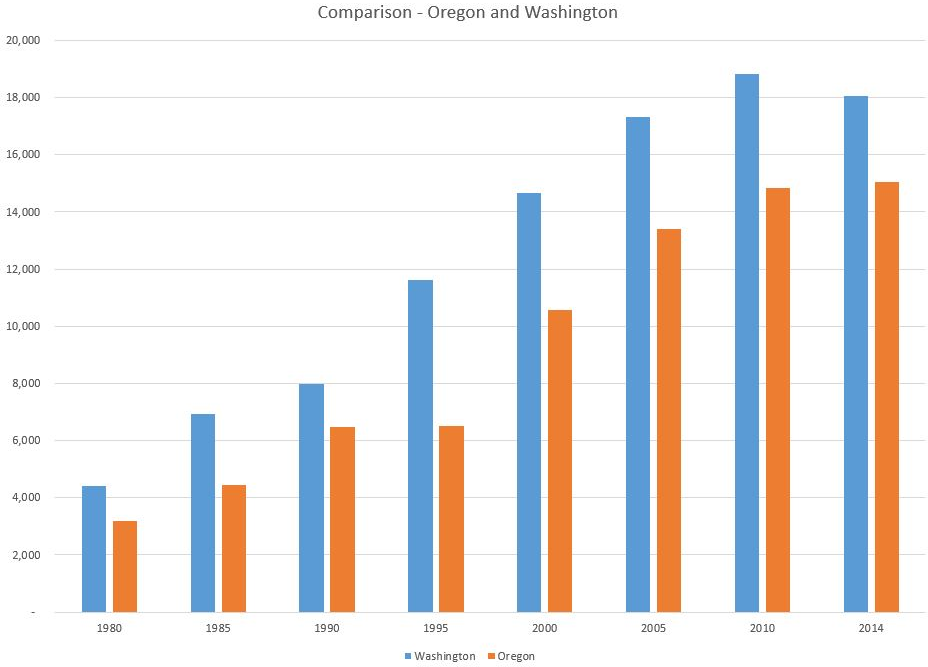
Chart3 – Comparison – Oregon and Washington
Notes:
Be sure that you have years as labels on the horizontal axis (not 1, 2, 3 . . . )
This chart is on its own separate sheet.
- When you have completed all three charts, save your work. Preview the worksheet(s) in Print Preview and make any necessary changes for professional printing.
- Submit the SC4 Social Justice workbook as directed by your instructor.
Attribution
“4.6 Scored Assessment” by Noreen Brown, Portland Community College is licensed under CC BY 4.0
