
OpenStax, Biology. OpenStax CNX. May 27, 2016 http://cnx.org/contents/GFy_h8cu@10.57:4qg08nt-@8/Characteristics-and-Traits
63 Monohybrid Cross and the Punnett Square
When fertilization occurs between two true-breeding parents that differ by only the characteristic being studied, the process is called a monohybrid cross, and the resulting offspring are called monohybrids. Mendel performed seven types of monohybrid crosses, each involving contrasting traits for different characteristics. Out of these crosses, all of the F1 offspring had the phenotype of one parent, and the F2 offspring had a 3:1 phenotypic ratio. On the basis of these results, Mendel postulated that each parent in the monohybrid cross contributed one of two paired unit factors to each offspring, and every possible combination of unit factors was equally likely.
The results of Mendel’s research can be explained in terms of probabilities, which are mathematical measures of likelihood. The probability of an event is calculated by the number of times the event occurs divided by the total number of opportunities for the event to occur. A probability of one (100 percent) for some event indicates that it is guaranteed to occur, whereas a probability of zero (0 percent) indicates that it is guaranteed to not occur, and a probability of 0.5 (50 percent) means it has an equal chance of occurring or not occurring.
To demonstrate this with a monohybrid cross, consider the case of true-breeding pea plants with yellow versus green seeds. The dominant seed color is yellow; therefore, the parental genotypes were YY for the plants with yellow seeds and yy for the plants with green seeds. A Punnett square, devised by the British geneticist Reginald Punnett, is useful for determining probabilities because it is drawn to predict all possible outcomes of all possible random fertilization events and their expected frequencies. Figure 7 shows a Punnett square for a cross between a plant with yellow peas and one with green peas. To prepare a Punnett square, all possible combinations of the parental alleles (the genotypes of the gametes) are listed along the top (for one parent) and side (for the other parent) of a grid. The combinations of egg and sperm gametes are then made in the boxes in the table on the basis of which alleles are combining. Each box then represents the diploid genotype of a zygote, or fertilized egg. Because each possibility is equally likely, genotypic ratios can be determined from a Punnett square. If the pattern of inheritance (dominant and recessive) is known, the phenotypic ratios can be inferred as well. For a monohybrid cross of two true-breeding parents, each parent contributes one type of allele. In this case, only one genotype is possible in the F1 offspring. All offspring are Yy and have yellow seeds.
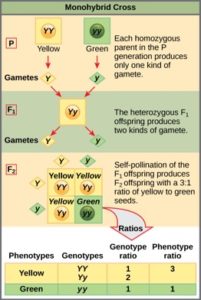
When the F1 offspring are crossed with each other, each has an equal probability of contributing either a Y or a y to the F2 offspring. The result is a 1 in 4 (25 percent) probability of both parents contributing a Y, resulting in an offspring with a yellow phenotype; a 25 percent probability of parent A contributing a Y and parent B a y, resulting in offspring with a yellow phenotype; a 25 percent probability of parent A contributing a y and parent B a Y, also resulting in a yellow phenotype; and a (25 percent) probability of both parents contributing a y, resulting in a green phenotype. When counting all four possible outcomes, there is a 3 in 4 probability of offspring having the yellow phenotype and a 1 in 4 probability of offspring having the green phenotype. This explains why the results of Mendel’s F2 generation occurred in a 3:1 phenotypic ratio. Using large numbers of crosses, Mendel was able to calculate probabilities, found that they fit the model of inheritance, and use these to predict the outcomes of other crosses.
References
Unless otherwise noted, images on this page are licensed under CC-BY 4.0 by OpenStax.

Feedback/Errata