
Measures of Body Size, Body Composition, and Metabolic Health
Healthy Body Size Is Personal
Ask a room full of people what the term “healthy body weight” means, and you’ll probably get lots of different answers. This isn’t surprising given that people naturally come in different shapes and sizes. In addition, body weight or fatness does not determine a person’s health, and health encompasses not just physical health but also mental health and social well-being.
Here’s how the authors of the text “Sport Nutrition for Health and Performance” describe a healthy body weight1:
- A weight that is appropriate for your age and physical development
- A weight you can achieve and sustain without severely curtailing your food intake and constantly dieting

- A weight that is compatible with normal blood pressure, lipid levels, and glucose tolerance (in other words, you are metabolically fit)
- A weight that is based on your genetic background and family history of body shape and weight (after all the apple doesn’t fall too far from the tree)
- A weight that promotes good eating habits and allows you to participate in regular physical activity
- A weight that is acceptable to you
Another way of describing healthy body weight is “best weight,” suggested in the 2020 Canadian Adult Obesity Clinical Practice Guidelines as a way for physicians working with patients who want to lose weight to help center their goals. “Best weight” is described as “the weight that a person can achieve and maintain while living their healthiest and happiest life.”2 It is thus not based on a number on the scale or a metric of body composition, but on individual bodies, lifestyle, and family history. It requires a truly individual assessment, and it isn’t dictated by a formula, fad, or societal expectations.
Yet, the truth is that simple metrics are often used to assess body size and composition. We find them in online calculators, on scales at the gym, and in our doctors’ offices. None of these metrics give anywhere near a complete picture of an individual’s health or whether they are at their best weight. But it’s worth understanding some of these measures so that you know what they mean when you encounter them, how they may be linked to health, and what their limitations are.
Body Mass Index
Body Mass Index (BMI) is a simple calculation used in clinical and research settings to assess body weight relative to height. BMI is easy and inexpensive to measure, and because it takes height into account, it is more predictive of how much body fat a person has than weight alone. However, BMI is not a direct measure of body fat, and it shouldn’t be used on its own to make assumptions about the health of an individual.3
BMI is calculated using the following equations:
BMI = [weight (kg)/height (m2)]
OR
BMI = [weight (lb)/height (in2)] x 703
The Centers for Disease Control and Prevention has a BMI calculator on its website.
For adults, BMI ranges are divided into four main categories:
- Underweight – BMI < 18.5
- Normal weight – BMI from 18.5-24.9
- Overweight – BMI from 25-29.9
- Obesity – BMI from 30 or higher
Obesity is frequently subdivided into categories:
- Class 1 obesity: BMI of 30 to < 35
- Class 2 obesity: BMI of 35 to < 40
- Class 3 obesity: BMI of 40 or higher
BMI values are interpreted differently for children, because body fatness changes so much during growth and varies with sex.3
BMI Interpretation in Populations
Because of its simplicity, BMI is a useful metric for researchers studying large groups of people. For example, BMI is used to track changes in body size within a population over time. It is also used in research studies looking at correlations between BMI and health conditions.
In general, studies have consistently shown that having a very low BMI or high BMI is associated with greater health risks, because there are health risks to carrying too little or too much body fat. When researchers have looked at BMI and health in large groups of people, they have often found that the lowest risk of dying younger is in the range of BMI of 20 to 25.4-6 BMI values in the overweight and especially the obesity range have generally been found to be associated with higher rates of type 2 diabetes, cardiovascular disease, stroke, and some types of cancer, as well as other complications of obesity, such as osteoarthritis.6-10
However, which BMI range is associated with the best health outcomes is somewhat controversial, and different studies have come to different conclusions. For example, a meta-analysis published by CDC researchers in 2013 found that a BMI of 25 to 30 (classified as overweight) was associated with the lowest risk of mortality, and there was no difference between normal BMI or class 1 obesity in mortality risk.11 We see a similar pattern in studies of specific health conditions. A 2022 study published in the Journal of the American Heart Association reported that among patients with coronary artery disease followed for 3 to 5 years, the risk of death was lowest in those with BMI of 25 to 35 (overweight to class 1 obesity).12 In another recent study of people with type 2 diabetes, the risk of dying of cardiovascular disease or of having a heart attack or stroke was also lowest in people with BMI classified as overweight or class 1 obesity.13
The finding that overweight or mild obesity based on BMI can be associated with better health outcomes is often called the “obesity paradox,” but some scholars argue that it is simply a reflection of our evolving understanding of the complex relationships between body size and health.14 Regardless, it is clear that health risks associated with different body sizes do not always align into neat BMI categories, and simple labels such as “normal” and “overweight” may not be very meaningful.
Video: What’s in a Number? Some Research Shows That a Lower B.M.I. Isn’t Always Better by Retro Report, YouTube (November 18, 2021), 10:41. This short documentary, produced in collaboration with Scientific American, covers how “biased ideas about a link between body size and health have led many people to dismiss unexpected findings.”
Limitations of BMI for Individuals
We’ve discussed how BMI is an imperfect metric of health in population studies, but it has even more limitations when it comes to indicating an individual’s body composition or health. For one thing, since BMI is based only on weight and height, it doesn’t distinguish between muscle mass and adipose tissue. It’s not unusual for muscular athletes to be classified as overweight based on BMI, yet have relatively little body fat. On the flip side, BMI can underestimate body fatness in someone with very low muscle mass, such as a person who is elderly and frail. In addition, BMI can’t tell us where body fat is located in the body, and as we’ll learn, this is a major factor determining its impact on health. BMI is also not useful for estimating body fatness in a pregnant person, because pregnancy weight gain includes placental and fetal tissues.3
BMI’s accuracy in predicting body fatness is also affected by biological sex and race/ethnicity—not surprising given the natural diversity in human bodies. At the same BMI, women tend to carry more body fat than men. Also at the same BMI, a Black person tends to have less body fat, and a person of Asian descent tends to have more body fat, compared to a white person. This means that a high BMI may overestimate health risk in a Black person and underestimate health risk in a person of Asian descent.3
This natural variation means that using BMI as a universal metric to screen for body fatness and health risk can result in misleading conclusions. For example, Black Americans have, on average, higher BMI values and higher rates of obesity (defined by BMI) than white Americans, and this is especially true for women. However, the relationship between high BMI and mortality is weaker in Black Americans; in Black women, having a higher BMI has been found to be associated with a lower death rate.16 Some scholars argue that using a crude metric like BMI in doctors’ offices disproportionately harms Black women, who may be more likely to be told that weight is the cause of their health problems without acknowledging the gender- and race-related differences in BMI or the systemic issues — such as racism, poverty, pollution, and stress — that may be more important factors affecting their health.17
All of this means that BMI is not particularly useful for comparing one individual to another or even one population to another. And for an individual, one BMI measurement at a single point in time is not all that meaningful; other measurements and clinical assessments are needed to evaluate disease risk, as we’ll discuss in a moment.
BMI is perhaps most useful for tracking changes in body composition over time, whether of a population or an individual. For example, the data on average BMI in the U.S. show a clear increase over the last several decades, and the most likely explanation for this trend is not that people in the U.S. are all gaining several pounds of muscle each year, but that we’re carrying more fat. On the other hand, someone may have a BMI classified as overweight, but if they’ve been at that BMI their entire adult life and are active and metabolically healthy, they may be at their “best weight,” and labeling them as “overweight” may be misleading and stigmatizing.
Measuring Body Composition
A person’s body mass is made up of water, lean body mass (including organs, bone, and muscle), fat, and other components like minerals. The weight on the scale does not distinguish between these different components, but body composition measurements can.
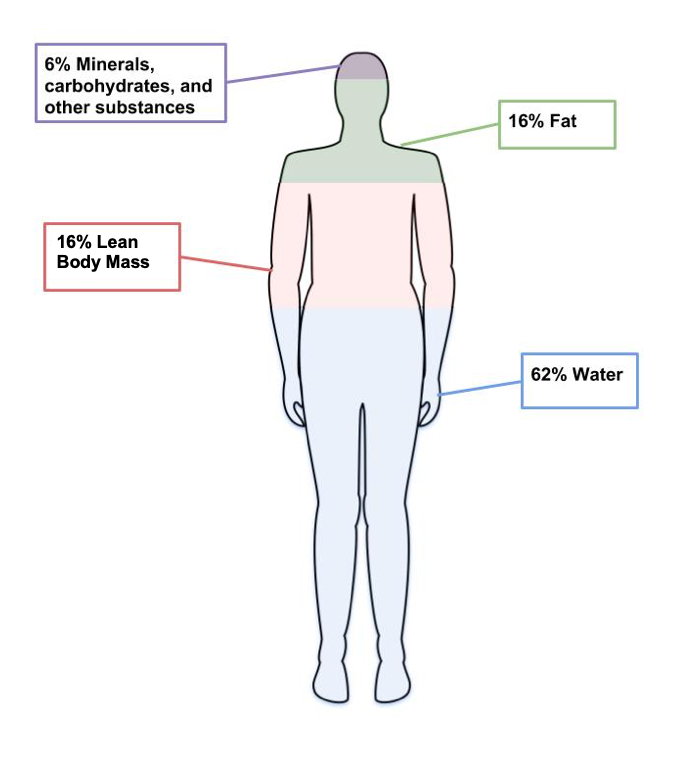
Figure 7.8. The four main components of body weight are water, fat, lean body mass, and other components like minerals.
Body composition measurements are sometimes used by individuals and researchers to determine how much of a person’s weight is made up of body fat and lean body mass. For example, an individual might use body composition measurements to track their progress in building muscle with a new strength training program. Since increased body fat can be a risk factor for diseases like cardiovascular disease and diabetes, researchers are often interested in this type of data. There are several different methods used to measure body composition, each with advantages and limitations.18
- Skinfold Test. This is a simple, non-invasive, and low-cost way to assess fat mass. Calipers are used to measure the thickness of skin on three to seven different parts of the body, and these numbers are then entered into a conversion equation. The accuracy of the skinfold test depends on the skill of the person taking the measurements, the accuracy of the calipers, and the appropriateness of the conversion equations. Best practice is for the same person to take repeated measurements if using them to monitor changes over time. Repeated measurements by different technicians, using different calipers, and different conversion equations will yield very different results.
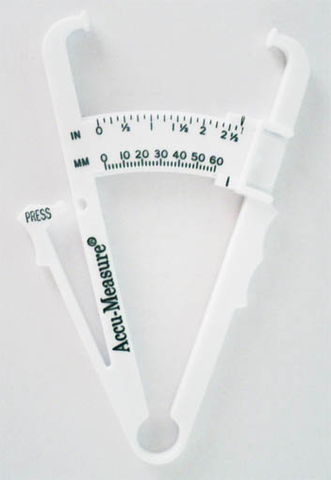
Figure 7.9. Calipers used to assess body fat during skinfold testing.
- Bioelectric Impedance Analysis (BIA). This is a simple, non-invasive, quick tool that does not require extensive training. BIA estimates body composition by sending a small amount of electricity through the body. Since water is a good conductor of electricity, and lean body mass contains more water than fat, the rate at which the current travels can be used to estimate percent body fat. Body fluid levels must be normal with BIA, which is a limitation, since hydration can be impacted by exercise, alcohol, and menstrual cycles.
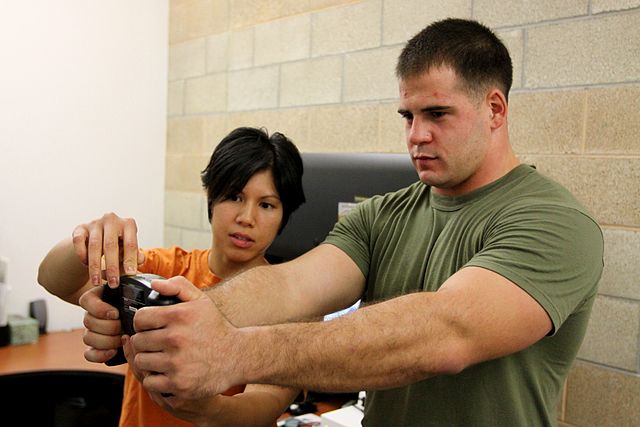
Figure 7.10. BIA hand device.
- Air Displacement Plethysmography (ADP). This is a non-invasive, quick tool that does not take extensive training. It’s more accurate but also more expensive than BIA. While a person sits inside an enclosed chamber (usually called a Bod Pod), changes in air pressure are used to determine the amount of air that is displaced in the test chamber, which can determine body volume. These measurements are then translated into percent body fat. Hydration status can affect the accuracy of this test. This test also needs to be conducted in a facility with a Bod Pod, so it is not as accessible as the skinfold test or the BIA.
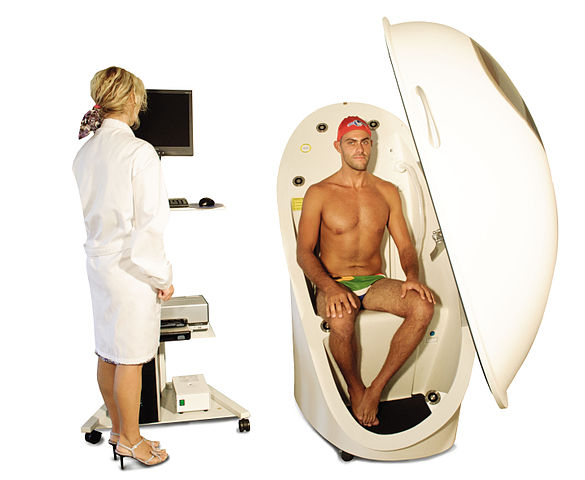
Figure 7.11. Body composition measurement with whole-body air displacement plethysmography (ADP) technology or BodPod
- Dual-energy X-ray Absorptiometry (DXA). This method directs two low-dose X-ray beams through the body and determines the amount of energy absorbed from the beams. The amount of energy absorbed is dependent on the body’s content of bone, lean tissue mass, and fat mass. Using standard mathematical formulas, fat content and bone density can be accurately estimated. Although this is one of the most accurate methods of measuring fat mass, it is expensive and mostly used in research. It also requires low doses of radiation to the subject being tested, and is not appropriate for pregnant women.
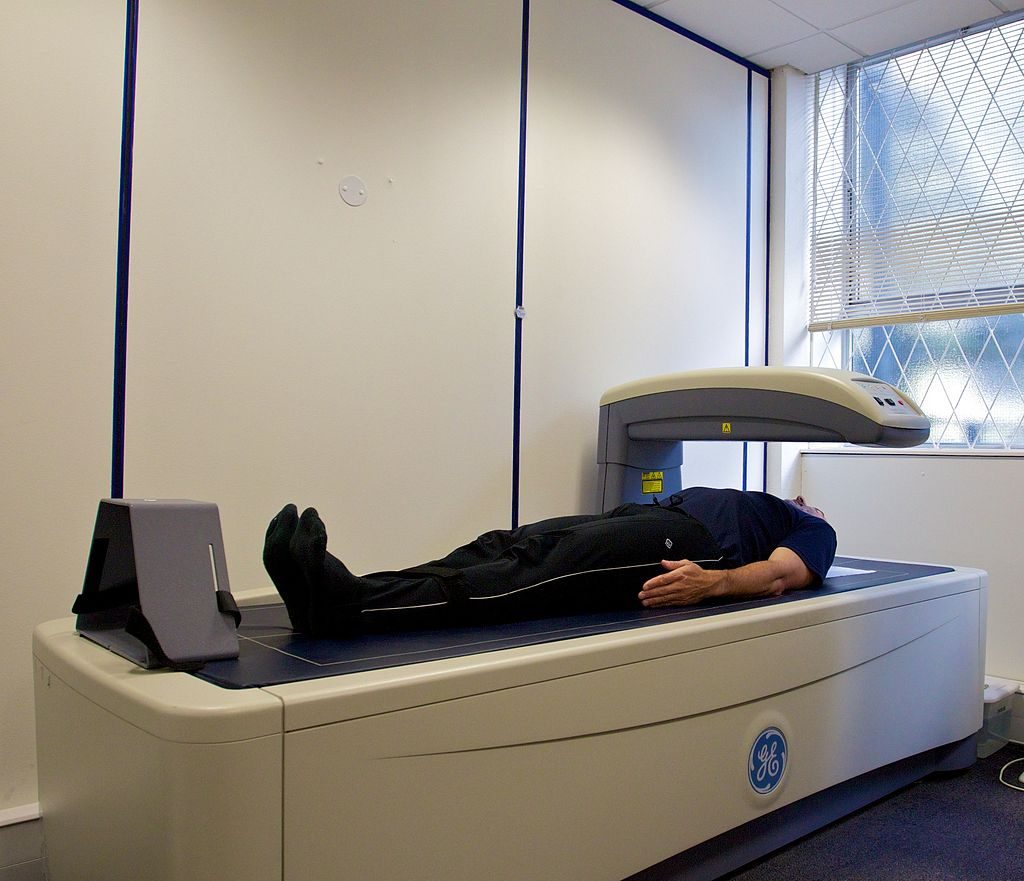
Figure 7.12. Dual-Energy X-ray Absorptiometry (DXA)
Keep in mind that body composition can be hard to measure accurately when using inexpensive and accessible techniques like skinfold testing and BIA. Your best bet is to pick one method and use it over time to compare numbers and see how they change. Just don’t get too hung up on the numbers, as their accuracy will be questionable depending on the method chosen. And just as there is no one body weight or BMI that is ideal for everybody, there is no one ideal body composition. Striving to hit a particular goal on the scale or on body composition measurements can lead to an unhealthy fixation on the numbers.
Measuring Fat Distribution
How fat is distributed in the body is important, because people who store fat more centrally (apple-shaped) have a higher risk of chronic diseases like cardiovascular disease and type 2 diabetes compared to people who store fat in the hips, thighs, and buttocks (pear-shaped). This is because visceral fat that surrounds vital organs (common in central obesity or apple-shaped fat patterning) is more metabolically active, releasing more hormones and inflammatory factors thought to contribute to disease risk compared to subcutaneous fat. Subcutaneous fat stored just below the skin (common in pear-shaped fat patterning) does not seem to significantly increase the risk for chronic disease. In fact, having more lower body subcutaneous fat such as in the hips and thighs may even protect against developing chronic diseases.19
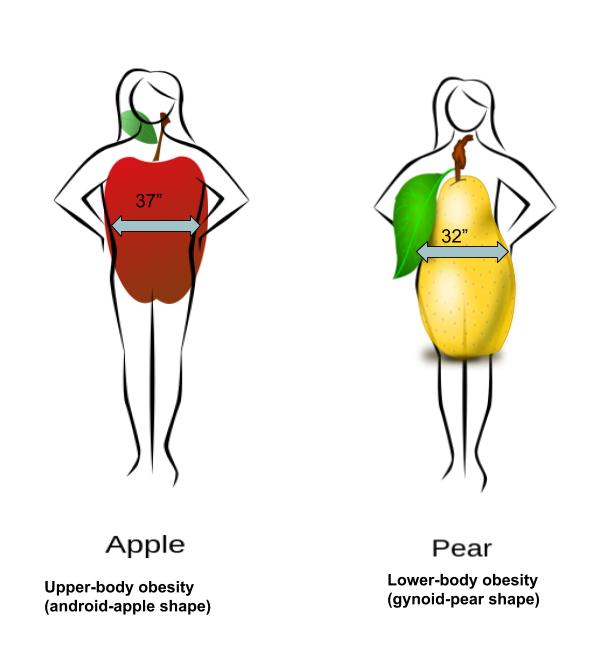
Figure 7.13. Fat can be located in the abdominal region (apple shape) or hips, thighs, and buttocks (pear shape).
Body fat distribution can be measured by waist circumference and waist-to-hip ratio, both of which only require a measuring tape.
- Waist circumference is measured just above the hip bone, level with your belly button. Men with a waist circumference greater than 40 inches and women with a waist circumference greater than 35 inches are predicted to face greater health risks.
- Waist-to-hip ratio is calculated by measuring waist circumference and hip circumference (at its widest part) and dividing the two values. Abdominal obesity is defined by the World Health Organization as a waist-to-hip ratio above 0.90 for men and above 0.85 for women.
Indicators of Metabolic Health
Metabolic health refers to the body’s ability to maintain normal homeostasis and effectively regulate measures like blood pressure, blood lipids, and blood glucose. It is often assumed that when an individual is classified as overweight and obese based on measurements of BMI, body composition, and fat distribution, metabolic health is negatively impacted. However, some individuals who meet the criteria for obesity do not experience an increased risk of metabolic health.20 These individuals are known as metabolically healthy obese (MHO). Metabolically healthy can be described as an absence of insulin resistance, type 2 diabetes, dyslipidemia, and hypertension.
Along the same lines, there are also individuals who are classified as normal weight (BMI < 25) but show an increased metabolic risk. These individuals are known as metabolically obese normal weight (MONW).

In a 2016 study, researchers analyzed BMI and measures of metabolic health (blood pressure, triglyceride and cholesterol levels, blood glucose, insulin resistance, and a marker of inflammation) for more than 40,000 Americans. Among the group classified as normal weight based on BMI, 69% were metabolically healthy based on measures of metabolic health, and 31% were metabolically unhealthy. In the higher BMI categories, the proportion of metabolically healthy people declined, but a significant number of individuals with larger body sizes had normal values for measures of metabolic health; 47% of people classified as overweight, 29% of those classified as having obesity, and 16% of those classified as having class 2 or 3 obesity were metabolically healthy.21 In other words, a person’s body size is not an accurate indicator of their metabolic health, and it’s important to measure and track more direct indicators of health and disease risk such as blood pressure, blood glucose, and blood lipid levels.
These variations may challenge the assumptions we hold about body fatness. It can not be assumed that thinness equals health or that fatness indicates a lack of health.
Self-Check:
References:
- 1Manore, M.M., Meyer, N.L., & Thompson, J.L. (2009). Sport Nutrition for Health and Performance, 2nd ed. Champaign, IL: Human Kinetics.
- 2Obesity Canada and the Canadian Association of Bariatric Physicians and Surgeons (2020). Clinical Recommendations: Quick Guide; Canadian Adult Obesity Clinical Practice Guidelines. http://obesitycanada.ca/wp-content/uploads/2020/11/CPG-Quick-Guide-English.pdf
- 3Centers for Disease Control and Prevention. (2021). About Adult BMI | Healthy Weight | CDC. RetrievedMay 6, 2022, from https://www.cdc.gov/healthyweight/assessing/bmi/adult_bmi/index.html
- 4Bhaskaran, K., dos-Santos-Silva, I., Leon, D. A., Douglas, I. J., & Smeeth, L. (2018). Association of BMI with overall and cause-specific mortality: A population-based cohort study of 3·6 million adults in the UK. The Lancet. Diabetes & Endocrinology, 6(12), 944–953. https://doi.org/10.1016/S2213-8587(18)30288-2
- 5Aune, D., Sen, A., Prasad, M., Norat, T., Janszky, I., Tonstad, S., … Vatten, L. J. (2016). BMI and all cause mortality: Systematic review and non-linear dose-response meta-analysis of 230 cohort studies with 3.74 million deaths among 30.3 million participants. The BMJ, 353. https://doi.org/10.1136/bmj.i2156
- 6The Global BMI Mortality Collaboration. (2016). Body-mass index and all-cause mortality: Individual-participant-data meta-analysis of 239 prospective studies in four continents. Lancet, 388(10046), 776–786.
- 7Jayedi, A., Soltani, S., Motlagh, S. Z., Emadi, A., Shahinfar, H., Moosavi, H., & Shab-Bidar, S. (2022). Anthropometric and adiposity indicators and risk of type 2 diabetes: systematic review and dose-response meta-analysis of cohort studies. BMJ (Clinical research ed.), 376, e067516. https://doi.org/10.1136/bmj-2021-067516
- 8Kim, M. S., Kim, W. J., Khera, A. V., Kim, J. Y., Yon, D. K., Lee, S. W., Shin, J. I., & Won, H. H. (2021). Association between adiposity and cardiovascular outcomes: an umbrella review and meta-analysis of observational and Mendelian randomization studies. European heart journal, 42(34), 3388–3403. https://doi.org/10.1093/eurheartj/ehab454
- 9Liu X, Zhang D, Liu Y, Sun X, Hou Y, Wang B, Ren Y, Zhao Y, Han C, Cheng C, Liu F, Shi Y, Chen X, Liu L, Chen G, Hong S, Zhang M, Hu D. A J-shaped relation of BMI and stroke: Systematic review and dose-response meta-analysis of 4.43 million participants. Nutr Metab Cardiovasc Dis. 2018 Nov;28(11):1092-1099. doi: 10.1016/j.numecd.2018.07.004.
- 10Zheng, H., & Chen, C. (2015). Body mass index and risk of knee osteoarthritis: systematic review and meta-analysis of prospective studies. BMJ open, 5(12), e007568. https://doi.org/10.1136/bmjopen-2014-007568
- 11Flegal K.M., Kit B.K., Orpana H., & Graubard B.I. (2013) Association of All-Cause Mortality With Overweight and Obesity Using Standard Body Mass Index Categories: A Systematic Review and Meta-analysis. JAMA, 309(1):71–82. doi:10.1001/jama.2012.113905
- 12White, H. D., & Wallentin, L. (2022). Body Mass Index and Association With Cardiovascular Outcomes in Patients With Stable Coronary Heart Disease – A STABILITY Substudy. Journal of the American Heart Association, 11(3), e023667. https://doi.org/10.1161/JAHA.121.023667
- 13Pagidipati, N. J., Zheng, Y., Green, J. B., McGuire, D. K., Mentz, R. J., Shah, S., Aschner, P., Delibasi, T., Rodbard, H. W., Westerhout, C. M., Holman, R. R., Peterson, E. D., & TECOS Study Group (2020). Association of obesity with cardiovascular outcomes in patients with type 2 diabetes and cardiovascular disease: Insights from TECOS. American Heart Journal, 219, 47–57. https://doi.org/10.1016/j.ahj.2019.09.016
- 14Harper, K. (2021, November 18). The weight game: How body-size bias can hold back health science. Scientific American. https://www.scientificamerican.com/article/the-weight-game-how-body-size-bias-can-hold-back-health-science/
- 15Centers for Disease Control and Prevention (2021). Adult Obesity Facts. Retrieved May 6, 2022 from https://www.cdc.gov/obesity/data/adult.html.
- 16Jackson, C. L., Wang, N. Y., Yeh, H. C., Szklo, M., Dray-Spira, R., & Brancati, F. L. (2014). Body-mass index and mortality risk in U.S. blacks compared to whites. Obesity (Silver Spring, Md.), 22(3), 842–851. https://doi.org/10.1002/oby.20471
- 17Strings, S. & L. Bacon (2020). The racist roots of fighting obesity. Scientific American. https://www.scientificamerican.com/article/the-racist-roots-of-fighting-obesity2/
- 18Lemos, T., & Gallagher, D.( 2017). Current body composition measurement techniques. Current Opinion in Endocrinology & Diabetes and Obesity, 24(5), 310–314. doi: 10.1097/MED.0000000000000360
- 19Vasan, S. K., Osmond, C., Canoy, D., Christodoulides, C., Neville, M. J., Di Gravio, C., Fall, C., & Karpe, F. (2018). Comparison of regional fat measurements by dual-energy X-ray absorptiometry and conventional anthropometry and their association with markers of diabetes and cardiovascular disease risk. International journal of obesity (2005), 42(4), 850–857. https://doi.org/10.1038/ijo.2017.289
- 20Matthew, H., Farr, O.M., & Mantzoros, S.C. (2016). Metabolic Health and Weight: Understanding metabolically unhealthy normal weight or metabolically healthy obese patients. Metabolism, 65(1), 73-80. doi: 10.1016/j.metabol.2015.10.019
- 21Tomiyama, A. J., Hunger, J. M., Nguyen-Cuu, J., & Wells, C. (2016). Misclassification of cardiometabolic health when using body mass index categories in NHANES 2005-2012. International journal of obesity (2005), 40(5), 883–886. https://doi.org/10.1038/ijo.2016.17
Images:
- “Walking exercise” by bluesbby is licensed under CC BY 2.0
- Fig 7.8. “Components of weight” by Allison Calabrese is licensed under CC BY 4.0
- Fig 7.9. “Body fat caliper” by Jks111 is licensed under CC BY-SA 3.0
- Fig 7.10. “BIA hand device” by United States Marine Corps is in the Public Domain
- Fig 7.11. “Body composition measurement with whole-body air displacement plethysmography (ADP) technology” by cosmed is licensed under CC BY-SA 3.0
- Fig 7.12. “A Dual-energy X-ray absorptiometry (DEXA) scan” by Nick Smith is licensed under CC BY-SA 3.0
- Fig 7.13. “Fat Distribution” by Allison Calabrese is licensed under CC BY 4.0
- “Woman getting blood pressure checked” by Hush Naidoo Jade Photography is from Unsplash (license information)
The weight that a person can achieve and maintain while living their healthiest and happiest life.
A simple formula expressing the ratio of body weight and height; an inexpensive screening tool used in clinical and research settings to estimate body size and health risk.
The finding that overweight or mild obesity based on BMI can be associated with better health outcomes.
The proportion of a person's body mass that is made up of water, lean mass, fat, and other components.
A simple, non-invasive, and low-cost way to assess fat mass; calipers are used to measure the thickness of skin on three to seven different parts of the body, and these numbers are then entered into a conversion equation.
A simple, non-invasive, quick tool that estimates body composition by sending a small amount of electricity through the body.
A non-invasive, quick, but more expensive tool to estimate body composition by measuring air displacement when a person sits in an enclosed chamber.
One of the most accurate but more expensive methods of measuring body composition; this method scans the body with low-dose X-ray beams to determine fat, muscle, and bone mass.
Fat surrounding vital organs and stored deep within the abdominal cavity.
Fat stored just underneath the skin.
A measurement of waist size, taken just above the hip bone and level with the belly button and used to assess abdominal fat; waist circumferences greater than 40 inches for men and 35 inches for women are associated with greater health risks.
The ratio of waist and hip circumference (at its widest part), used to estimate abdominal fat; abdominal obesity is defined by the World Health Organization as waist-to-hip ratio above 0.90 for males and 0.85 for females.
The body’s ability to maintain normal homeostasis and effectively regulate measures like blood pressure, blood lipids, and blood glucose.
Individuals that are classified as obese (BMI > 30) but do not experience increased metabolic health risks.
Individuals who are classified as having a healthy weight (BMI < 25) but have indicators of poor metabolic health.
