
5.5 Preserving Biodiversity
Preserving biodiversity is an extraordinary challenge that must be met by greater understanding of biodiversity itself, changes in human behavior and beliefs, and various preservation strategies.
Change in Biodiversity through Time
The number of species on the planet, or in any geographical area, is the result of an equilibrium of two evolutionary processes that are ongoing: speciation and extinction. When speciation rates begin to outstrip extinction rates, the number of species will increase. Likewise, the reverse is true when extinction rates begin to overtake speciation rates. Throughout the history of life on Earth, as reflected in the fossil record, these two processes have fluctuated to a greater or lesser extent, sometimes leading to dramatic changes in the number of species on the planet as reflected in the fossil record (Figure 1).
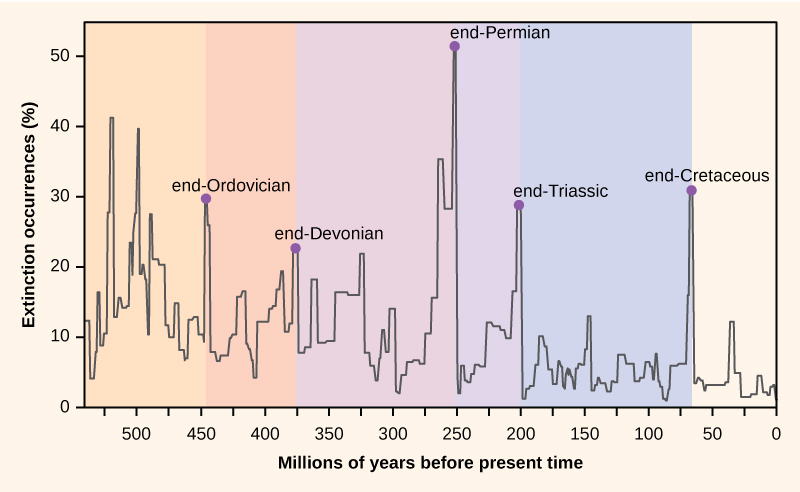
Paleontologists have identified five layers in the fossil record that appear to show sudden and dramatic losses in biodiversity. These are called mass extinctions and are characterized by more than half of all species disappearing from the fossil record. There are many lesser, yet still dramatic, extinction events, but the five mass extinctions have attracted the most research into their causes. An argument can be made that the five mass extinctions are only the five most extreme events in a continuous series of large extinction events throughout the fossil record (since 542 million years ago). The most recent extinction in geological time, about 65 million years ago, saw the disappearance of most dinosaurs species (except birds) and many other species. Most scientists now agree the main cause of this extinction was the impact of a large asteroid in the present-day Yucatán Peninsula and the subsequent energy release and global climate changes caused by dust ejected into the atmosphere.
Recent and Current Extinction Rates
Many biologists say that we are currently experiencing a sixth mass extinction and it mostly has to do with the activities of humans. There are numerous recent extinctions of individual species that are recorded in human writings. Most of these are coincident with the expansion of the European colonies since the 1500s.
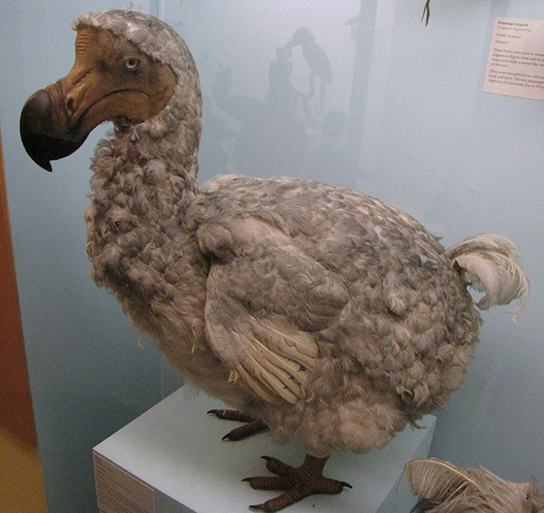
One of the earlier and popularly known examples is the dodo bird. The dodo bird lived in the forests of Mauritius, an island in the Indian Ocean. The dodo bird became extinct around 1662. It was hunted for its meat by sailors and was easy prey because the dodo, which did not evolve with humans, would approach people without fear. Introduced pigs, rats, and dogs brought to the island by European ships also killed dodo young and eggs (Figure 2).
Steller’s sea cow became extinct in 1768; it was related to the manatee and probably once lived along the northwest coast of North America. Steller’s sea cow was discovered by Europeans in 1741, and it was hunted for meat and oil. A total of 27 years elapsed between the sea cow’s first contact with Europeans and extinction of the species. The last Steller’s sea cow was killed in 1768. In another example, the last living passenger pigeon died in a zoo in Cincinnati, Ohio, in 1914. This species had once migrated in the millions but declined in numbers because of overhunting and loss of habitat through the clearing of forests for farmland.
These are only a few of the recorded extinctions in the past 500 years. The International Union for Conservation of Nature (IUCN) keeps a list of extinct and endangered species called the Red List. The list is not complete, but it describes 380 vertebrates that became extinct after 1500 AD, 86 of which were driven extinct by overhunting or overfishing.
Estimates of Present-day Extinction Rates
Estimates of extinction rates are hampered by the fact that most extinctions are probably happening without being observed. The extinction of a bird or mammal is often noticed by humans, especially if it has been hunted or used in some other way. But there are many organisms that are less noticeable to humans (not necessarily of less value) and many that are undescribed.
The background extinction rate is estimated to be about 1 per million species years (E/MSY). One “species year” is one species in existence for one year. One million species years could be one species persisting for one million years, or a million species persisting for one year. If it is the latter, then one extinction per million species years would be one of those million species becoming extinct in that year. For example, if there are 10 million species in existence, then we would expect 10 of those species to become extinct in a year. This is the background rate.
One contemporary extinction-rate estimate uses the extinctions in the written record since the year 1500. For birds alone, this method yields an estimate of 26 E/MSY, almost three times the background rate. However, this value may be underestimated for three reasons. First, many existing species would not have been described until much later in the time period and so their loss would have gone unnoticed. Second, we know the number is higher than the written record suggests because now extinct species are being described from skeletal remains that were never mentioned in written history. And third, some species are probably already extinct even though conservationists are reluctant to name them as such. Taking these factors into account raises the estimated extinction rate to nearer 100 E/MSY. The predicted rate by the end of the century is 1500 E/MSY.
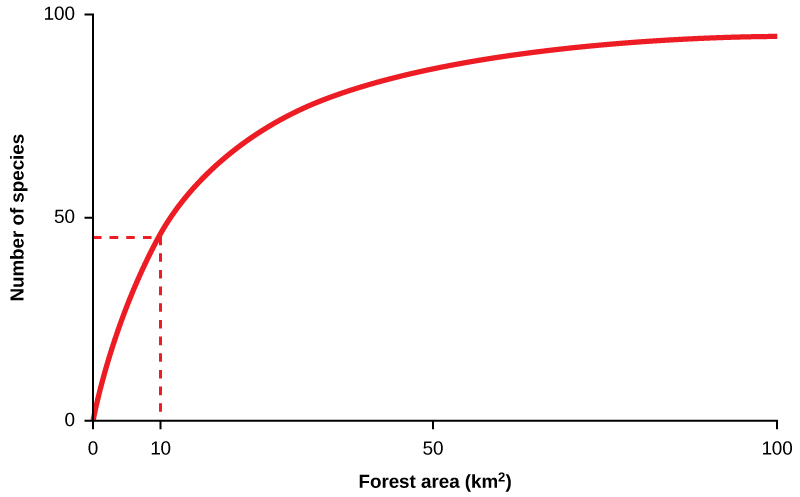
A second approach to estimating present-time extinction rates is to correlate species loss with habitat loss, and it is based on measuring forest-area loss and understanding species–area relationships. The species-area relationship is the rate at which new species are seen when the area surveyed is increased (Figure 3). Likewise, if the habitat area is reduced, the number of species seen will also decline. This kind of relationship is also seen in the relationship between an island’s area and the number of species present on the island: as one increases, so does the other, though not in a straight line. Estimates of extinction rates based on habitat loss and species–area relationships have suggested that with about 90 percent of habitat loss an expected 50 percent of species would become extinct. Figure 3 shows that reducing forest area from 100 km2 to 10 km2, a decline of 90 percent, reduces the number of species by about 50 percent. Species–area estimates have led to estimates of present-day species extinction rates of about 1000 E/MSY and higher.
Conservation of Biodiversity
The threats to biodiversity have been recognized for some time. Today, the main efforts to preserve biodiversity involve legislative approaches to regulate human and corporate behavior, setting aside protected areas, and habitat restoration.

Changing Human Behavior
Legislation has been enacted to protect species throughout the world. The legislation includes international treaties as well as national and state laws. The Convention on International Trade in Endangered Species of Wild Fauna and Flora (CITES) treaty came into force in 1975. The treaty, and the national legislation that supports it, provides a legal framework for preventing “listed” species from being transported across nations’ borders, thus protecting them from being caught or killed when the purpose involves international trade. The listed species that are protected by the treaty number some 33,000. The treaty is limited in its reach because it only deals with international movement of organisms or their parts. It is also limited by various countries’ ability or willingness to enforce the treaty and supporting legislation. The illegal trade in organisms and their parts is probably a market in the hundreds of millions of dollars.
Within many countries there are laws that protect endangered species and that regulate hunting and fishing. In the United States, the Endangered Species Act (ESA) was enacted in 1973. When an at-risk species is listed by the Act, the U.S. Fish & Wildlife Service is required by law to develop a management plan to protect the species and bring it back to sustainable numbers. The ESA, and others like it in other countries, is a useful tool, but it suffers because it is often difficult to get a species listed or to get an effective management plan in place once a species is listed.
The Migratory Bird Treaty Act (MBTA) is an agreement between the United States and Canada that was signed into law in 1918 in response to declines in North American bird species caused by hunting. The Act now lists over 800 protected species. It makes it illegal to disturb or kill the protected species or distribute their parts (much of the hunting of birds in the past was for their feathers). Examples of protected species include northern cardinals, the red-tailed hawk, and the American black vulture.
Global warming is expected to be a major driver of biodiversity loss. Many governments are concerned about the effects of anthropogenic global warming, primarily on their economies and food resources. Because greenhouse gas emissions do not respect national boundaries, the effort to curb them is international. The international response to global warming has been mixed. The Kyoto Protocol, an international agreement that came out of the United Nations Framework Convention on Climate Change that committed countries to reducing greenhouse gas emissions by 2012, was ratified by some countries, but spurned by others. Two countries that were especially important in terms of their potential impact that did not ratify the Kyoto protocol were the United States and China. Some goals for reduction in greenhouse gasses were met and exceeded by individual countries, but, worldwide, the effort to limit greenhouse gas production is not succeeding. A renegotiated 2016 treaty, called the Paris Agreement, once again brought nations together to take meaningful action on climate change. But like before, some nations are reluctant to participate.
Conservation in Preserves
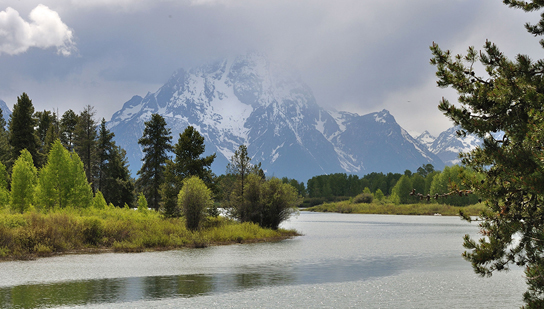
Establishment of wildlife and ecosystem preserves is one of the key tools in conservation efforts (Figure 4). A preserve is an area of land set aside with varying degrees of protection for the organisms that exist within the boundaries of the preserve. In 2003, the IUCN World Parks Congress estimated that 11.5 percent of Earth’s land surface was covered by preserves of various kinds. This area is large but only represents 9 out of 14 recognized major biomes and research has shown that 12 percent of all species live outside preserves.
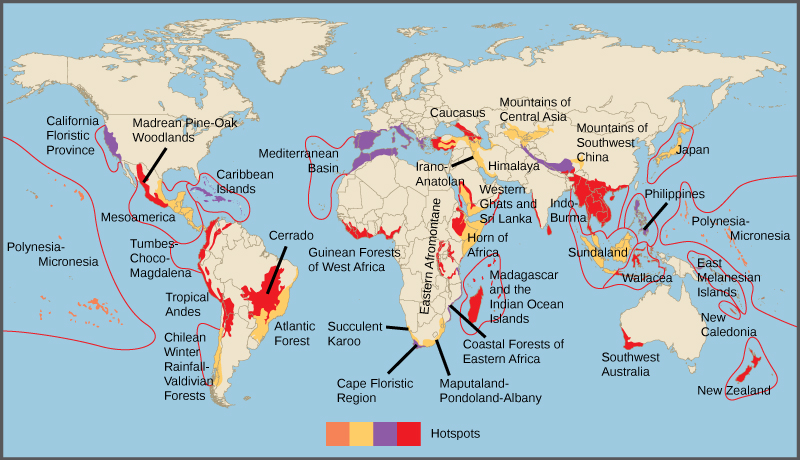
A biodiversity hotspot is a conservation concept developed by Norman Myers in 1988. Hotspots are geographical areas that contain high numbers of endemic species. The purpose of the concept was to identify important locations on the planet for conservation efforts, a kind of conservation triage. By protecting hotspots, governments are able to protect a larger number of species. The original criteria for a hotspot included the presence of 1500 or more species of endemic plants and 70 percent of the area disturbed by human activity. There are now 34 biodiversity hotspots (Figure 5) that contain large numbers of endemic species, which include half of Earth’s endemic plants.
There has been extensive research into optimal preserve designs for maintaining biodiversity. The fundamental principles behind much of the research have come from the seminal theoretical work of Robert H. MacArthur and Edward O. Wilson published in 1967 on island biogeography.1 This work sought to understand the factors affecting biodiversity on islands. Conservation preserves can be seen as “islands” of habitat within “an ocean” of non-habitat. In general, large preserves are better because they support more species, including species with large home ranges; they have more core area of optimal habitat for individual species; they have more niches to support more species; and they attract more species because they can be found and reached more easily. One large preserve is better than the same area of several smaller preserves because there is more core habitat unaffected by less hospitable ecosystems outside the preserve boundary. For this same reason, preserves in the shape of a square or circle will be better than a preserve with many thin “arms.” If preserves must be smaller, then providing wildlife corridors (narrow strips of protected land) between two preserves is important so that species and their genes can move between them. All of these factors are taken into consideration when planning the nature of a preserve before the land is set aside.
In addition to the physical specifications of a preserve, there are a variety of regulations related to the use of a preserve. These can include anything from timber extraction, mineral extraction, regulated hunting, human habitation, and nondestructive human recreation. Many of the decisions to include these other uses are made based on political pressures rather than conservation considerations. On the other hand, in some cases, wildlife protection policies have been so strict that subsistence-living indigenous populations have been forced from ancestral lands that fell within a preserve. In other cases, even if a preserve is designed to protect wildlife, if the protections are not or cannot be enforced, the preserve status will have little meaning in the face of illegal poaching and timber extraction. This is a widespread problem with preserves in the tropics.

Climate change will create inevitable problems with the location of preserves as the species within them migrate to higher latitudes as the habitat of the preserve becomes less favorable. Planning for the effects of global warming on future preserves, or adding new preserves to accommodate the changes expected from global warming is in progress, but will only be as effective as the accuracy of the predictions of the effects of global warming on future habitats.
Finally, an argument can be made that conservation preserves reinforce the cultural perception that humans are separate from nature, can exist outside of it, and can only operate in ways that do damage to biodiversity. Creating preserves reduces the pressure on human activities outside the preserves to be sustainable and non-damaging to biodiversity. Ultimately, the political, economic, and human demographic pressures will degrade and reduce the size of conservation preserves if the activities outside them are not altered to be less damaging to biodiversity.
Habitat Restoration
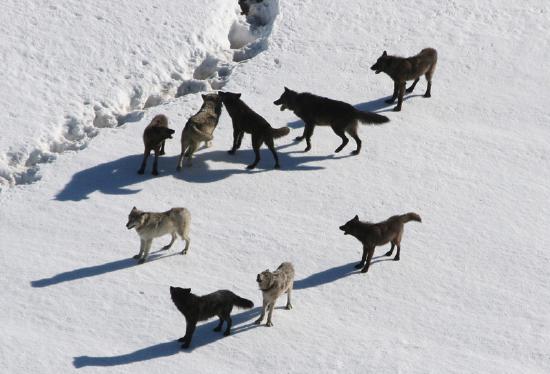
Habitat restoration is the process of bringing an area back to its natural state, before it was impacted through destructive human activities. It holds considerable promise as a mechanism for maintaining or restoring biodiversity. Reintroducing wolves, a top predator, to Yellowstone National Park in 1995 led to dramatic changes in the ecosystem that increased biodiversity. The wolves (Figure 6) function to suppress elk and coyote populations and provide more abundant resources to the detritivores. Reducing elk populations has allowed revegetation of riparian (the areas along the banks of a stream or river) areas, which has increased the diversity of species in that habitat. Reduction of coyote populations by wolves has increased the prey species previously suppressed by coyotes. In this habitat, the wolf is a keystone species, meaning a species that is instrumental in maintaining diversity within an ecosystem. Removing a keystone species from an ecological community causes a collapse in diversity. The results from the Yellowstone experiment suggest that restoring a keystone species effectively can have the effect of restoring biodiversity in the community. Ecologists have argued for the identification of keystone species where possible and for focusing protection efforts on these species. It makes sense to return the keystone species to the ecosystems where they have been removed.
Other large-scale restoration experiments underway involve dam removal. In the United States, since the mid-1980s, many aging dams are being considered for removal rather than replacement because of shifting beliefs about the ecological value of free-flowing rivers. The measured benefits of dam removal include restoration of naturally fluctuating water levels (often the purpose of dams is to reduce variation in river flows), which leads to increased fish diversity and improved water quality. In the Pacific Northwest of the United States, dam removal projects are expected to increase populations of salmon, which is considered a keystone species because it transports nutrients to inland ecosystems during its annual spawning migrations. In other regions, such as the Atlantic coast, dam removal has allowed the return of other spawning anadromous fish species (species that are born in fresh water, live most of their lives in salt water, and return to fresh water to spawn). Some of the largest dam removal projects have yet to occur or have happened too recently for the consequences to be measured, such as Elwha Dam on the Olympic Peninsula of Washington State. The large-scale ecological experiments that these removal projects constitute will provide valuable data for other dam projects slated either for removal or construction.
The Role of Zoos and Captive Breeding
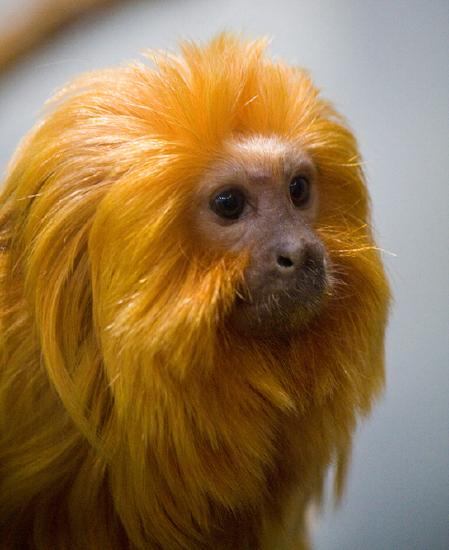
Zoos have sought to play a role in conservation efforts both through captive breeding programs and education (Figure 7). The transformation of the missions of zoos from collection and exhibition facilities to organizations that are dedicated to conservation is ongoing. In general, it has been recognized that, except in some specific targeted cases, captive breeding programs for endangered species are inefficient and often prone to failure when the species are reintroduced to the wild. Zoo facilities are far too limited to contemplate captive breeding programs for the numbers of species that are now at risk. Education, on the other hand, is a potential positive impact of zoos on conservation efforts, particularly given the global trend to urbanization and the consequent reduction in contacts between people and wildlife. A number of studies have been performed to look at the effectiveness of zoos on people’s attitudes and actions regarding conservation and at present, the results tend to be mixed.
Suggested Supplemental Reading:
Paterniti. 2017. Should we Kill Animals to Save Them? National Geographic. October.
Quammen. 2019. Saving Africa’s Parks. National Geographic. December
Attribution
