
7.1 Water Cycle and Fresh Water Supply
Water, air, and food are the most important natural resources to people. Humans can live only a few minutes without oxygen, less than a week without water, and about a month without food. Water also is essential for our oxygen and food supply. Plants breakdown water and use it to create oxygen during the process of photosynthesis.
Water is the most essential compound for all living things. Human babies are approximately 75% water and adults are 60% water. Our brain is about 85% water, blood and kidneys are 83% water, muscles are 76% water, and even bones are 22% water. We constantly lose water by perspiration; in temperate climates we should drink about 2 quarts of water per day and people in hot desert climates should drink up to 10 quarts of water per day. Loss of 15% of body-water usually causes death.
Earth is truly the Water Planet. The abundance of liquid water on Earth’s surface distinguishes us from other bodies in the solar system. About 70% of Earth’s surface is covered by oceans and approximately half of Earth’s surface is obscured by clouds (also made of water) at any time. There is a very large volume of water on our planet, about 1.4 billion cubic kilometers (km3) (330 million cubic miles) or about 53 billion gallons per person on Earth. All of Earth’s water could cover the United States to a depth of 145 km (90 mi). From a human perspective, the problem is that over 97% of it is seawater, which is too salty to drink or use for irrigation. The most commonly used water sources are rivers and lakes, which contain less than 0.01% of the world’s water!
One of the most important environmental goals is to provide clean water to all people. Fortunately, water is a renewable resource and is difficult to destroy. Evaporation and precipitation combine to replenish our fresh water supply constantly; however, water availability is complicated by its uneven distribution over the Earth. Arid climate and densely populated areas have combined in many parts of the world to create water shortages, which are projected to worsen in the coming years due to population growth and climate change. Human activities such as water overuse and water pollution have compounded significantly the water crisis that exists today. Hundreds of millions of people lack access to safe drinking water, and billions of people lack access to improved sanitation as simple as a pit latrine. As a result, nearly two million people die every year from diarrheal diseases and 90% of those deaths occur among children under the age of 5. Most of these are easily prevented deaths.
Water Reservoirs and Water Cycle
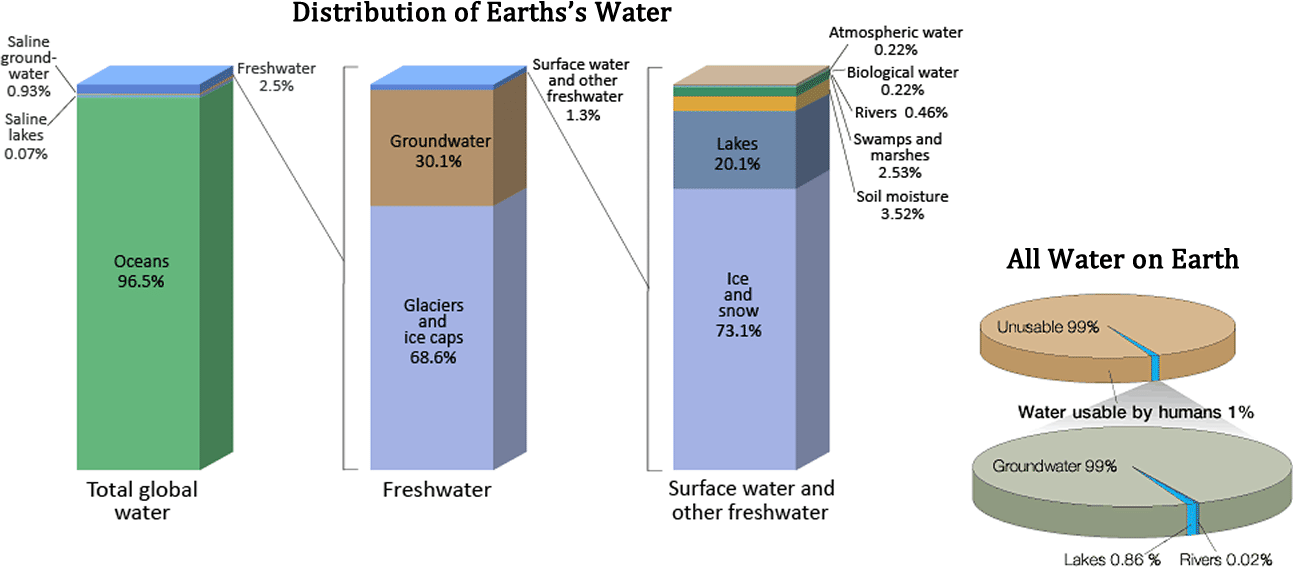
Water is the only common substance that occurs naturally on earth in three forms: solid, liquid and gas. It is distributed in various locations, called water reservoirs. The oceans are by far the largest of the reservoirs with about 97% of all water but that water is too saline for most human uses (Figure 1). Ice caps and glaciers are the largest reservoirs of fresh water but this water is inconveniently located, mostly in Antarctica and Greenland. Shallow groundwater is the largest reservoir of usable fresh water. Although rivers and lakes are the most heavily used water resources, they represent only a tiny amount of the world’s water. If all of world’s water was shrunk to the size of 1 gallon, then the total amount of fresh water would be about 1/3 cup, and the amount of readily usable fresh water would be 2 tablespoons.
The water (or hydrologic) cycle (that was covered in Chapter 3.2) shows the movement of water through different reservoirs, which include oceans, atmosphere, glaciers, groundwater, lakes, rivers, and biosphere. Solar energy and gravity drive the motion of water in the water cycle. Simply put, the water cycle involves water moving from oceans, rivers, and lakes to the atmosphere by evaporation, forming clouds. From clouds, it falls as precipitation (rain and snow) on both water and land. The water on land can either return to the ocean by surface runoff, rivers, glaciers, and subsurface groundwater flow, or return to the atmosphere by evaporation or transpiration (loss of water by plants to the atmosphere).
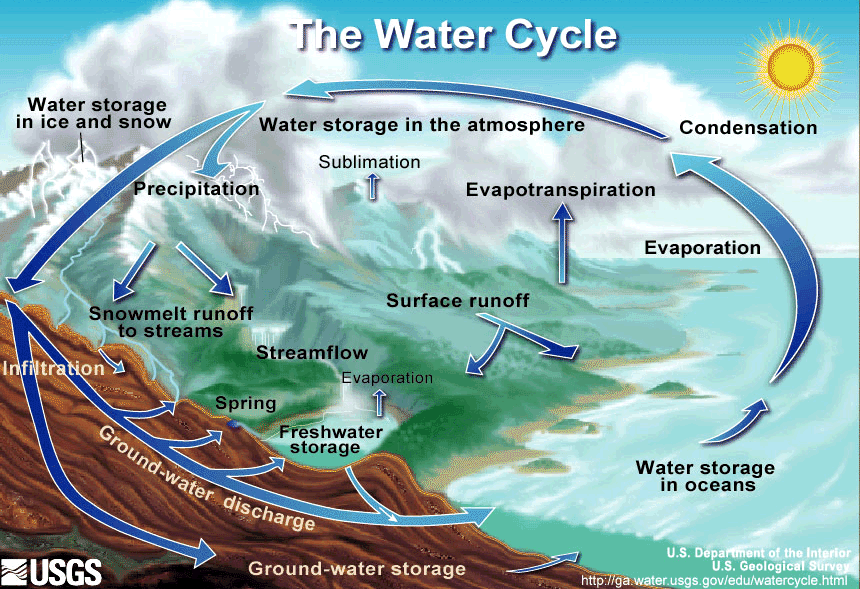
An important part of the water cycle is how water varies in salinity, which is the abundance of dissolved ions in water. The saltwater in the oceans is highly saline, with about 35,000 mg of dissolved ions per liter of seawater. Evaporation (where water changes from liquid to gas at ambient temperatures) is a distillation process that produces nearly pure water with almost no dissolved ions. As water vaporizes, it leaves the dissolved ions in the original liquid phase. Eventually, condensation (where water changes from gas to liquid) forms clouds and sometimes precipitation (rain and snow). After rainwater falls onto land, it dissolves minerals in rock and soil, which increases its salinity. Most lakes, rivers, and near-surface groundwater have a relatively low salinity and are called freshwater. The next several sections discuss important parts of the water cycle relative to fresh water resources.
Primary Fresh Water Resources: Precipitation
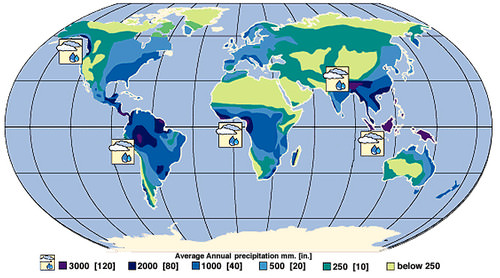
Precipitation levels are unevenly distributed around the globe, affecting fresh water availability (Figure 3). More precipitation falls near the equator, whereas less precipitation tends to fall near 30 degrees north and south latitude, where the world’s largest deserts are located. These rainfall and climate patterns are related to global wind circulation cells. The intense sunlight at the equator heats air, causing it to rise and cool, which decreases the ability of the air mass to hold water vapor and results in frequent rainstorms. Around 30 degrees north and south latitude, descending air conditions produce warmer air, which increases its ability to hold water vapor and results in dry conditions. Both the dry air conditions and the warm temperatures of these latitude belts favor evaporation. Global precipitation and climate patterns are also affected by the size of continents, major ocean currents, and mountains.
Surface Water Resources: Rivers, Lakes, Glaciers
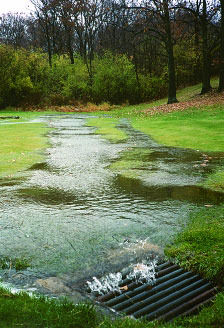
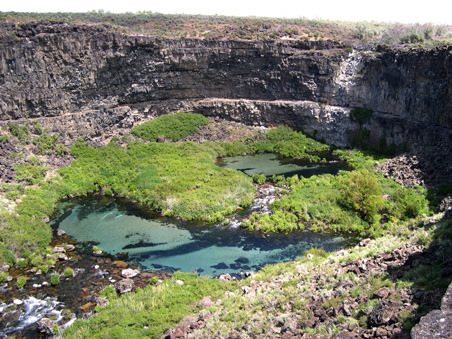
Flowing water from rain and melted snow on land enters river channels by surface runoff (Figure 4) and groundwater seepage (Figure 5). River discharge describes the volume of water moving through a river channel over time (Figure 6). The relative contributions of surface runoff vs. groundwater seepage to river discharge depend on precipitation patterns, vegetation, topography, land use, and soil characteristics. Soon after a heavy rainstorm, river discharge increases due to surface runoff. The steady normal flow of river water is mainly from groundwater that discharges into the river. Gravity pulls river water downhill toward the ocean. Along the way the moving water of a river can erode soil particles and dissolve minerals. Groundwater also contributes a large amount of the dissolved minerals in river water. The geographic area drained by a river and its tributaries is called a drainage basin or watershed. The Mississippi River drainage basin includes approximately 40% of the U.S., a measure that includes the smaller drainage basins, such as the Ohio River and Missouri River that help to comprise it. Rivers are an important water resource for irrigation of cropland and drinking water for many cities around the world. Rivers that have had international disputes over water supply include the Colorado (Mexico, southwest U.S.), Nile (Egypt, Ethiopia, Sudan), Euphrates (Iraq, Syria, Turkey), Ganges (Bangladesh, India), and Jordan (Israel, Jordan, Syria).
In addition to rivers, lakes can also be an excellent source of freshwater for human use. They usually receive water from surface runoff and groundwater discharge. They tend to be short-lived on a geological time-scale because they are constantly filling in with sediment supplied by rivers. Lakes form in a variety of ways including glaciation, recent tectonic uplift (e.g., Lake Tanganyika, Africa), and volcanic eruptions (e.g., Crater Lake, Oregon). People also create artificial lakes (reservoirs) by damming rivers. Large changes in climate can result in major changes in a lake’s size. As Earth was coming out of the last Ice Age about 15,000 years ago, the climate in the western U.S. changed from cool and moist to warm and arid, which caused more than 100 large lakes to disappear. The Great Salt Lake in Utah is a remnant of a much larger lake called Lake Bonneville.

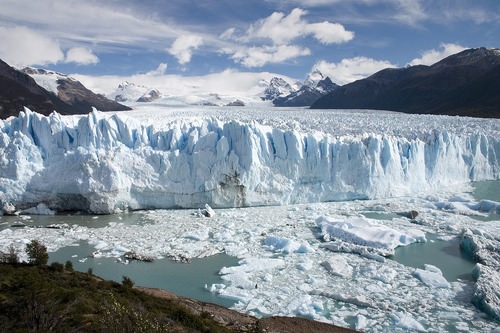
Although glaciers represent the largest reservoir of fresh water, they generally are not used as a water source because they are located too far from most people (Figure 7). Melting glaciers do provide a natural source of river water and groundwater. During the last Ice Age there was as much as 50% more water in glaciers than there is today, which caused sea level to be about 100 m lower. Over the past century, sea level has been rising in part due to melting glaciers. If Earth’s climate continues to warm, the melting glaciers will cause an additional rise in sea level.
Groundwater Resources
Although most people in the world use surface water, groundwater is a much larger reservoir of usable fresh water, containing more than 30 times more water than rivers and lakes combined. Groundwater is a particularly important resource in arid climates, where surface water may be scarce. In addition, groundwater is the primary water source for rural homeowners, providing 98% of that water demand in the U.S.. Groundwater is water located in small spaces, called pore space, between mineral grains and fractures in subsurface earth materials (rock or sediment). Most groundwater originates from rain or snowmelt, which infiltrates the ground and moves downward until it reaches the saturated zone (where groundwater completely fills pore spaces in earth materials).
Other sources of groundwater include seepage from surface water (lakes, rivers, reservoirs, and swamps), surface water deliberately pumped into the ground, irrigation, and underground wastewater treatment systems (septic tanks). Recharge areas are locations where surface water infiltrates the ground rather than running into rivers or evaporating. Wetlands, for example, are excellent recharge areas. A large area of sub-surface, porous rock that holds water is an aquifer. Aquifers are commonly drilled, and wells installed, to provide water for agriculture and personal use.
Water Use in the U.S. and World
People need water, oftentimes large quantities, to produce the food, energy, and mineral resources they use. Consider, for example, these approximate water requirements for some things people in the developed world use every day: one tomato = 3 gallons; one kilowatt-hour of electricity from a thermoelectric power plant = 21 gallons; one loaf of bread = 150 gallons; one pound of beef = 1,600 gallons; and one ton of steel = 63,000 gallons. Human beings require only about 1 gallon per day to survive, but a typical person in a U.S. household uses approximately 100 gallons per day, which includes cooking, washing dishes and clothes, flushing the toilet, and bathing. The water demand of an area is a function of the population and other uses of water.
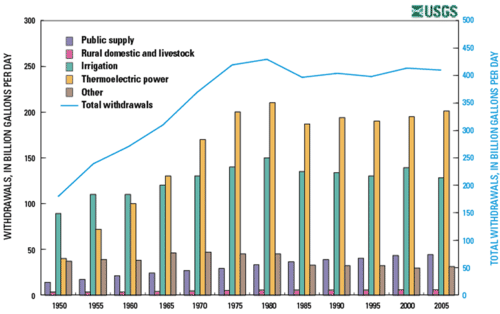

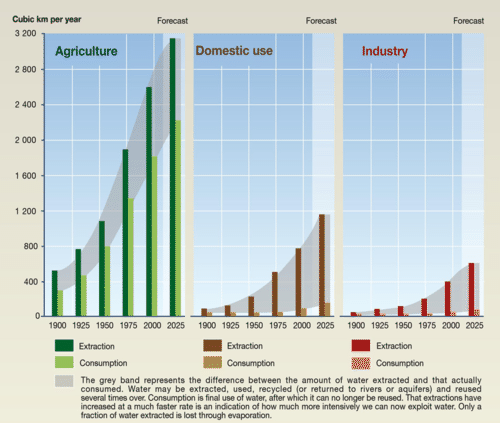
Global total water use is steadily increasing at a rate greater than world population growth (Figure 10). During the 20th century global population tripled and water demand grew by a factor of six. The increase in global water demand beyond the rate of population growth is due to improved standard of living without an offset by water conservation. Increased production of goods and energy entails a large increase in water demand. The major global water uses are irrigation (68%), public supply (21%), and industry (11%).
Attribution
Essentials of Environmental Science by Kamala Doršner is licensed under CC BY 4.0. Modified from the original by Matthew R. Fisher.
