
Food
Elizabeth B. Pearce and Amy Huskey
Survivalists have a rule of three: you can survive without food for three weeks, without water for three days, without shelter from a harsh environment for three hours, and without air for three minutes.[1] If a human goes without any of these resources for a long enough time, death will eventually be the result. It stands to reason that when we talk about American families’ needs, we would talk about all of these; in this chapter we will look at both food and water.
Abraham Maslow’s Hierarchy of Needs theory (1943) describes these physiological needs as being a key motivator in human behavior.[2] Obtaining food, water, shelter, sleep and oxygen to survive consumes a large amount of our time and resources both directly and indirectly. Think about how much time your family spends working to pay for food. In general, families pay a smaller percentage of their income for food than they did 50 years ago. That’s not because food expenses have decreased, but because other costs, primarily shelter and health care, have increased. We discuss shelter (housing and living environments) in the Housing chapter. Now consider your family’s access to water. While we may not think about paying for it as a percentage of our incomes, access to plentiful, clean, safe water is influenced by where we live. The financial resources that are invested into our community infrastructure, which includes water and sanitation, impact our safety and overall health. Where we live matters when it comes to having available and safe water.
Personal finances are only one part of the cost, benefits, and societal dynamics that play into meeting these basic needs. We must pay attention to where foods come from, business and government investment in food production, and the business of food charity. Time is another cost of food; families decide how much time is spent purchasing, preparing, eating, and cleaning up meals. Turning on a faucet to access clean, toxin free drinking water requires building, maintaining, and monitoring water and sanitation systems, and this comes at a cost that not all municipalities can afford. While the federal government has invested in water infrastructure, there is not an ongoing commitment, so these needs must be balanced with competing needs such as schools, parks, police, and libraries. There are variations and influences on how food and water needs are met, but ultimately they must be met in some way.
Producing Food
Prior to the formation of the United States, families found food in a variety of ways, including foraging, hunting, fishing, and growing food. As the country progressed toward a formal organizational structure managed by the Euro-American settlers, Native Americans were restricted to designated reservations, often on land that was not as fertile for farming. Food production via farms became a major economic factor. Industrialization created more efficiencies and more wealth for landowners.
It is important to note that these new ways of sourcing food would not have been possible without three institutional structures:
- Oppression of the way of life that Native Americans had established here for thousands of years;
- Enslavement of African immigrants brought to this country for the explicit purpose of free labor without attention to their rights and needs;
- Laws that controlled immigrants from other countries by limiting who could immigrate by gender, familial, and employment status; laws that discriminate based on nationality and immigration status related to wage, housing options, and kind of employment.
These structures affected the functionality of all families in the United States, favoring White families, especially those who owned land. Which of these structures affect families today? If you answered all three, you are correct. Native Americans are still fighting for rights related to their family needs that have been disrupted and restricted; the aftereffects of slavery, including the restrictions of wealth attainment on Black people, affects both the families who were able to accumulate wealth and the ones who were not; and current immigration laws still place the needs of the employers first.
Black Farmers
Black farmers in America have had a long and arduous struggle to own land and to operate independently. For more than a century after the Civil War, deficient civil rights and various economic and social barriers were applied to maintaining a system where many Blacks worked as farm operators with a limited and often total lack of opportunity to achieve ownership and operating independence. Although some formerly enslaved people were deeded land in the famous “Forty Acres and a Mule” division of lands in 1868, the same land was later deeded back to the original Confederate owners and the Black families became sharecroppers rather than owners. Other Black farm owners saw their properties diminished throughout the 20th century as described in this fifteen-minute video.
These personal stories help us understand how families that worked hard still were treated unjustly. Black farmers often ended up working for landowners once again. Even as employees, they received less protection than factory and office workers. When Social Security and Unemployment laws meant to protect workers were passed, they excluded people who worked on farms or as domestic help, of which the majority were immigrants and minoritized groups, including African Americans. Diminished civil rights also limited collective action strategies, such as cooperatives and unions.
It is tempting to think that these past laws and practices do not affect us today. Many of the structures survive, however, in both subtle and obvious ways. In addition, because these structures limited access and land ownership in proximity to the vital resources of food and water, Euro-Americans were able to build wealth more quickly and easily than any other group of families. We discuss the institutional factors related to housing, location, and wealth in the Housing chapter.
Farm and Field Workers
Farm workers are and have been an essential part of the United States economy and food system. They come in varying immigration statuses, United States citizens or residents, folx on guest worker visas, or they could be undocumented workers. The following USDA table describes the demographic characteristics of farm workers in the United States in 2018 from the USDA, collected from data on the American Community Survey (part of the Census project). The data shows that about 55% of farm laborers are born in countries other than the United States.
| Item | Farm laborers, graders and sorters | Farm managers, inspectors, and supervisors | All other occupations in agriculture | Agriculture: All occupations | All U.S. private wage and salary workers |
| Percent female | 25 | 13 | 32 | 26 | 45 |
| Average age in years | 39 | 43 | 42 | 40 | 40 |
| Percent under age 25 | 22 | 13 | 15 | 19 | 18 |
| Percent over age 44 | 38 | 46 | 47 | 41 | 41 |
| Percent married | 47 | 61 | 52 | 51 | 48 |
| Race/Ethnicity/Ancestry | |||||
| Percent White, not Hispanic | 32 | 64 | 59 | 43 | 60 |
| Percent Black, not Hispanic | 3 | 3 | 5 | 3 | 12 |
| Percent other, not Hispanic | 2 | 3 | 3 | 2 | 9 |
| Percent Hispanic: Mexican origin | 57 | 27 | 28 | 45 | 12 |
| Percent Hispanic: Other | 7 | 3 | 6 | 6 | 7 |
| Percent born in U.S. (includes Puerto Rico) | 45 | 76 | 75 | 57 | 80 |
| Percent U.S. citizens | 54 | 84 | 83 | 65 | 90 |
| Education | |||||
| Percent lacking high school diploma | 48 | 24 | 20 | 38 | 9 |
| Percent with high school diploma (includes equivalency) | 32 | 31 | 33 | 32 | 29 |
| Percent with at least some college | 20 | 45 | 47 | 30 | 62 |
Differences in demographics are also evident between crop and livestock workers (not shown in table). A larger share of laborers in crops and related support industries are female (28 percent versus 20 percent in livestock). Crop laborers are also less likely to be non-Hispanic White (25 percent versus 48 percent for livestock), and less likely to have been born in the United States (39 percent for crop workers in manual labor occupations versus 60 percent for manual livestock workers). Finally, crop laborers have lower levels of educational attainment: 52 percent lack a high school degree, compared with 37 percent in livestock.
Notably, the U.S. Department of Labor’s National Agricultural Workers Survey (NAWS), discussed below, finds larger shares of foreign-born, Hispanic, and less educated employees among crop and support workers than does the ACS (livestock workers are not surveyed in NAWS). For example, NAWS estimates that in Fiscal Years 2015-16, just 25 percent of crop farm workers in manual labor occupations were U.S. born, compared with 39 percent in the ACS.
Since this data is gathered from a written survey related to the Census, it is important to note that there is likely some underreporting from groups that are the hardest to reach, including people of color, children under five, renters, immigrants, people with limited English proficiency, multiple-family homes, Native tribal and urban communities, disabled people, people who distrust the government, and LGBTQ+ individuals. This is discussed at length in the Representation chapter.
The survey also tells us that the average age for farmworkers is on the rise, and they are more likely to be female. Younger immigrants are less likely to go into farm work than into other professions, so the population is aging. It is hypothesized that as men move toward agricultural employment (rather than working with crops) and there is increased machine usage, women are moving into these jobs.
Immigrants, especially those who are not yet documented or who live in mixed-status families, are more likely to experience poor treatment and be less likely to complain about bad work conditions.
Field Workers
By Carla Medel, Bachelor’s Degree candidate: Psychology with Spanish and HDFS minors, Oregon State University, 2021.
103 degrees Fahrenheit, picking zucchini, I turn to the sound of “water, water, we need water!” and to the woman with the purple bandana and a hurt shoulder on the ground; she had fainted of dehydration. She sits underneath a tree for 15 minutes with a bottle of water that one of our coworkers was able to give her and before I even know it, she is back on the field picking zucchini along my side.
That afternoon as I made my way home, I could not help but to begin crying out of frustration. I was only 16 but I knew that what I had just witnessed was not correct. Feeling hopeless, the next day I no longer wanted to go back to work. What I did instead, was go grocery shopping with my mom. When we headed to produce, and I saw people grabbing zucchini, the tears came again. They did not know what those .76¢ zucchini really cost. This is my story, but this is definitely not a unique one. Immigrant farm workers in the United States are treated terribly, and with little to no protection, others are ready to take advantage.
Food Factory Workers
The recent Coronavirus pandemic has brought necessary attention to the important function of meat production and the preservation of fruits and vegetables in factories. The federal government has determined them to be essential workers. Many of these workers are immigrants and people of color.
The authors of this text plan to elaborate on this group of families in future editions of the text. For now, this podcast which highlights the experience of a mother supporting a family of five who works in the Smithfield pork plant in South Dakota illustrates the dilemmas an essential worker faces.
Procuring Food
We’ll discuss getting food, and what causes some families to be hungry, or the more technical term, “food insecure.” We acknowledge that food insecurity is a symptom of another social problem, poverty. First, let’s look at some of the systems that affect food availability in the United States.
Equitable access to food is hampered by governmental systems that focus on subsidizing specific farm crops. Federal government subsidies help farmers reduce their risk due to weather, commodities brokers, economic downturns, and changes in demand. There are only five crops that receive these major government subsidies: corn, soybeans, wheat, cotton, and rice. Producers of fruit, vegetables and meat only benefit from crop insurance and disaster relief.[4] Farm subsidies have increased dramatically in the last four years, totaling $28 billion dollars for a two year period (2018-2020, not including the additional Coronavirus payments authorized in the spring of 2020).[5] This incentivizes the production of certain crops in the United States and provides stability for the families involved in producing those crops.

It is more complicated to measure the effects of these subsidies on consumers. We know that these subsidized food crops (corn, soybeans, wheat and rice) are more easily stored and utilized in processed foods, which nutritionists advise should be eaten in the smallest amounts. Crops in their raw forms, such as fruits, vegetables, legumes, meat, and dairy products, provide more health benefits but are not subsidized consistently by the government. Here we may deduce that governmental subsidies of less healthy crops contributes to food availability and cost, affecting food purchases. Lower income families and those living in food deserts (described in the next section) are most affected.
Another challenge to food accessibility is the societal approach which focuses on governmental programs (such as the Supplemental Nutrition Assistance Program–SNAP, which will be described later) and charity, which in itself has become a business. Grocery stores and other businesses are provided with tax benefits when they overproduce food and donate it to food banks. Andy Fisher, the author of Big Hunger, describes hearing from grocery store owners who acknowledge the overproduction of sheet cakes, birthday cakes, pastries, and other baked goods. Consumers do not wish to purchase the last cake on the shelf, and so stores overproduce these items. When they are no longer considered fresh, they are donated to food banks. This is one of the reasons that about 25% of the donations that Food Banks give away consist of food that is categorized as unhealthy.[6]
Listen to Mr. Fisher describe the complexities of this cycle here.
Not only is overproduction of food supported by tax deductions, but food banks themselves have become multi-million dollar businesses (also described in the above podcast). Food banks serve a charitable purpose that meets an immediate and important need. At the same time, if the real problem–poverty–were addressed, people could have the dignity of providing and choosing the food that is best for their own family.
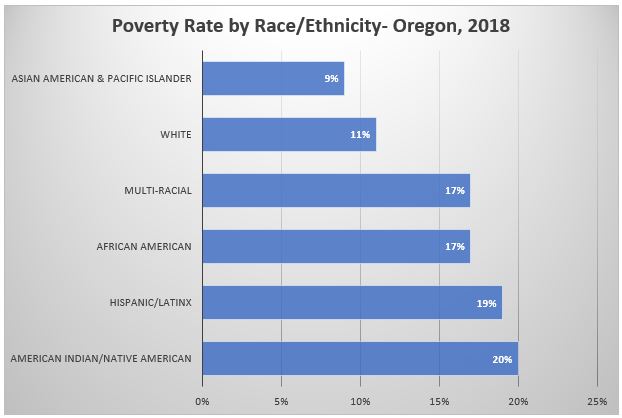
Poverty affects Americans of every racial-ethnic group, including those descended from European immigrants, but continues to affect the previously mentioned groups (Native Americans, Black or African Americans, and people descended from Latinx and some Asian countries) in disproportionately larger numbers.[7] The United States is an individualistic country and people are sometimes blamed for being poor. This makes the problem of hunger more approachable than the problem of poverty. It is encouraging to note, however, that Americans increasingly understand that poverty stems not from personal shortcomings but from differentiation in circumstance and opportunity. Pew Center survey results released in March, 2020, note that almost ⅔ of American adults say that people who are rich have experienced more advantages than those who are poor; only ⅓ say that it is because rich people have worked harder. These viewpoints are uneven related to political affiliation and age, with Democrats and younger people more likely to hold the majority view.[8] If more people view poverty as a social problem than a personal problem, it is more likely to be solved with a systemic solution.
Food Deserts
Perhaps you are familiar with this term, or have lived in a food desert. If you travel by bicycle or via public transport, you may be more aware of food deserts in your community. Food deserts are geographic locations where there is not a variety of healthy food readily available (within a mile in urban environments or within 10-20 miles in a rural area). Food deserts occur nationally, with a greater concentration of food deserts in the Midwest and southern states.
Think about the community that you live in. Where are the grocery stores? Convenience stores don’t count, because they do not typically have fresh fruits and vegetables. Are the stores even spaced out amongst the neighborhoods? Probably not, and typically the dearth of stores is in lower income neighborhoods. The same parts of Portland, Oregon that are identified as redlined neighborhoods in the Housing chapter are also food deserts. The Oregon State (OSU) Barometer wrote about food deserts in Corvallis in 2019, pointing out that the majority of grocery stores in Corvallis are clustered around 9th Street and Walnut Boulevard.[9] Two of the four stores that are more distantly spaced are among the healthiest, emphasizing organic produce and natural foods, but also the most expensive.
What if there were federal funding to support equitable distribution of grocery stores that had a full selection of healthy foods? In the same way that federal subsidies protect farmers of selected crops from economic problems, they could protect grocery businesses and create greater equity for many consumers.
To learn more about food deserts, or to access an interactive map that displays different ways of viewing food deserts, read NPR’s article “How to find a food desert near you” and follow the link to the USDA’s Food Atlas.
The Poverty Line and Food Costs
How is poverty defined? While there are multiple measures, a common and shared one is the Poverty Threshold, also known as the Poverty Line. While poverty will affect all of the families related to all of the topics in this text, we will discuss it here because it was originally tied to the cost of food, specifically an “economy food plan.” In 1963, the poverty line was designated at three times the economy food plan, and it was assumed “that the housewife will be a careful shopper, a skillful cook, and a good manager who will prepare all the family’s meals at home.”[10]
When U.S. officials became concerned about poverty during the 1960s, they quickly realized they needed to find out how much poverty we had. To do so, a measure of official poverty, or a poverty line, was needed. A government economist, Mollie Orshanky, first calculated this line in 1963 by multiplying the cost of a very minimal diet by three, as a 1955 government study had determined that the typical American family spent one third of its income on food. Thus a family whose cash income is lower than three times the cost of a very minimal diet is considered officially poor.
This way of calculating the official poverty line has not changed since 1963, although the amount is adjusted by inflation. It is thus out of date for many reasons. For example, many expenses, such as heat and electricity, child care, transportation, and health care, now occupy a greater percentage of the typical family’s budget than was true in 1963. In addition, this official measure ignores a family’s non-cash income from benefits such as food stamps and tax credits. As a national measure, the poverty line also fails to take into account regional differences in the cost of living. All these problems make the official measurement of poverty highly suspect. As one poverty expert observes, “The official measure no longer corresponds to reality. It doesn’t get either side of the equation right—how much the poor have or how much they need. No one really trusts the data.”[11]
This is a good time to ask yourself, if you looked at food as a percentage of your budget, would it be the equivalent of 33%? That’s how the poverty line is still calculated.
The poverty line is adjusted annually for inflation and takes into account the number of people in a family: The larger the family size, the higher the poverty line. In 2010, the poverty line for a nonfarm family of four (two adults, two children) was $22,213. A four-person family earning even one more dollar than $22,213 in 2010 was not officially poor, even though its “extra” income hardly lifted it out of dire economic straits. Poverty experts have calculated a no-frills budget that enables a family to meet its basic needs in food, clothing, shelter, and so forth; this budget is about twice the poverty line. Families with incomes between the poverty line and twice the poverty line (or twice poverty) are barely making ends meet, but they are not considered officially poor.
When we talk here about the poverty level, then, keep in mind that we are talking only about official poverty and that there are many families and individuals living in near poverty who have trouble meeting their basic needs, especially when they face unusually high medical expenses, motor vehicle expenses, college debt, or the like. For this reason, many analysts think families need incomes twice as high as the federal poverty level just to get by.[12] They thus use twice-poverty data (i.e., family incomes below twice the poverty line) to provide a more accurate understanding of how many Americans face serious financial difficulties, even if they are not living in official poverty.[13]
Food Security and Food Insecurity
Identified in 1995 as a measurable problem, the USDA introduced new language to describe ranges of severity of food insecurity in 2006. The methods used to assess households’ food security remained unchanged. Here are the current definitions of food security and food insecurity.
Food Security
- High food security (old label=Food security): no reported indications of food-access problems or limitations.
- Marginal food security (old label=Food security): one or two reported indications—typically of anxiety over food sufficiency or shortage of food in the house. Little or no indication of changes in diets or food intake.
Food Insecurity
- Low food security (old label=Food insecurity without hunger): reports of reduced quality, variety, or desirability of diet. Little or no indication of reduced food intake.
- Very low food security (old label=Food insecurity with hunger): Reports of multiple indications of disrupted eating patterns and reduced food intake.[14]
According to the USDA, hunger “… refer(s) to a potential consequence of food insecurity that, because of prolonged, involuntary lack of food, results in discomfort, illness, weakness, or pain that goes beyond the usual uneasy sensation.” Nationally, food insecurity has been a problem as long as it has been measured and the rate has changed very little; the number of food insecure families was 12% in 1995 and was still 11.1% in 2018. Let’s look more closely at Oregon, where food insecurity has been one of the toughest challenges to overcome. According to the Oregon Public Health Division, Oregon ranks 13th in the nation for food insecurity among children, and 21st for adults. While efforts have been made to combat hunger in Oregon, it is still a big problem for the state. According to United States Department of Agriculture (USDA) data, more than one in seven of Oregon households were food insecure between 2014 and 2016.[15] Renters in Oregon had food insecurity rates as high as one in four between 2015-2017.[16]
The Oregon Center for Public Policy says that over 527,000 people in Oregon suffer from food insecurity.
[17] To put that into perspective, the population of Portland, our largest city, is around 647,800 people. Overall, minorities and single mothers are disproportionately impacted by food insecurity; food insecurity is strongly linked to socioeconomic status.
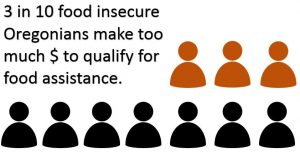
While there are programs to help families who are food insecure, there are still families who are food insecure who do not qualify for any food assistance.
Food Insecurity at Linn-Benton Community College
In a recent survey conducted by the HOPE Center at Temple University, LBCC was one of 400 community colleges queried about food and housing insecurity over the past five years. Linn-Benton Community College students participated in 2019, the fifth year of the study. The survey was sent to 5,700 students and 558 students responded.
A surprising 48% of students reported experiencing food insecurity within the last 30 days, slightly higher than the nation-wide average of community college students.
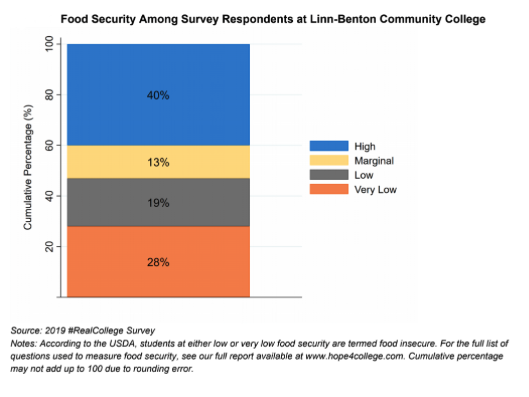
66% of the students that participated in the survey reported experiencing either food insecurity, housing insecurity, or houselessness within the past year.[18]
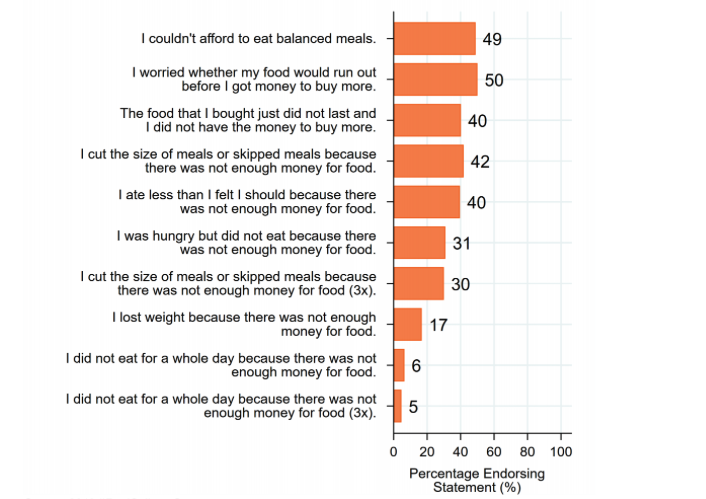
Here is how LBCC students responded when asked whether they had experienced any of the following items in the last 30 days.
Food stamps: SNAP
Many people in the United States rely on the Supplemental Nutrition Assistance Program (SNAP) to provide food for their families. SNAP is a federal program that in some states is supplemented with local funds whose goal is to supplement nutrition and the food budget of families who are moving toward self-sufficiency. According to the 2018 American Community Survey, 12.4% of people in the United States use food stamps and the majority of those families have at least one person working, with ⅓ of recipients having two family members working.[19] Oregon has one of the highest usage rates in the country at a rate of fourteen percent. Here you can see a map of SNAP usage across the country.
In 2019, President Trump proposed dramatic cuts and restrictions to the food stamp program. The rule was finalized by the administration in 2020, but a federal judge blocked its implementation in March, 2020, due to the coronavirus epidemic. Between May and July, 2020, the USDA appealed this judgement. While the SNAP program is currently unchanged, if the proposed work restrictions go into effect, it is estimated that about 700,000 people will lose benefits.[20]
Even without these changes, people on SNAP are having trouble meeting ends meet. Many people find themselves stuck in a seemingly endless cycle of poverty, despite striving for self-sufficiency. Listen here to a three minute summary of an interview with a woman in 2000 when she used food stamps and then re-interviewed in 2012.
Fraud is often mentioned as a concern when it comes to food stamps, but when recipient and vendor fraud is totaled it is estimated at less than one percent of all funds disbursed. That means that more than 99% of the funds are used correctly.[21] The USDA maintains a webpage that reports on their efforts to stop fraud and to recoup delinquent funds. These authors advocate for the focus to shift toward solving the social problems of poverty and hunger, rather than letting the small amount of fraud distract the country from these efforts.
People struggling to feed themselves and their families face other challenges as well. Accepting governmental assistance and charity is stigmatized. Some families feel too embarrassed to seek or accept needed resources. Constant stress related to food insecurity and choosing which bills to pay contributes to mental health challenges. Do you or someone you know have experience with using SNAP? Click here to read Voices From ‘Hunger In Oregon’ for short descriptions from Oregonians who have used this program.
What are families eating and why?
Hearing the phrase “you are what you eat” might conjure a distinct image in a person’s mind. This phrase is often associated with encouraging a healthy diet to promote an individual’s overall well-being. Yet, food is not only a form of sustenance, but it is also used to communicate culture as well as a way of forming social ties and communicating love.
It is important to recognize the multi-dimensional influence food has on family life, and therefore how it can impact families in various ways. In this chapter, we have focused on the ways that institutional forces and family social class shape access to food. Let’s spend a little time here on other factors that affect food choices; this text will explore more aspects of food and family in the Routines, Traditions, and Culture chapter.
Early food experiences
The way our family approaches food when we are children affects us the rest of our lives. What we eat matters, as do the social aspects of meals. Some families eat meals together; others eat their meals individually in front of devices. People who were not exposed to a variety of foods as children, or who were forced to swallow every last bite of overcooked vegetables, may make limited food choices as adults. Children who do not have practice socializing during meals may not develop social skills or understand dining table social norms.
Habits
It can be easy to establish a habit around things we do each day. For example, having a dessert can become a habit. Having a snack after school or a drink with dinner can develop into a habit. Healthy habits such as “an apple a day” can be developed as well and may require intention on the part of the individual.
Culture
The culture in which one grows up affects how one sees food in daily life and on special occasions. Food and family recipes are important ways to transmit culture across families and from generation to generation. Traditions and celebrations often include food.
Geography
Where a person lives influences food choices. For instance, people who live in Midwestern US states have less access to fresh seafood than those living along the coasts.
Advertising
The media greatly influences food choice by persuading consumers to eat certain foods. Have you ever found yourself suddenly hungry after watching an advertisement for the local pizza place? The media affects both when we eat and what we eat.
Social factors
Any school lunchroom observer can testify to the impact of peer pressure on eating habits, and this influence lasts through adulthood. People make food choices based on how they see others and want others to see them. For example, individuals who are surrounded by others who consume fast food are more likely to do the same.
Health concerns
Some people have significant food allergies, to peanuts for example, and need to avoid those foods. Others may have developed health issues which require them to follow a low salt or gluten-free diet. In addition, people who have never worried about their weight have a very different approach to eating than those who have long struggled with excess weight.
Emotions
There is a wide range in how emotional issues affect eating habits. When faced with a great deal of stress, some people tend to overeat, while others find it hard to eat at all.
Green food/Sustainability choices
Based on a growing understanding of diet as a public and personal issue, more and more people are starting to make food choices based on their environmental impact. Realizing that their food choices help shape the world, many individuals are opting for a vegetarian diet, or, if they do eat animal products, striving to find the most “cruelty-free” or sustainable options possible. Purchasing local and organic food products and items grown through sustainable means also helps shrink the size of one’s dietary footprint.
Religion and Belief Systems
People design their diets for various reasons, including religious doctrines, health concerns, and ecological and animal welfare concerns. For example, Jewish people may observe kosher eating practices and Muslim people fast during the ninth month of the Islamic calendar.[22]
Knowledge
Knowledge about healthful foods and calorie amounts affect food choices. This can be gained through family, peer, or media influence. Cooking knowledge is impactful. For example, knowing how to hydrate dried beans or prepare fresh vegetables could increase consumption of healthier foods. There has been a dramatic increase in television cooking shows in the 21st century, as well as nutrition, recipe, and cooking websites, blogs, and videos. The amount of information can make it hard to choose, but there are many options to learn about nutrition and cooking.
Time
One thing that contemporary families in the United States have less now than they did fifty years ago is time. This is primarily due to the decreasing number of jobs with enough pay and benefits to support a family and the need for more adults in the house to be working. With less time, efficiencies such as fast food, processed food, and prepared food become more appealing. Having more time means that families have the flexibility to cook and prepare their own food if they choose.
Children
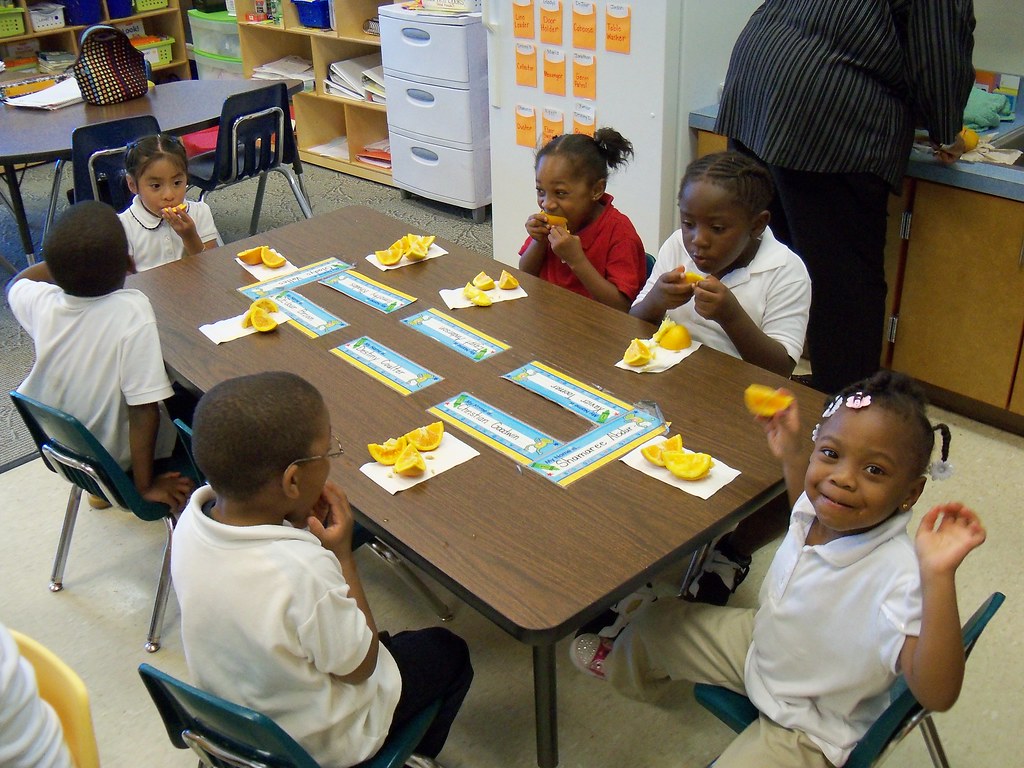
Several other chapters in this text (Nurturance; and Routines, Traditions, and Culture) will focus more closely on children. But they deserve a special mention when it comes to food, and especially to hunger. Children are heavily impacted by poverty and hunger in the United States. In 2017, 17.5% of all children in the United States lived in poverty; Latino and Black children were more often in poverty than were White children. This contributes to diet deficiency. A high quality diet is a major contributing factor to children’s health and well-being and to their health outcomes as adults. Poor eating patterns in childhood are associated with obesity during childhood and adolescence; obese children are more likely to become obese adults. Obesity in children has been increasing dramatically since 1980 and is likely related to diet, physical activity, family environment and other factors. Obesity leads to increased risks for a wide variety of chronic diseases, including diabetes, stroke, heart disease, arthritis, and some cancers.[23]
Hunger and a poor diet can have other effects on children. Hungry children cannot learn as efficiently as well-nourished children. According to the American Psychological Association (APA), they are more likely to develop anxiety and depression along with other health problems. Brain development, learning, and information processing can all be affected by lack of an adequate diet. Children experience stigma around being food insecure and accessing free and reduced meals, part of the federal response to poverty. For more information on this program, access the USDA website here. Children may feel isolated and ashamed about being poor or about being food insecure, although many children share this experience in the United States.[24]
Licenses and Attributions
Open Content, Shared Previously
“The Poverty Line and Food Costs” is adapted from Social Problems: Continuity and Change by Anonymous. License: CC BY-NC-SA 4.0.
“What are Families Eating and Why” is adapted from Human Nutrition by Marie Kainoa Fialkowski Revilla, Alan Titchenal, Allison Calabrese, Cheryl Gibby, & William Meinke. License: CC BY 4.0.
Figure 9.1. Photo by Keith Weller/USDA. Public domain.
Figure 9.2. “kitchen remodel: 1927 Mission Revival bungalow” by jlt. License: CC BY-NC-SA 2.0.
Figure 9.3. “Food Desert Challenge: Day 1” by Mark Bonica. License: CC BY 2.0.
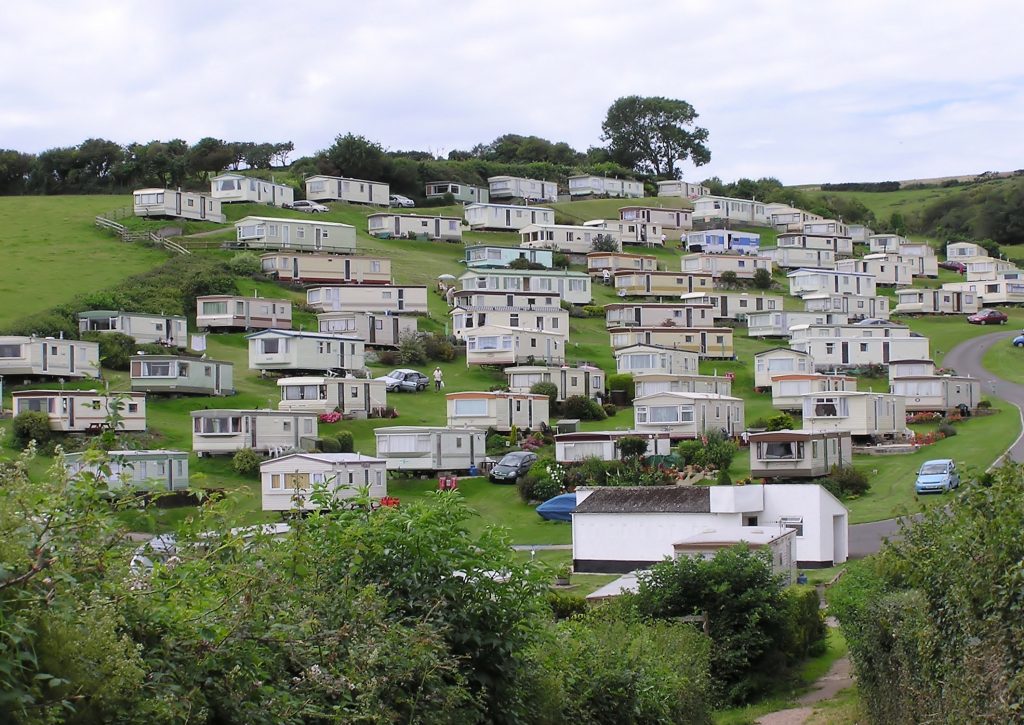
Figure 9.4. “A static caravan park on the cliffs above Beer, Devon, England.” by Adrian Pingstone. Public domain.
Figure 9.9. “NCES receives fresh fruits & veggies grant” by North Charleston. License: CC BY-SA 2.0.
Open Content, Original
Figure 9.5. “Poverty rate by race/ethnicity, Oregon, 2018.” Based on data from the American Community Survey/Kaiser Family Foundation. License: CC BY 4.0.
Figure 9.6. “Share of food insecure Oregonians with too much income to qualify for SNAP assistance, 2016.” Based on data from the Oregon Center for Public Policy. License: CC BY 4.0.
All Rights Reserved Content
“How Black Americans Were Robbed of Their Land” (c) The Atlantic. License Terms: Standard YouTube license.
Figure 9.7. “Food security among survey respondents at Linn-Benton Community College” in #2019 RealCollege Survey: Linn-Benton Community College by The Hope Center. Used with permission.
Figure 9.8. “Food insecurity among survey respondents at Linn-Benton Community College” in #2019 RealCollege Survey: Linn-Benton Community College by The Hope Center. Used with permission.
- Rule of threes (survival). (2020, February 2). Retrieved February 10, 2020, from https://en.wikipedia.org/wiki/Rule_of_threes_(survival) ↵
- Maslow's hierarchy of needs. (2020, February 6). Retrieved February 10, 2020, from https://en.wikipedia.org/wiki/Maslow's_hierarchy_of_needs ↵
- U.S. Census Bureau. Farm labor. Economic Research Service. https://www.ers.usda.gov/topics/farm-economy/farm-labor/ ↵
- Amadeo, K. (2020, June 29). Farm subsidies with pros, cons, and impact. The Balance. https://www.thebalance.com/farm-subsidies-4173885 ↵
- Charles, D. (2019, December 31). Farmers got billions from taxpayers in 2019, and hardly anyone objected. NPR. https://www.npr.org/sections/thesalt/2019/12/31/790261705/farmers-got-billions-from-taxpayers-in-2019-and-hardly-anyone-objected ↵
- Hemmelgarn, M. (2013, January 3). Andy Fisher interview [Audio podcast episode]. In Food Sleuth Radio. https://exchange.prx.org/pieces/90347-food-sleuth-radio-andy-fisher-interview ↵
- U.S. Census Bureau (2013, February). Poverty Rates for Selected Detailed Race & Hispanic Groups by State and Place: 2007-2011. https://www.census.gov/library/publications/2013/acs/acsbr11-17.html ↵
- Pew Research Center. (2020, March 2). Most Americans point to circumstances, not work ethic, to explain why people are rich or poor. https://www.pewresearch.org/politics/2020/03/02/most-americans-point-to-circumstances-not-work-ethic-as-reasons-people-are-rich-or-poor/ ↵
- Shelby, V. (2019, February 25). Corvallis food deserts make finding nutritious, affordable meals difficult. Daily Barometer. http://www.orangemedianetwork.com/daily_barometer/corvallis-food-deserts-make-finding-nutritious-affordable-meals-difficult/article_e28ad688-38b0-11e9-a269-8b7ab733184f.html ↵
- Fremstad, S. (2019, September 16). The official U.S. poverty rate is based on a hopelessly out-of-date metric. Washington Post. https://www.washingtonpost.com/outlook/2019/09/16/official-us-poverty-rate-is-based-hopelessly-out-of-date-metric/ ↵
- DeParle, J., Gebeloff, R., & Tavernise, S. (2011, November 4). Bleak portrait of poverty is off the mark, experts say. New York Times, p. A1. ↵
- Wright, V. R., Chau, M., & Aratani, Y. (2011). Who are America’s poor children? The official story. New York, NY: National Center for Children in Poverty. ↵
- Anonymous. (2016). Social problems: Continuity and change. University of Minnesota Libraries Publishing. https://open.umn.edu/opentextbooks/textbooks/social-problems-continuity-and-change ↵
- Economic Research Service. Department of Agriculture. (2019, September 4). Definitions of food security. Retrieved March 7, 2020, from https://www.ers.usda.gov/topics/food-nutrition-assistance/food-security-in-the-us/definitions-of-food-security/ ↵
- Bauer, J. (2018, May 17). Oregon Lags in Fighting Food Insecurity. Oregon Center for Public Policy. https://www.ocpp.org/2018/05/17/oregon-food-insecurity-lag/ ↵
- Edwards, M. (2018, December). Widespread declines, yet persistent inequalities: Food insecurity in Oregon and the U.S. Oregon State University School of Public Policy. https://liberalarts.oregonstate.edu/sites/liberalarts.oregonstate.edu/files/sociology/oregonhungerreportdec2018.pdf ↵
- Bauer, J. (2018, May 17). Oregon Lags in Fighting Food Insecurity. Oregon Center for Public Policy. https://www.ocpp.org/2018/05/17/oregon-food-insecurity-lag/ ↵
- Baker-Smith, C., Coca, V., Goldrick-Rab, S., Looker, Richardson, B., & Williams, T. (2020, February). Hope Center. https://hope4college.com/wp-content/uploads/2020/02/2019_RealCollege_Survey_Report.pdf ↵
- US Census Bureau. (2020, July 21). Most families that received SNAP Benefits in 2018 had at least one person working. https://www.census.gov/library/stories/2020/07/most-families-that-received-snap-benefits-in-2018-had-at-least-one-person-working.html ↵
- Vesoulis, A. (2020, May 13). The White House Pushes to Curb Food Stamps Amid Record Unemployment Retrieved August 19, 2020, from https://time.com/5836504/usda-snap-appeal-rule-change/ ↵
- Constable, S. (2018, April 4). The facts about food stamp fraud. Forbes. https://www.forbes.com/sites/simonconstable/2018/04/04/the-facts-about-food-stamp-fraud/ ↵
- Constable, S. (2018, April 4). The facts about food stamp fraud. Forbes. https://www.forbes.com/sites/simonconstable/2018/04/04/the-facts-about-food-stamp-fraud/ ↵
- Federal Interagency Forum on Child and Family Statistics. (2019). America's Children: Key National Indicators of Well-Being, 2019. https://www.childstats.gov/americaschildren/ ↵
- American Psychological Association. (n.d.). What are the psychological effects of hunger on children? Retrieved August 19, 2020, from https://www.apa.org/advocacy/socioeconomic-status/hunger.pdf ↵
A large issue that affects many people, can threaten the health and well being of society, is recognized as a problem by many, includes multiple causes and effects, and needs a systemic solution.
Emphasizes the needs and success of the individual over the needs of the whole community.
Ensuring that people have what they need in order to have a healthy, successful life equal to others. Different from equality in that some may receive more help than others in order to be at the same level of success.
The combination of one’s social and economic status, specifically related to income, education, and career or job status.
Describes a lack of access to stable housing, which may include individuals who must move frequently, cannot afford rent, live with relatives, are overcrowded, or who do not have adequate housing quality.
Being in the state of not having access to stable housing. Couch surfing, tent cities, shelters, and living in a car are all examples of houselessness.
A socially transmitted worldview created, learned and shared by a group which includes values, beliefs, customs and behaviors and which is reflected in language, objects, food, and social institutions.
