1.1 Assessing Slope of the Land
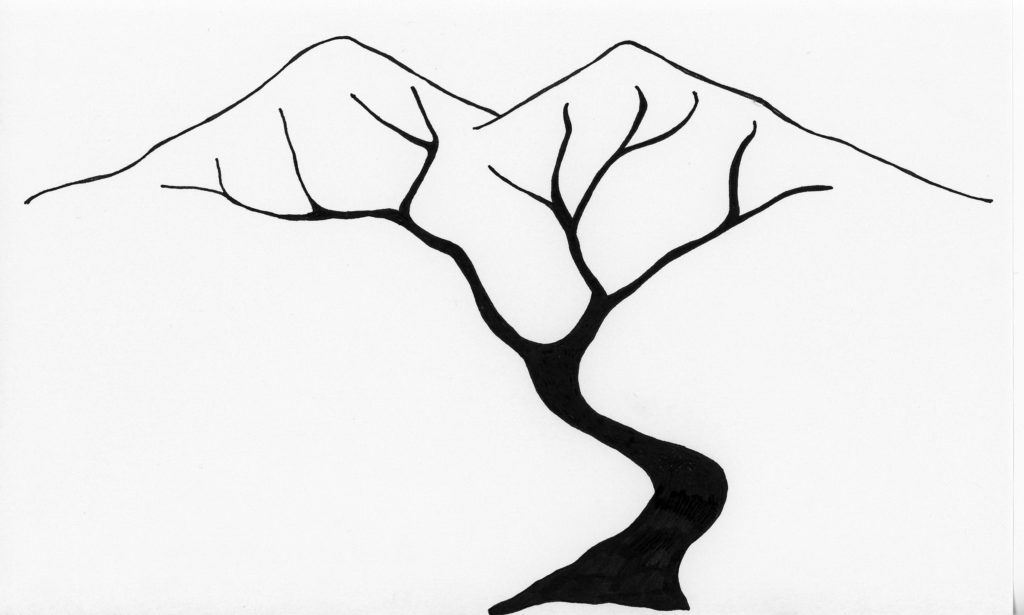
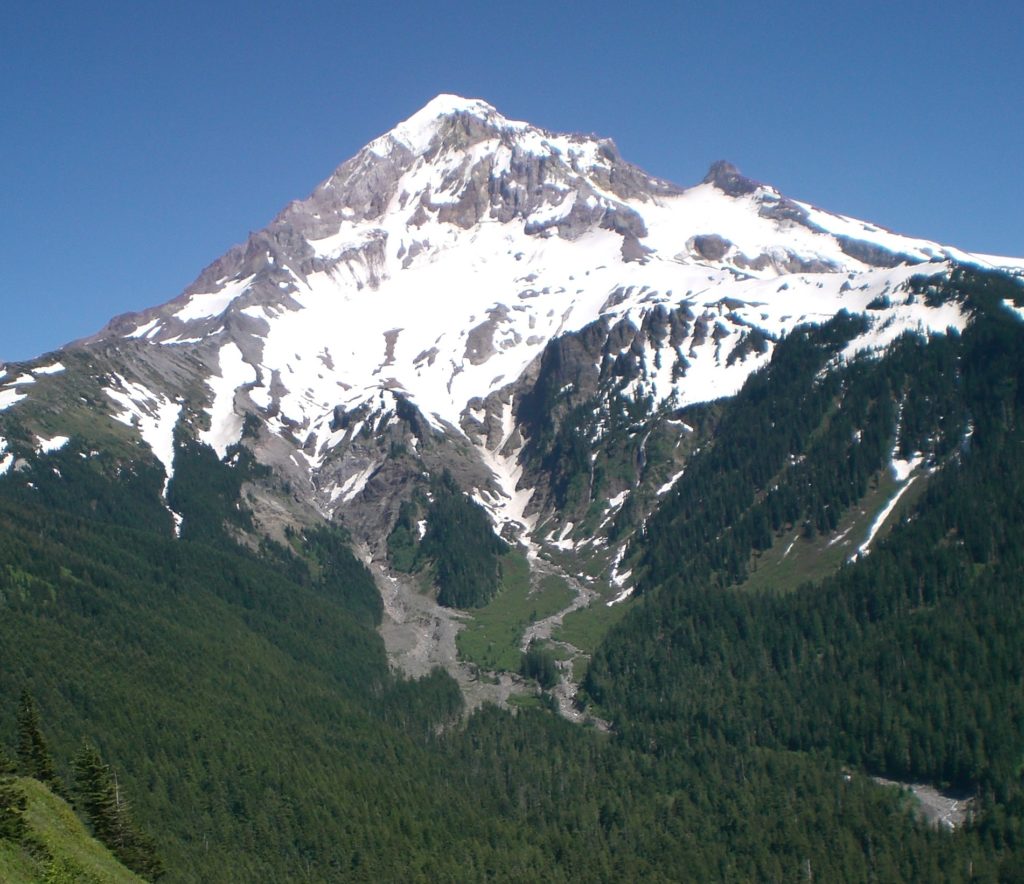
Forested ecosystems occupy a rich array of varied landforms. In the Pacific Northwest, this diversity is readily apparent as one surveys the landscape– volcanic peaks contrast with wide valleys; steep, forested hillsides surround gently rolling savannas; and rapidly cascading mountain streams transition to meandering river floodplains. This varied topography is an integral part of the forest, influencing climate, soils, water, vegetation and aquatic life (Figure 1.1). Natural resource technicians are often called upon to assess the topography, and one of the common elements measured is the slope of the land. How steep is a hillside? Does it drain to a stream? Are there cliffs or bluffs present? Topographical field data collected by technicians are used to inform decisions about land management activities such as providing shade for streams, building roads or trails, and prescribing timber harvesting operations.
Defining Slope
Slope is essentially the gradient or incline of the land. A steep slope refers to a sharp incline; a gentle slope to a slight incline. The steep, forested slopes in Figure 1.1 contrast with the gentler slope of the river’s path as it flows between them.
Driving down a highway you may see a road sign that reads “6% Grade” or “Steep Grade.” The grade of the road is, essentially, its slope. The sign in Figure 1.2 indicates that the road descends at a six percent grade or a six percent slope.
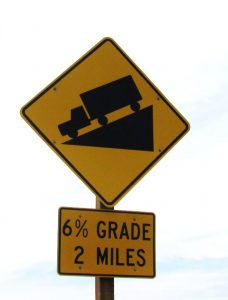
A six percent slope means that the road elevation changes 6 feet for every 100 feet of horizontal distance (Figure 1.3).
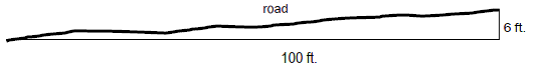
Mathematically, slope is defined as “the rise over the run ” (or the rise divided by the run), in which rise equals change in elevation and run equals horizontal distance:
[latex]\displaystyle slope=\frac{{rise}}{{run}}[/latex] or [latex]\frac{{\text{elevation change}}}{{\text{horizontal distance}}}[/latex] or in this case: [latex]\frac{{\text{6 ft}\text{.}}}{{\text{100 ft}\text{.}}}=.06[/latex]
To express slope as percent slope, simply multiply the slope fraction by 100. So, .06 = 6%.
[latex]\displaystyle \left( {\frac{{rise}}{{run}}} \right)\left( {100} \right)=[/latex]%slope
[latex]\left( {\frac{{6ft}}{{100ft}}} \right)\left( {100} \right)=[/latex]6%
In the road example below, the six-foot change in elevation is the rise, and the 100-foot horizontal distance of the road is the run. Driving uphill means climbing a “positive” six percent slope (Figure A). Driving downhill, the “rise” is actually a drop, so there is a “negative,” or downhill, slope (Figure B). When dealing with slope, a positive slope simply means uphill and a negative slope means downhill. A negative number does not mean “minus” as in algebraic expressions.
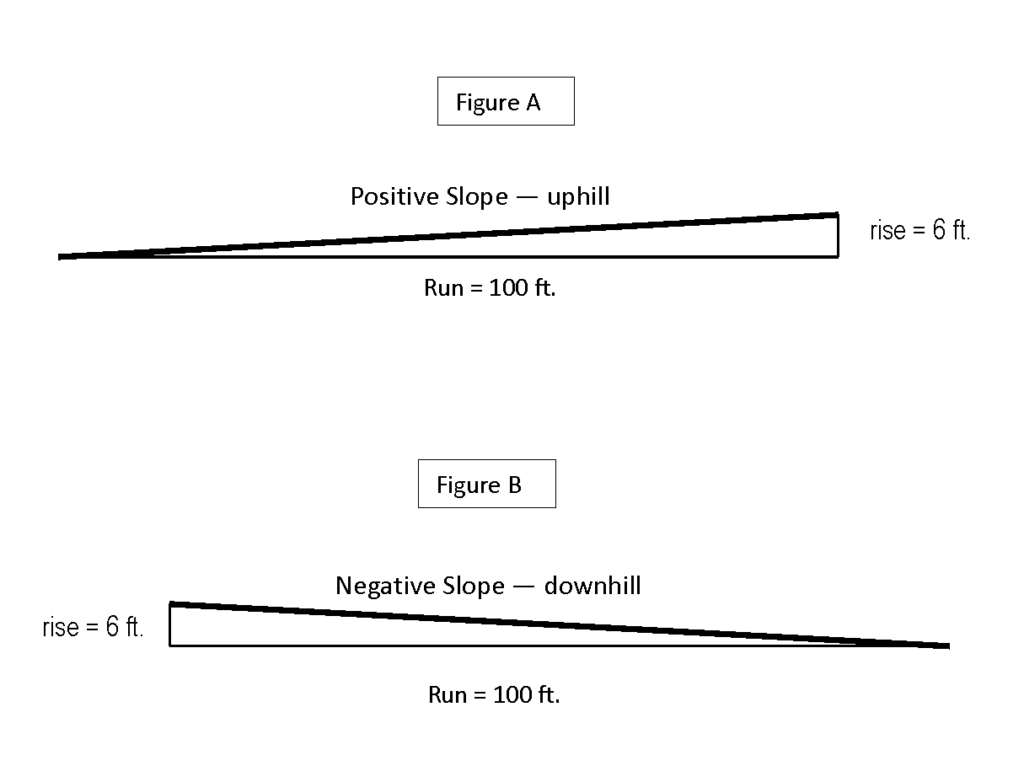
Note that the actual road distance is the hypotenuse of the illustrated slope triangle. This length is called slope distance. Slope distance is always longer than the horizontal distance, or run. Applying the Pythagorean theorem (a2 + b2 = c2) to this triangle, the slope distance, or hypotenuse (c) can be calculated.
a2 + b2 = c2 where: 1002 + 62 = c2 10,036 = c2 [latex]\sqrt{{10,036}}=100.2[/latex]ft.
a = horizontal distance or run (in this example 100 ft.)
b= change in elevation or rise (in this example 6 ft.)
c = road distance or slope distance (in this example 100.2 ft.)
The slope distance is 100.2 ft. for a run of 100 ft. As you can see from this example, in a forest, a six percent slope would be considered a gentle slope.
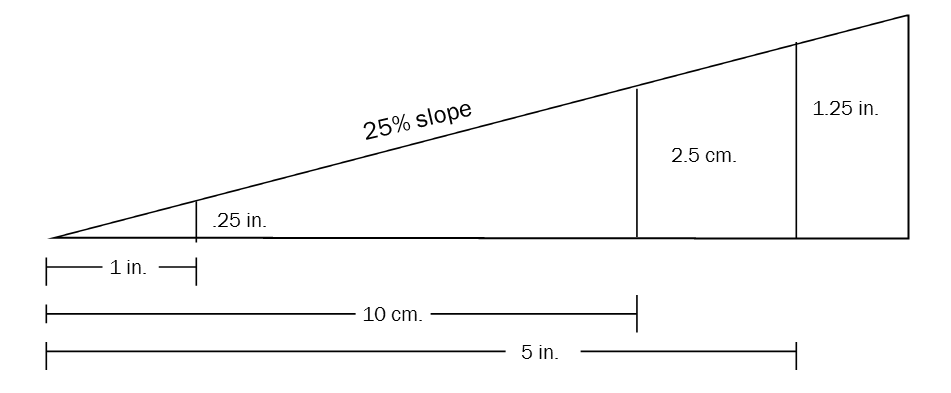
Note that %slope is unitless and proportional. Therefore, it can be applied to any unit of measure (inches, yards, centimeters, etc.) and to any length. For example, a 25 percent slope is simply a ratio of 25:100. The 25 percent slope below shows that the slope rises .25 inches for every inch of horizontal distance. The slope rises 2.5 centimeters or every 10 centimeters of horizontal distance, and it rises 1.25 inches for every 5 inches of horizontal distance.
.
Using Slope
When writing field notes about a site, technicians include information about the slope of the land. Sometimes a rough estimate of the average slope is sufficient; sometimes detailed measurements of slope are required. For example, a site description might read:
“A timber cruise was conducted on 20 acres of mixed conifer forest. Approximately half of the acreage was flat, on slopes ranging from 3-7%. The other half of the acreage was steeper; with southwest slopes 40-60%.”
This description conveys much more about the site than simply stating that there were 20 acres of mixed forest. The flatter ground would likely have different soil conditions and different vegetation than the steeper slopes, and therefore, perhaps, require different management. Let’s say that these 20 acres are to be logged in the near future. If this is so, the forester will have to plan where to place any new access roads, where to locate landings for yarding the logs and what type of harvesting equipment to use. The topography will definitely be considered, as the slope of any new spur roads should not exceed 10%, and a cable system should be used to haul logs up to landings on slopes greater than 30% (Figure 1.4).
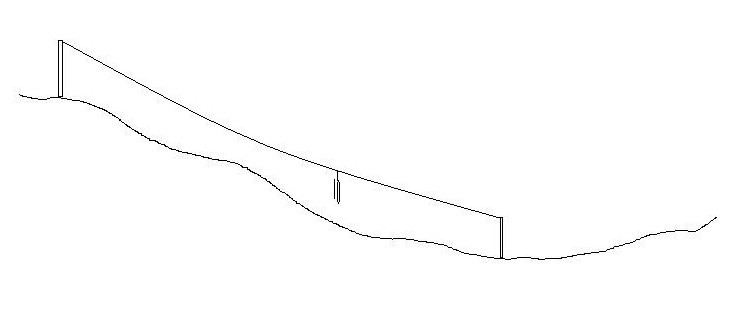
Sometimes, more information than general field notes is required for prescribing management activities. Profiles may be run to get a detailed picture of a slope. To do so, the hillside is divided into segments where major changes in slope occur. For each segment, a %slope reading is taken. These readings are combined with measurements of the slope distance for each segment to create a profile or sketch of the hill like the one illustrated (Figure 1.5). With this precise information, for example, a logging system can be designed that will lift logs off the ground while yarding to reduce erosion.
.
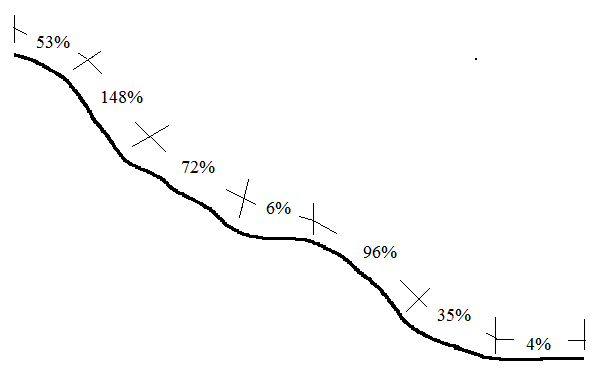
Note that slopes can exceed 100 percent (see +148% in Figure 1.5). When a slope equals 100 percent, it simply means that the rise is equal to the run. And although it certainly feels like you are climbing straight up on a 100 percent slope (pulling yourself up using roots and anything else you can grab), you are really walking up at a 45° angle, not a 90° angle.
[latex]\displaystyle \left( {\frac{{rise}}{{run}}} \right)\left( {100} \right)=[/latex]%slope
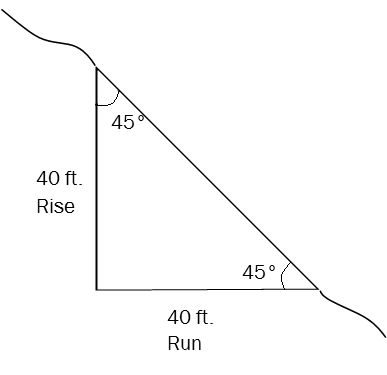
If rise = run as illustrated above: [latex]\displaystyle \left( {\frac{{40}}{{40}}} \right)\left( {100} \right)=[/latex]100%
100% slope = 45º angle slope
Other examples in which %slope is measured in natural resource settings include hiking trails and streams. Switchbacks on steep slopes reduce trail erosion and make for easier hiking. Some trails are kept to 8 percent to comply with American with Disabilities Act (ADA) guidelines for wheelchair access.
Stream gradients vary, reflecting the terrain over which they flow at each stage of their journey to large rivers. Small tributaries often are the steepest, cascading down steep forested slopes at gradients of 60–100 percent slope or more. As streams merge downriver, the terrain often flattens out, and milder gradients of 3–10 percent slope may be measured (Figure 1.6).