
6.7 Summary Questions
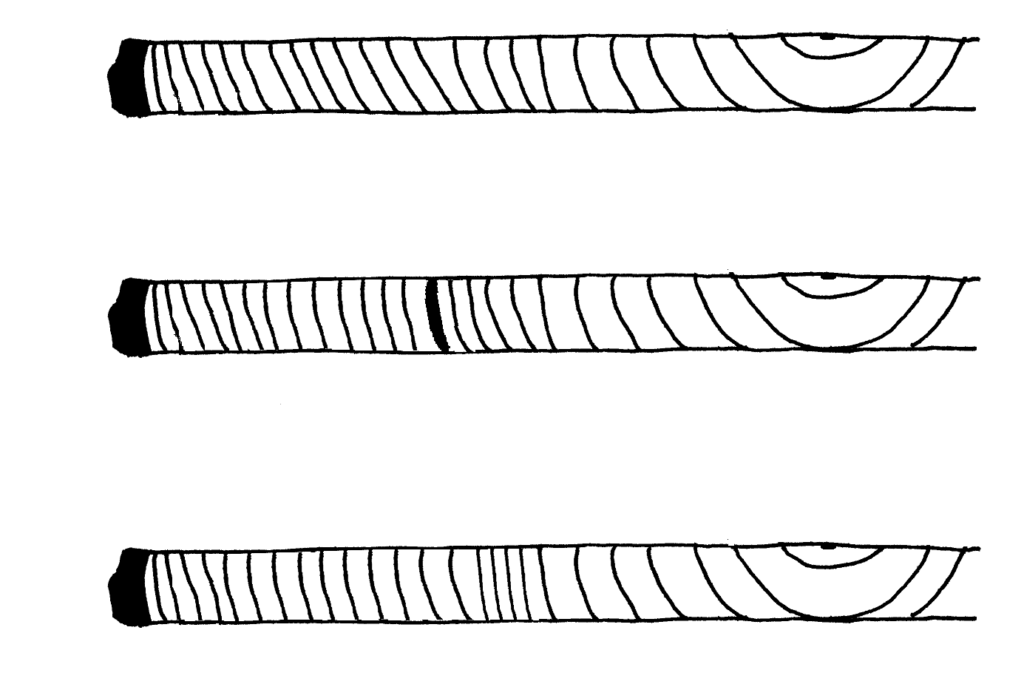
1. Determine if each of the cores shown below represents a suitable site index tree.
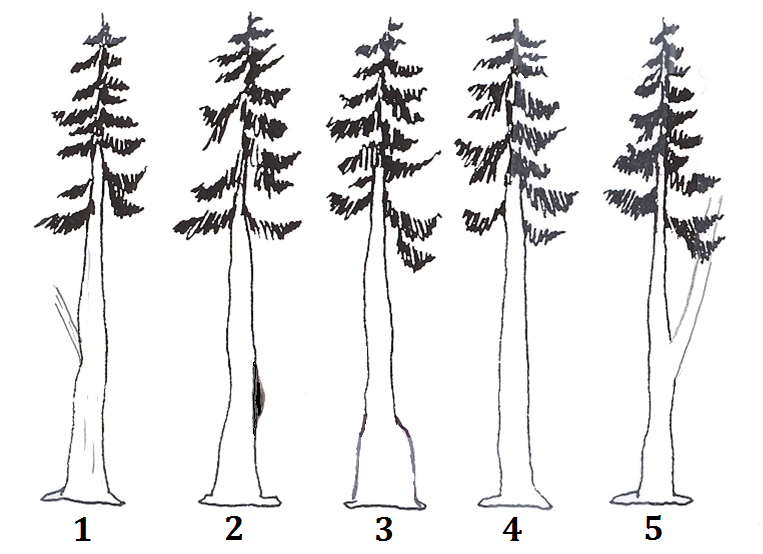
2. For each tree illustrated, decide if it is a suitable site index tree.
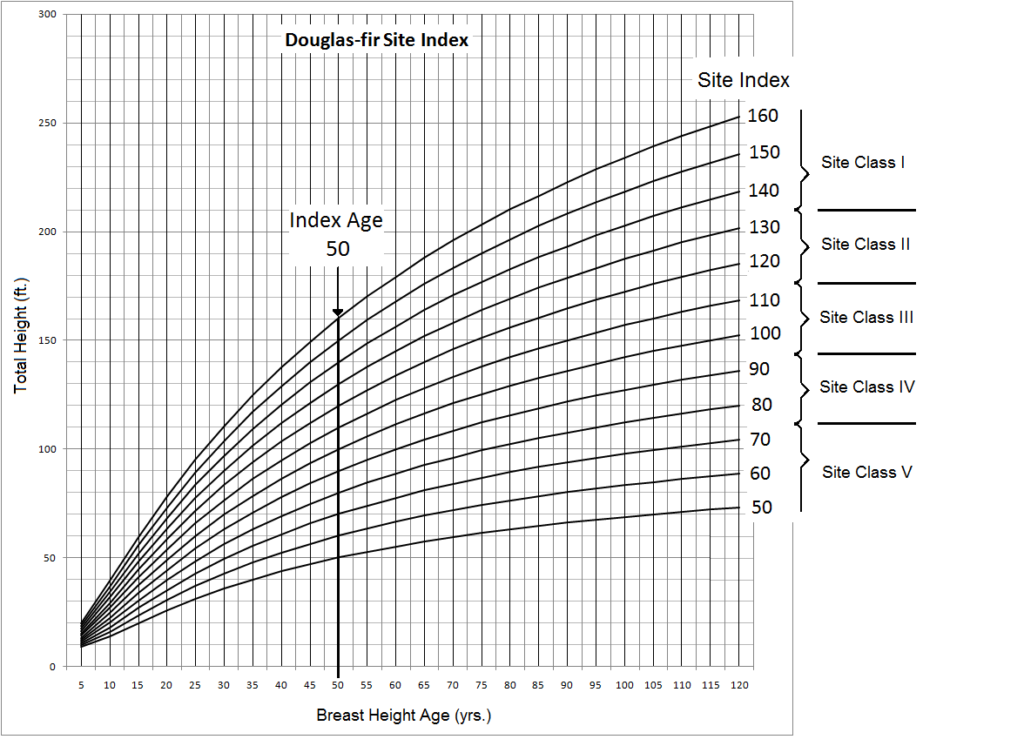
3. Using the site index graph for Douglas-fir, determine the average site index of trees A, B and C.
| Tree | Total Tree Height (ft.) | Breast Height Age (yrs.) | Site Index |
|---|---|---|---|
| A | 60 | 35 | |
| B | 118 | 60 | |
| C | 115 | 65 | |
| Avg. SI |
Answers to Summary Questions
1. Top Core: This core sample appears fine. It shows a gradual transition from large growth rings to smaller growth rings from pith to bark, which is normal.
Middle Core: This core sample has a black spot, which could indicate rot, pitching in response to insect attack or prior fire. I would choose another tree for site index.
Bottom Core: This core sample appears to have several tight rings in the center. This could indicate previous suppression followed by release. I would choose another tree.
2. Moving from left to right, I would answer as follows:
Tree 1: No, it has a large sucker limb, a weak spot in a tree that often has rot associated with it.
Tree 2: No, it has a burl or canker on the stem, which indicates malfunctioning of the wood growth.
Tree 3: No, this has a bell-shaped swelling at the base of the tree, which indicates butt rot.
Tree 4: Looks fine for site index.
Tree 5: No, this tree has a fork, a weak spot in the tree that often results from top breakage.
3. Using the site index graph for Douglas-fir, determine the average site index of trees A, B and C.
| Tree | Total Tree Height (ft.) | Breast Height Age (yrs.) | Site Index |
|---|---|---|---|
| A | 60 | 35 | 76 |
| B | 118 | 60 | 106 |
| C | 115 | 65 | 98 |
| Total SI | 280 | ||
| Avg. SI | ≈93 |
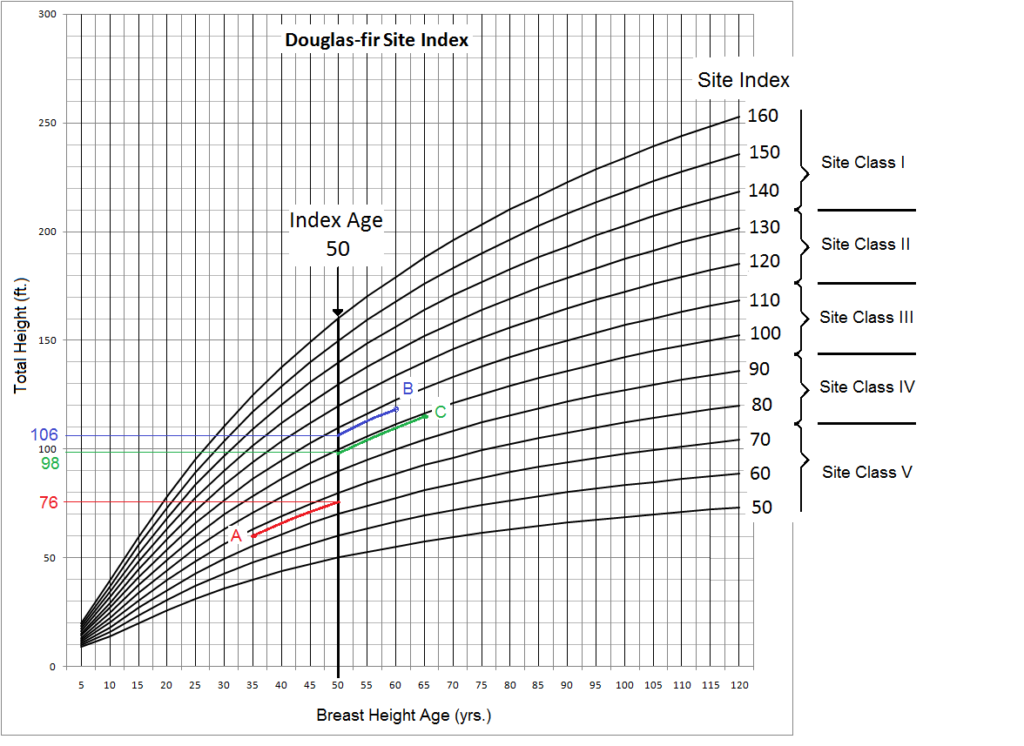
The site index of each tree is determined, using the graph. To obtain the average, sum up the site index values and divide by three.
