
11.3 Groundwater Extraction
Except in areas where groundwater comes naturally to the surface at a spring (a place where the water table intersects the ground surface), we have to construct wells in order to extract it. If the water table is relatively close to the surface, a well can be dug by hand or with an excavator, but in most cases we need to use a drill to go down deep enough. There are many types of drills that can be used; an example is shown in Figure 11.12. A well has to be drilled at least as deep as the water table, but in fact must go much deeper; first, because the water table may change from season to season and from year to year, and second, because when water is being pumped, the water level will drop, at least temporarily.
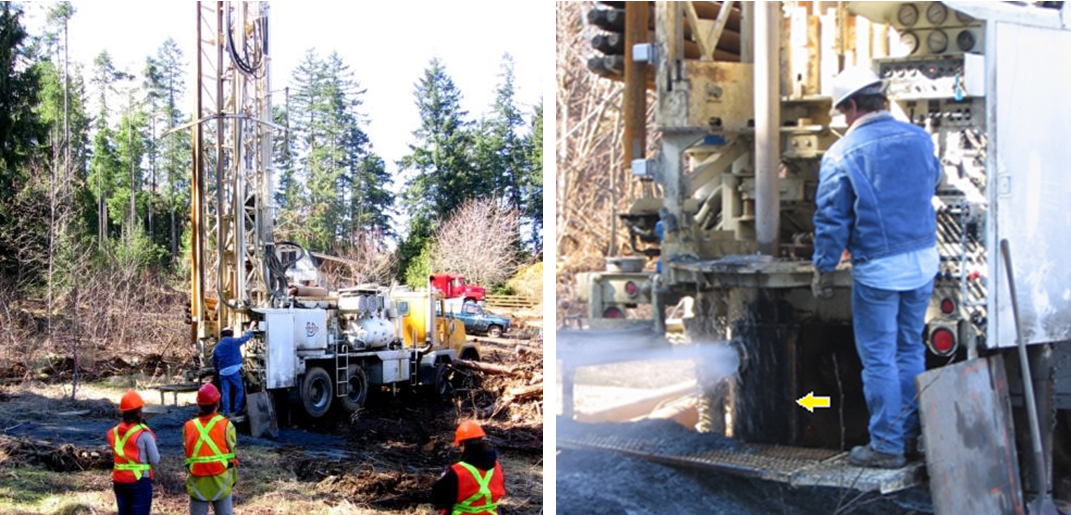
Where a well is drilled in unconsolidated sediments or relatively weak rock, it has to be lined with casing (steel pipe in most cases) in order to ensure that it doesn’t cave in. A specially designed well screen is installed at the bottom of the casing. The size of the holes in the screen is carefully chosen to make sure that it allows the water to move into the well freely, but prevents aquifer particles from entering the well. A submersible pump is typically used to lift water from within the well up to the surface where it is needed. The well shown in Figure 11.12 has casing that is about 40 centimeters in diameter, which might be typical for a municipal water supply well, or a very large well for irrigation. Most domestic wells have 15 centimeter casing.
Pumping water from the well removes water from inside the well at first. That lowers the water level inside the well. This means that water will flow from the surrounding aquifer toward the pumping well where the water level is now lower.
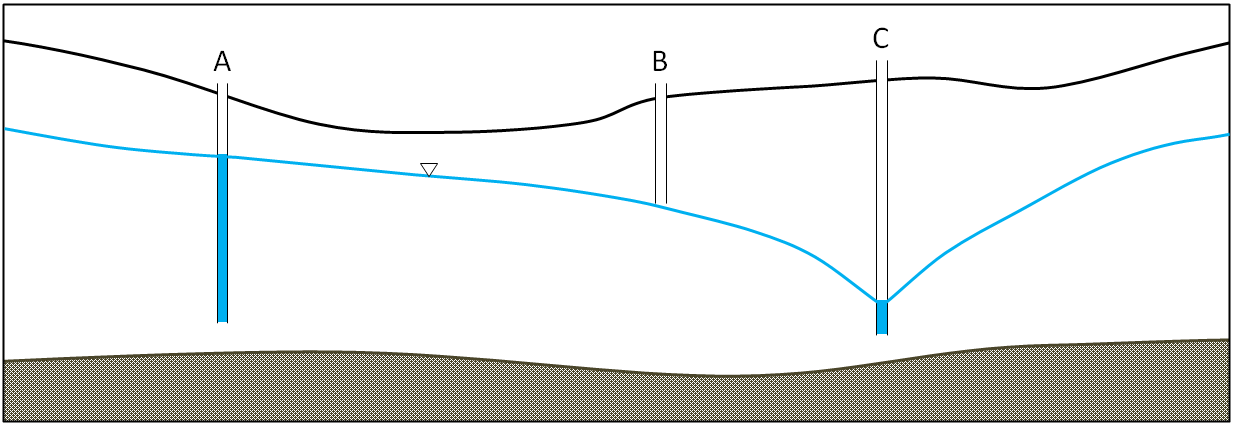
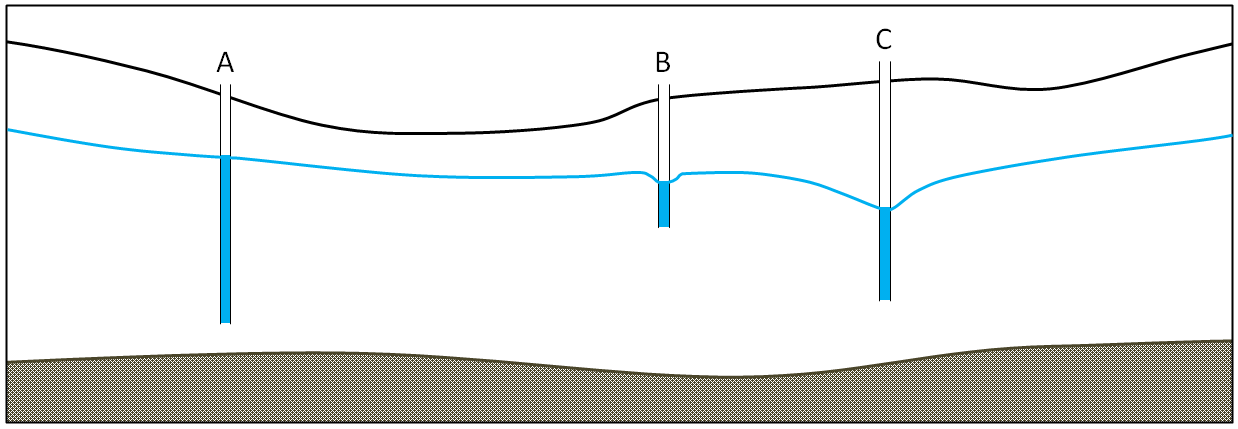
That is how a well gets water from the ground. The water table, or potentiometric surface, will slope in toward the well where the water is being withdrawn. That indicates the energy gradient that is allowing water to flow toward the well. This creates a shape known as a cone of depression surrounding the well, as illustrated in Figure 11.13. If pumping from a well continues for hours to days, the cone of depression may result in a loss of water in nearby wells. As shown in Figure 11.13, pumping of well C has contributed to well B going dry because the water level is now below the bottom of well B. If pumping continues in well C, it too may go dry.
Exercise 11.2 Cone of depression
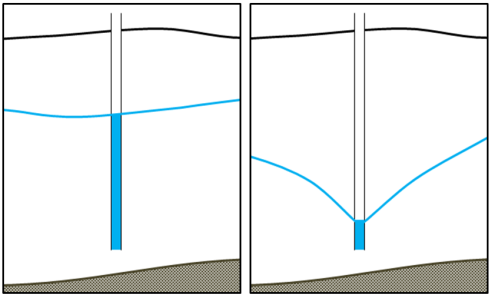
The two diagrams here show the same well before (left) and after (right) long-term pumping. A cone of depression has developed. This provides the energy gradient for water to flow toward the well so that it can be pumped out.
How will this likely affect the rate of flow into the well?
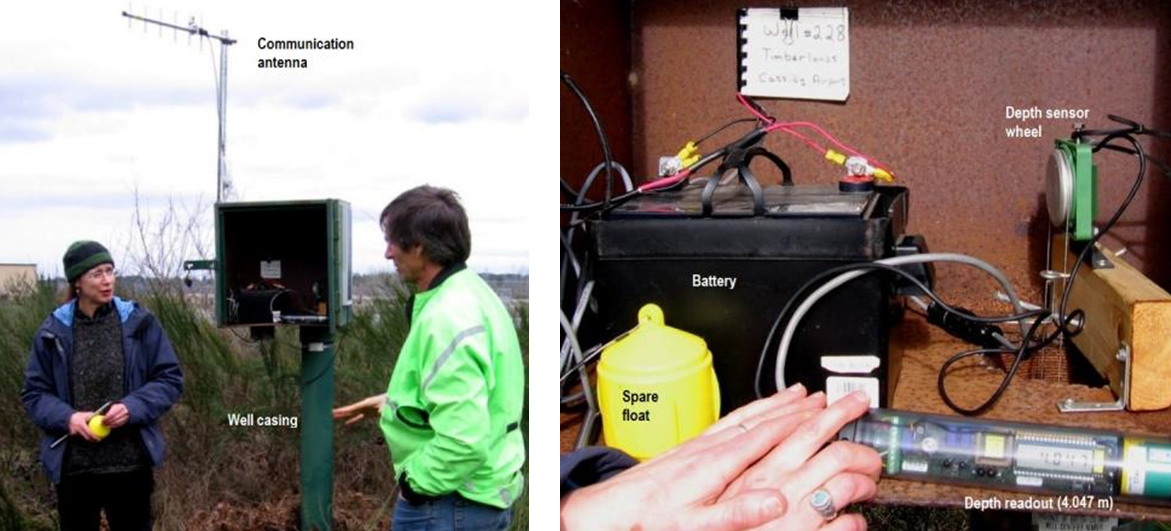
Like other provinces in Canada and states in the US, British Columbia has a network of observation wells administered by the Ministry of the Environment. These are wells that are installed to measure water levels; they are not pumped. There are 145 active observation wells in B.C. (in 2015), most equipped with automatic recorders that monitor water levels continuously. The main purpose of the observation wells is to monitor water table levels so that we can see if there are long-term natural fluctuations in groundwater quantity, and shorter-term fluctuations related to overuse of the resource. Most are also sampled regularly to monitor groundwater chemistry and quality.
An example of an observation well is illustrated in Figure 11.15. This one is situated at Cassidy on Vancouver Island and is used to monitor an unconsolidated aquifer that is widely used by residents with private wells.
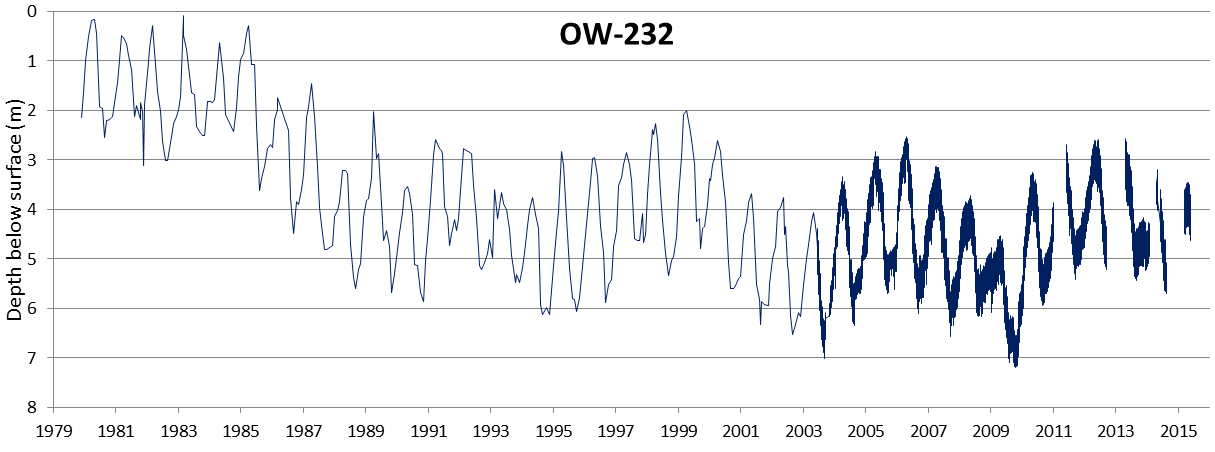
The water-level data from B.C.’s observation wells are available to the public, and an example data set is illustrated in Figure 11.16. The water level in Ministry of Environment observation well 232 (OW-232), situated in Lantzville on Vancouver Island, dropped significantly from 1979 (average depth around 1.5 meters), to 2003 (average depth around 5.5 meters), but has recovered a little since then.
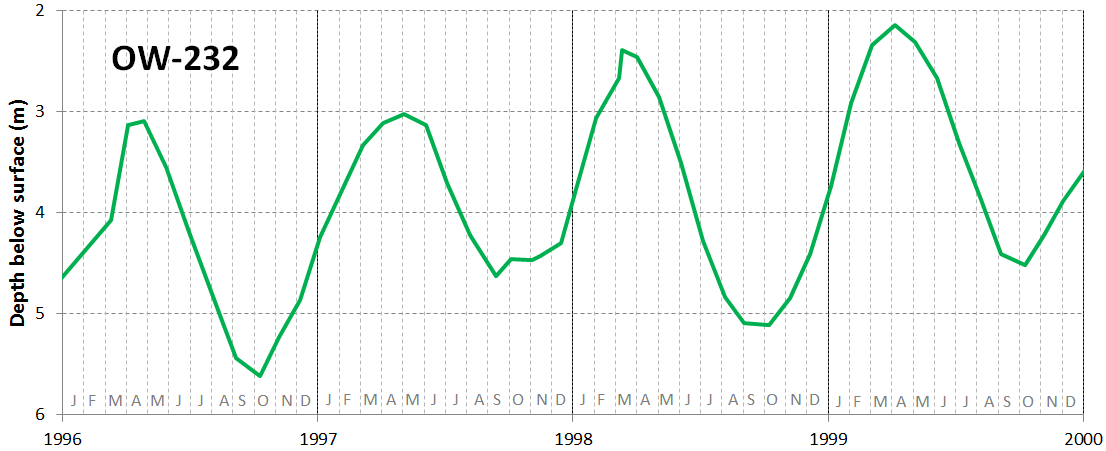
The short-term variations in the level of well 232 are at a period of one year and are related to annual cycles of recharge and discharge governed by the wet winter climate and drier summers. The data for part of the period are shown in more detail in Figure 11.17. In most of British Columbia most wells drop to their lowest levels in September or October after the relatively dry summer period. Levels increase rapidly from October through February as high winter precipitation adds recharge to the aquifer, and water is stored. The water table reaches a peak in March or April. Most wells then drop over the summer as groundwater continues to flow, but no new recharge is added. The water is drained from storage into streams or lakes and eventually into the ocean, and as a result, the water table decreases, reaching its lowest level again in September or October. Similar fluctuations are observed at most observation wells around the province, although the timing is slightly different from region to region.
The long-term fluctuations in levels in observation wells in different places are also quite variable. Long-term changes in climate can lead to gradual natural changes in water levels. These long-term cycles lasting years or decades are mixed with the effects of well pumping. Some observation wells show consistent decreases in water level that may indicate long-term over-extraction. Many others show generally consistent levels over several decades, and some show increases in water level. One of the important jobs performed by hydrogeologists working for government agencies is to examine these long-term records of water levels for indications of how sustainable the groundwater use might be.
Exercise 11.3 What’s your water table doing?
Visit the B.C. Ministry of the Environment observation well website and use the map to find an observation well near you. When you click on a point, a window pops up with a link that says, “Click for details about this well.” Click on that link and then choose one of the options available. The “Graphs” tab will show you a graph of the water levels, and you should be able to tell if the level is generally increasing or decreasing. If there isn’t much data to see, choose a different well.
(Similar data are available for Alberta and Saskatchewan and other jurisdictions as well. Search using terms like “Alberta observation wells.”)
In 2016 the new Water Sustainability Act came into effect in British Columbia, requiring licensing groundwater extraction for the first time. The new Act also includes provisions for determining “environmental flow needs”—the amount of water that must be in surface water streams at different times of the year to meet the needs of the ecosystem that depends on the streamflow. For example, many streams in B.C. support populations of salmon that live in the stream for part of their life cycle or return to their home stream for spawning. Groundwater forms a part of the baseflow in a watershed, and is therefore an important part of the environmental flow needs. Careful work is needed in the coming years to ensure that the amount of water licensed to be extracted from surface water and groundwater for human use does not interfere with the amount of water needed for the natural water-dependent ecosystems to function.
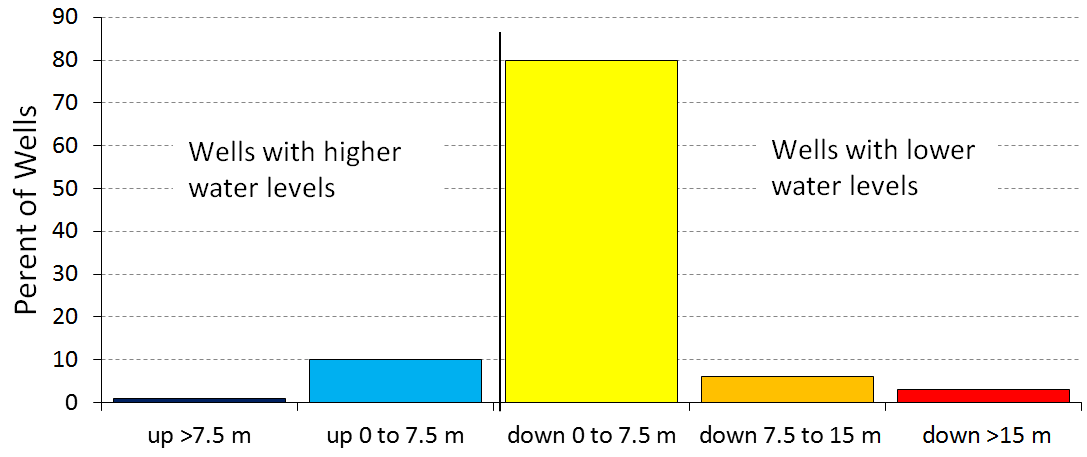
The situation in California, where groundwater extraction over large areas is leading to declining water levels, is quite different from that in B.C. According to the state Department of Water Resources, 80% of groundwater wells showed drops in water level of 0 meters to 7.5 meters between 2011 and 2013, another 6% dropped by 7.5 meters to 15 meters, and 3% dropped by more than 15 meters (Figure 11.18). Over the same time period, only 10% of well levels increased by 0 meters to 7.5 meters, and 1% increased by more than 7.5 meters. The drought that gripped California in 2013 had worsened significantly by 2015, and California farmers — and the people across North America that eat the food they produce — continue to have a prodigious appetite for irrigation water. California, like B.C., is introducing new groundwater regulations to try to control water usage and halt water table declines.
Impermeable Surfaces
Even if groundwater supplies are not being depleted by overuse, or by a changing climate, we are continuing to put stress on aquifers by covering vast areas with impermeable surfaces that don’t allow rain and snow-melt to infiltrate and become groundwater. Instead, water that falls on these surfaces is channeled into drainage systems, then into storm sewers, and then directly into rivers and the ocean. In cities and their suburbs, the biggest culprits are parking lots, roads, and highways. While it would great if we didn’t dedicate such huge areas to cars, that’s not about to change quickly, so we need to think about ways that we can improve surface water infiltration in cities. One way is to use road and parking surfaces that will allow water to seep through, although this is not practical in many cases. Another way is to ensure that runoff from pavement is channeled into existing or constructed wetlands that serve to decontaminate the water, and then allow it to infiltrate into the ground.
Media Attributions
- Figure 11.13, 11.12, 11.13, 11.14, 11.15: © Steven Earle. CC BY.
- Figure 11.16: © Steven Earle. CC BY. Based on data from “Observation Well #232.
- Figure 11.17: © Steven Earle. CC BY. Based on data from “Observation Well #232.”
- Figure 11.18:© Steven Earle. CC BY. Based on State of California Department of Water Resources data.
Licenses and Attributions
“Physical Geology – 2nd Edition” by Steven Earle is licensed under CC BY 4.0 Adaptation: Renumbering, Remixing
the flow of groundwater onto the surface
the depression of the water table around a well that is heavily pumped
