
15.2 Weather Processes
Weather Processes
Humidity
Humidity is the amount of water vapor in the air in a particular spot. We usually use the term to mean relative humidity, the percentage of water vapor a certain volume of air is holding relative to the maximum amount it can contain. If the humidity today is 80%, it means that the air contains 80% of the total amount of water it can hold at that temperature. What will happen if the humidity increases to more than 100%? The excess water condenses and forms precipitation.
Since warm air can hold more water vapor than cool air, raising or lowering temperature can change air’s relative humidity. The temperature at which air becomes saturated with water is called the air’s dew point. This term makes sense, because water condenses from the air as dew, if the air cools down overnight and reaches 100% humidity.
Clouds

Figure 15.6 Clouds by josquin2000 is licensed under CC BY-NC-SA 2.0
Clouds have a big influence on weather by preventing solar radiation from reaching the ground; absorbing warmth that is re-emitted from the ground; and as the source of precipitation.When there are no clouds, there is less insulation. As a result, cloudless days can be extremely hot, and cloudless nights can be very cold. For this reason, cloudy days tend to have a lower range of temperatures than clear days.
There are a variety of conditions needed for clouds to form. First, clouds form when air reaches its dew point. This can happen in two ways: (1) Air temperature stays the same but humidity increases. This is common in locations that are warm and humid. (2) Humidity can remain the same, but temperature decreases. When the air cools enough to reach 100% humidity, water droplets form. Air cools when it comes into contact with a cold surface or when it rises.
Rising air creates clouds when it has been warmed at or near the ground level and then is pushed up over a mountain or mountain range or is thrust over a mass of cold, dense air. Water vapor is not visible unless it condenses to become a cloud. Water vapor condenses around a nucleus, such as dust, smoke, or a salt crystal. This forms a tiny liquid droplet. Billions of these water droplets together make a cloud.
Clouds are classified in several ways. The most common classification used today divides clouds into four separate cloud groups, which are determined by their altitude and if precipitation is occurring or not.
High-level clouds form from ice crystals where the air is extremely cold and can hold little water vapor. Cirrus, cirrostratus, and cirrocumulus are all names of high clouds. Cirrocumulus clouds are small, white puffs that ripple across the sky, often in rows. Cirrus clouds may indicate that a storm is coming.
Middle-level clouds, including altocumulus and altostratus clouds, may be made of water droplets, ice crystals or both, depending on the air temperatures. Thick and broad altostratus clouds are gray or blue-gray. They often cover the entire sky and usually mean a large storm, bearing a lot of precipitation, is coming.
Low-level clouds are nearly all water droplets. Stratus, stratocumulus and nimbostratus clouds are common low clouds. Nimbostratus clouds are thick and dark that produce precipitation. Clouds with the prefix ‘cumulo-‘ grow vertically instead of horizontally and have their bases at low altitude and their tops at high or middle altitude. Clouds grow vertically when strong unstable air currents are rising upward. Common clouds include cumulus humilis, cumulus mediocris, cumulus congestus, and cumulonimbus.To learn more about the various types of cloud formations from the National Oceanic and Atmospheric Administration (NOAA), click here.
Fog
Fog is a cloud located at or near the ground . When humid air near the ground cools below its dew point, fog is formed. The several types of fog that each form in a different way. Radiation fog forms at night when skies are clear and the relative humidity is high. As the ground cools, the bottom layer of air cools below its dew point. Tule fog is an extreme form of radiation fog found in some regions. San Francisco, California, is famous for its summertime advection fog. Warm, moist Pacific Ocean air blows over the cold California current and cools below its dew point. Sea breezes bring the fog onshore. Steam fog appears in autumn when cool air moves over a warm lake. Water evaporates from the lake surface and condenses as it cools, appearing like steam. Warm humid air travels up a hillside and cools below its dew point to create upslope fog.
Precipitation
Air Masses
Air Mass Formation

Where an air mass receives it’s characteristics of temperature and humidity is called the source region. Air masses are slowly pushed along by high-level winds, when an air mass moves over a new region, it shares its temperature and humidity with that region. So the temperature and humidity of a particular location depends partly on the characteristics of the air mass that sits over it. Storms arise if the air mass and the region it moves over have different characteristics. For example, when a colder air mass moves over warmer ground, the bottom layer of air is heated. That air rises, forming clouds, rain, and sometimes thunderstorms. How would a moving air mass form an inversion? When a warmer air mass travels over colder ground, the bottom layer of air cools and, because of its high density, is trapped near the ground.
In general, cold air masses tend to flow toward the equator and warm air masses tend to flow toward the poles. This brings heat to cold areas and cools down areas that are warm. It is one of the many processes that act towards balancing out the planet’s temperatures. Air masses are slowly pushed along by high-level winds. When an air mass moves over a new region, it shares its temperature and humidity with that region. So the temperature and humidity of a particular location depends partly on the characteristics of the air mass that sits over it. Air masses are classified based on their temperature and humidity characteristics. Below are examples of how air masses are classified over North America.
- Maritime tropical (mT) – moist, warm air mass
- Continental tropical (cT) – dry, warm air mass
- Maritime polar (mP) – moist, cold air mass
- Continental polar (cP) – dry, cold air mass
Storms arise if the air mass and the region it moves over have different characteristics. For example, when a colder air mass moves over warmer ground, the bottom layer of air is heated. That air rises, forming clouds, rain, and sometimes thunderstorms. How would a moving air mass form an inversion? When a warmer air mass travels over colder ground, the bottom layer of air cools and, because of its high density, is trapped near the ground.
In general, cold air masses tend to flow toward the equator and warm air masses tend to flow toward the poles. This brings heat to cold areas and cools down areas that are warm. It is one of the many processes that act towards balancing out the planet’s temperatures.
Global Air Circulations
Global Circulations (https://www.weather.gov/jetstream/circ) explain how air and storm systems travel over the Earth’s surface. The global circulation would be simple (and the weather boring) if the Earth did not rotate, the rotation was not tilted relative to the sun, and had no water.
In a situation such as this, the sun heats the entire surface, but where the sun is more directly overhead it heats the ground and atmosphere more. The result would be the equator becomes very hot with the hot air rising into the upper atmosphere.

That air would then move toward the poles where it would become very cold and sink, then return to the equator (above right)
One large area of high pressure would be at each of the poles with a large belt of low pressure around the equator.
However, since the earth rotates, the axis is tilted, and there is more land mass in the northern hemisphere than in the southern hemisphere, the actual global pattern is much more complicated.
Instead of one large circulation between the poles and the equator, there are three circulations…
- Hadley cell – Low latitude air movement toward the equator

Figure 15.9 Three main circulations exist between the equator and poles due to earth’s rotation. Polar cells have a full cycle rotation of air parcel from the North Pole to 60N or from the South Pole to 60S. Ferrel Cells have a full cycle rotation of air parcel from 60N to 30N or 60S to 30S. Hadley Cells have a full cycle rotation of air Full cycle rotation of air parcel from 30N or 30S to the Equator. Image Source Weather.gov is licensed under Public Domain. or that with heating, rises vertically, with poleward movement in the upper atmosphere. This forms a convection cell thatdominates tropical and sub-tropical climates.
- Ferrel cell – A mid-latitude atmospheric circulation cell for weather named by Ferrel in the 19th century. In this cell the air flows poleward and eastward near the surface and equatorward and westward at higher levels.
- Polar cell – Air rises, diverges, and travels toward the poles. Once over the poles, the air sinks, forming the polar highs. At the surface air diverges outward from the polar highs. Surface winds in the polar cell are easterly (polar easterlies).
Between each of these circulation cells are bands of high and low pressure at the surface. The high-pressure band is located about 30° N/S latitude and at each pole. Low pressure bands are found at the equator and 50°-60° N/S.
Usually, fair and dry/hot weather is associated with high pressure, with rainy and stormy weather associated with low pressure. You can see the results of these circulations on a globe. Look at the number of deserts located along the 30°N/S latitude around the world. Now, look at the region between 50°-60° N/S latitude. These areas, especially the west coast of continents, tend to have more precipitation due to more storms moving around the earth at these latitudes
Video: Earth Rocks – Atmospheric Circulation
Weather Fronts
The rest of this section will be devoted to four types of fronts. Three of these fronts move and one is stationary. With cold fronts and warm fronts, the air mass at the leading edge of the front gives the front its name. In other words, a cold front is right at the leading edge of moving cold air and a warm front marks the leading edge of moving warm air.
Stationary Fronts
Cold Fronts
Imagine that you are standing in one spot as a cold front approaches. Along the cold front, the denser, cold air pushes up the warm air, causing the air pressure to decrease. If the humidity is high enough, some types of cumulus clouds will grow. High in the atmosphere, winds blow ice crystals from the tops of these clouds to create cirrostratus and cirrus clouds. At the front, there will be a line of rain showers, snow showers, or thunderstorms with blustery winds. A squall line is a line of severe thunderstorms that forms along a cold front. Behind the front is the cold air mass. This mass is drier so precipitation stops. The weather may be cold and clear or only partly cloudy. Winds may continue to blow into the low pressure zone at the front. The weather at a cold front varies with the season.
- spring and summer: The air is unstable so thunderstorms or tornadoes may form.
- spring: If the temperature gradient is high, strong winds blow.
- autumn: Strong rains fall over a large area.
- winter: The cold air mass is likely to have formed in the frigid arctic so there are frigid temperatures and heavy snows.
Warm Fronts
Along a warm front, a warm air mass slides over a cold air mass. When warm, less dense air moves over the colder, denser air, the atmosphere is relatively stable.Imagine that you are on the ground in the wintertime under a cold winter air mass with a warm front approaching. The transition from cold air to warm air takes place over a long distance so the first signs of changing weather appear long before the front is actually over you. Initially, the air is cold: the cold air mass is above you and the warm air mass is above it. High cirrus clouds mark the transition from one air mass to the other.
Over time, cirrus clouds become thicker and cirrostratus clouds form. As the front approaches, altocumulus and altostratus clouds appear and the sky turns gray. Since it is winter, snowflakes fall. The clouds thicken and nimbostratus clouds form. Snowfall increases. Winds grow stronger as the low pressure approaches. As the front gets closer, the cold air mass is just above you but the warm air mass is not too far above that. The weather worsens. As the warm air mass approaches, temperatures rise and snow turns to sleet and freezing rain. Warm and cold air mix at the front, leading to the formation of stratus clouds and fog.
Occluded Fronts

An occluded front usually forms around a low pressure system. The occlusion starts when a cold front catches up to a warm front. The air masses, in order from front to back, are cold, warm, and then cold again.Coriolis Effect curves the boundary where the two fronts meet towards the pole. If the air mass that arrives third is colder than either of the first two air masses, that air mass slip beneath them both. This is called a cold occlusion. If the air mass that arrives third is warm, that air mass rides over the other air mass. This is called a warm occlusion. The weather at an occluded front is especially fierce right at the occlusion. Precipitation and shifting winds are typical. The Pacific Coast has frequent occluded fronts.
Remember, a weather front is basically the boundary between two air masses of different densities. At the center of each air mass is typically a high pressure. This means that weather is typically sunny within air masses, but their temperatures could vary with the season and humidity could vary based on the source region of the air mass.Now more often than not, these weather fronts are not isolated events. Often times, they are part of a larger rotating system called a mid-latitude cyclone. This type of cyclone will be discussed later in this chapter, but as an introduction it is a low pressure system that is usually mixing warmer air from the south (in the Northern Hemisphere) and colder air from the north.
Thunderstorms
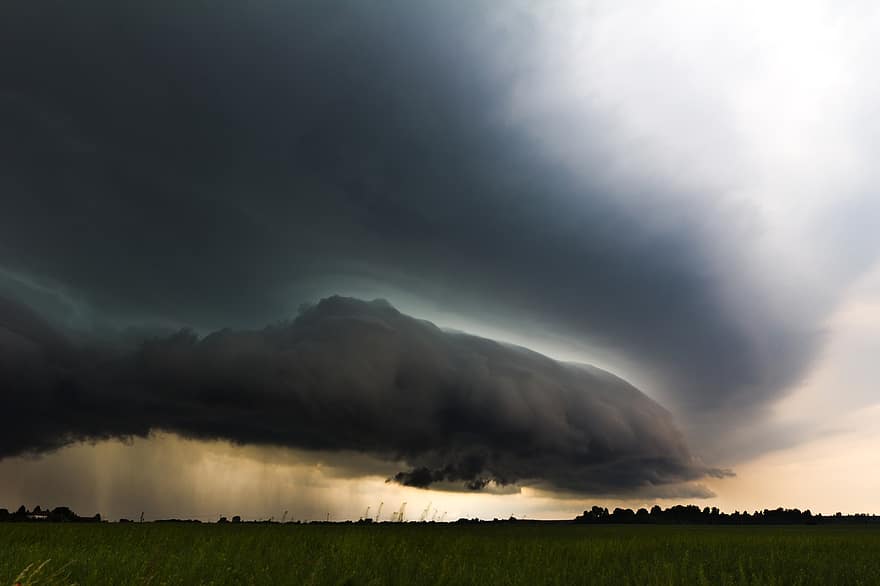
Figure 15.11 Lightning striking in the distance by Piklist is licensed as Public Domain.
Weather happens every day, but only some days have storms. Storms vary immensely depending on whether they’re warm or cold, coming off the ocean or off a continent, occurring in summer or winter, and many other factors. The effects of storms also vary depending on whether they strike a populated area or a natural landscape. Hurricane Katrina is a good example, since the flooding after the storm severely damaged New Orleans, while a similar storm in an unpopulated area would have done little damage. Thunderstorms are extremely common: Worldwide there are 14 million per year; that’s 40,000 per day! Most drop a lot of rain on a small area quickly, but some are severe and highly damaging. They form when ground temperatures are high, ordinarily in the late afternoon or early evening in spring and summer.
Thunderstorm Genesis
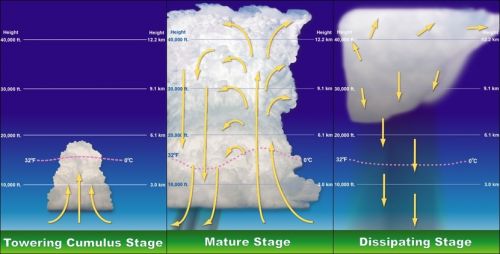
All thunderstorms go through a three-stage life cycle. The first stage is called the cumulus stage, where an air parcel is forced to rise, cool, and condense, called the lower condensation level, to develop into a cumulus cloud. The process of water vapor condensing into liquid water releases large quantities of latent heat, which makes the air within the cloud warmer, and unstable causing the cloud continues to grow upward like a hot air balloon. These rising air parcels, called updrafts, prevent precipitation from falling from the cloud. But once the precipitation becomes too heavy for the updrafts to hold up, the moisture begins to fall creating downdrafts within the cloud. The downdrafts also begin to pull cold, dry air from outside the cloud toward the ground in a process called entrainment.
Once the precipitation begins to fall from the cloud, the storm has reached the mature stage. During this stage, updrafts and downdrafts exist side-by-side and the cumulonimbus is called a cell. If the updrafts reach the top of the troposphere, the cumulus cloud will begin to spread outward creating a defined anvil. At the same time, the downdrafts spread within the cloud and at first make the cloud become wider, but eventually overtaking the updrafts. Cool downdrafts form when precipitation and the cool air from entrainment are dragged down to the lower regions of a thunderstorm. It is also during the mature stage when the storm is most intense producing strong, gusting winds, heavy precipitation, lightning, and possibly small hail.
Once the downdrafts overtake the updrafts, which also prevents the release of latent heat energy, the thunderstorm will begin to weaken into the third and final stage, called the dissipating stage. During this stage, light precipitation and downdrafts become the dominate feature within the cloud as it weakens. In all, only twenty percent of the moisture within the cloud fell as precipitation whereas the other eighty percent evaporates back into the atmosphere.
With severe thunderstorms, the downdrafts are so intense that when they hit the ground it sends warm air from the ground upward into the storm. The warm air gives the convection cells more energy. Rain and hail grow huge before gravity pulls them to Earth. Severe thunderstorms can last for hours and can cause a lot of damage because of high winds, flooding, intense hail, and tornadoes.Thunderstorms can form individually or in squall lines along a cold front. In the United States, squall lines form in spring and early summer in the Midwest where the maritime tropical (mT) air mass from the Gulf of Mexico meets the continental polar (cP) air mass from Canada.
So much energy collects in cumulonimbus clouds that a huge release of electricity, called lightning, may result. The electrical discharge may be between one part of the cloud and another, two clouds, or a cloud and the ground.
Tornadoes

Tornadoes, also called twisters, are fierce products of severe thunderstorms. As air in a thunderstorm rises, the surrounding air races in to fill the gap, forming a funnel. A tornado lasts from a few seconds to several hours. The average wind speed is about 177 kph (110 mph), but some winds are much faster. A tornado travels over the ground at about 45 km per hour (28 miles per hour) and goes about 25 km (16 miles) before losing energy and disappearing.An individual tornado strikes a small area, but it can destroy everything in its path. Most injuries and deaths from tornadoes are caused by flying debris. In the United States an average of 90 people are killed by tornadoes each year. The most violent two percent of tornadoes account for 70% of the deaths by tornadoes.
Tornadoes form at the front of severe thunderstorms. Lines of these thunderstorms form in the spring where where maritime tropical (mT) and continental polar (cP) air masses meet. Although there is an average of 770 tornadoes annually, the number of tornadoes each year varies greatly.
In late April 2011, the situation was ripe for the deadliest set of tornadoes in 25 years. In addition to the meeting of cP and mT mentioned above, the jet stream was blowing strongly in from the west. The result was more than 150 tornadoes reported throughout the day.
The entire region was alerted to the possibility of tornadoes in those late April days. But meteorologists can only predict tornado danger over a very wide region. No one can tell exactly where and when a tornado will touch down. Once a tornado is sighted on radar, its path is predicted and a warning is issued to people in that area. The exact path is unknown because tornado movement is not very predictable.
The intensity of tornadoes is measured on the Enhanced Fujita Scale, which assigns a value based on wind speed and damage.
| Table 15.3 Enhanced Fujita Scale Tornado Characteristics | ||
|---|---|---|
| Enhanced Fujita Scale | Wind (mph) | Damage |
| EF-0 (Gale) | 65-85 | Light – tree branches fall and chimneys may collapse |
| EF-1 (Weak) | 86-110 | Moderate – mobile homes, automobiles pushed aside |
| EF-2 (Strong) | 111-135 | Considerable – roofs torn off houses, large trees uprooted |
| EF-3 (Severe) | 136-165 | Severe – houses torn apart, trees uprooted, cars lifted |
| EF-4 (Devastating) | 166-200 | Devastating – houses leveled, cars thrown |
| EF-5 (Incredible) | Over 200 | Incredible – structures fly, cars become missiles |
Cyclones
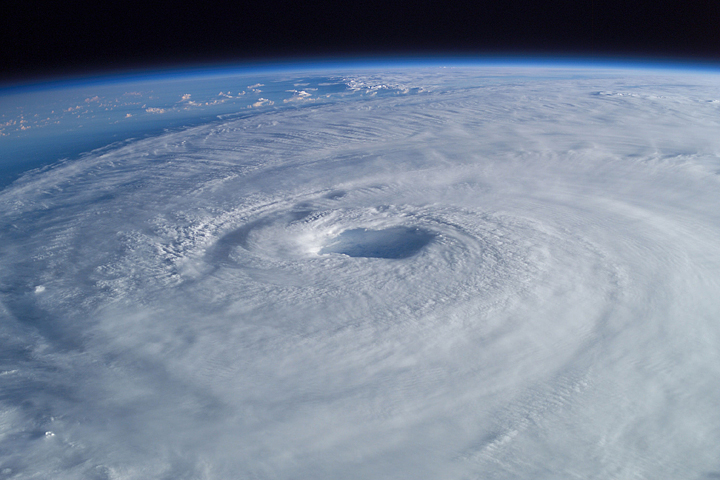
Figure 15.14 Image of Hurricane Isabel, September 15th, 2003 (Image source ) by NASA is licensed as Public Domain.
Cyclones can be the most intense storms on Earth. A cyclone is a system of winds rotating counterclockwise in the Northern Hemisphere around a low pressure center. The swirling air rises and cools, creating clouds and precipitation.There are two types of cyclones: middle latitude (mid-latitude) cyclones and tropical cyclones. Mid-latitude cyclones are the main cause of winter storms in the middle latitudes. Tropical cyclones are also known as hurricanes.
An anticyclone is the opposite of a cyclone. An anticyclone’s winds rotate clockwise in the Northern Hemisphere around a center of high pressure. Air comes in from above and sinks to the ground. High pressure centers generally have fair weather.
Mid-Latitude Cyclones
Mid-latitude cyclones, sometimes called extra-tropical cyclones, form at the polar front when the temperature difference between two air masses is large. These air masses blow past each other in opposite directions. Coriolis Effect deflects winds to the right in the Northern Hemisphere, causing the winds to strike the polar front at an angle. Warm and cold fronts form next to each other. Most winter storms in the middle latitudes, including most of the United States and Europe, are caused by mid-latitude cyclones.The warm air at the cold front rises and creates a low pressure cell. Winds rush into the low pressure and create a rising column of air. The air twists, rotating counterclockwise in the Northern Hemisphere and clockwise in the Southern Hemisphere. Since the rising air is moist, rain or snow falls.
Mid-latitude cyclones form in winter in the mid-latitudes and move eastward with the westerly winds. These two- to five-day storms can reach 1,000 to 2,500 km (625 to 1,600 miles) in diameter and produce winds up to 125 km (75 miles) per hour. Like tropical cyclones, they can cause extensive beach erosion and flooding.
Mid-latitude cyclones are especially fierce in the mid-Atlantic and New England states where they are called Nor’easters, because they come from the northeast. About 30 Nor’easters strike the region each year.
Hurricanes
If the temperature reaches or exceeds 28 degrees C (82 degrees F) the air begins to rotate around the low pressure (counterclockwise in the Northern Hemisphere and clockwise in the Southern Hemisphere). As the air rises, water vapor condenses, releasing energy from latent heat. If wind shear is low, the storm builds into a hurricane within two to three days.
Hurricanes are huge with high winds. The exception is the relatively calm eye of the storm where air is rising upward. Rainfall can be as high as 2.5 cm (1″) per hour, resulting in about 20 billion metric tons of water released daily in a hurricane. The release of latent heat generates enormous amounts of energy, nearly the total annual electrical power consumption of the United States from one storm. Hurricanes can also generate tornadoes.
Hurricanes are huge with high winds. The exception is the relatively calm eye of the storm where air is rising upward. Rainfall can be as high as 2.5 cm (1″) per hour, resulting in about 20 billion metric tons of water released daily in a hurricane. The release of latent heat generates enormous amounts of energy, nearly the total annual electrical power consumption of the United States from one storm. Hurricanes can also generate tornadoes.Hurricanes are strange creatures because they are deadly monsters, yet have a gentle, but cold heart. The anatomy of a hurricane is fairly simple, though the processes involved are quite complex. As a low pressure disturbance forms, the warm, moist air rushes towards the low pressure in order to rise upward to form towering thunderstorms. Around the low pressure disturbance is a wall of clouds called an eye wall. Within the eye wall, the wind speeds are greatest, the clouds are the tallest, atmospheric pressure is at its lowest, and precipitation is most intense.
At the center or heart of the hurricane is called the eye. Within the eye of a hurricane, winds are light, precipitation is minimal, and occasionally the skies above are clear. It is the calm region of the tropical storm, but that is what makes it so dangerous. Many people tend to go outside as the eye moves overhead because they believe the storm is over. But what some don’t realize is that “round two” is coming from behind. Moving away from the eye wall are organized, intense thunderstorms, called spiral rain bands, that rotate around and toward the storm’s eye wall.
Hurricanes are assigned to categories based on their wind speed and estimated damage.
| Table 15.4 Saffir Simpson Scale for Hurricanes | ||
| Category | MPH | Estimated Damage |
| 1 (Weak) | 74-95 | Above normal; no real damage to structures |
| 2 (Moderate) | 96-110 | Some property damage; considerable damage to vegetation |
| 3 (Strong) | 111-130 | Some buildings damaged; mobile homes destroyed |
| 4 (Very Strong) | 131-156 | Complete roof failure on small residences; major beach erosion of beach areas |
| 5 (Devastating) | Over 156 | Complete roof and some building failure on most residential and industrial buildings |
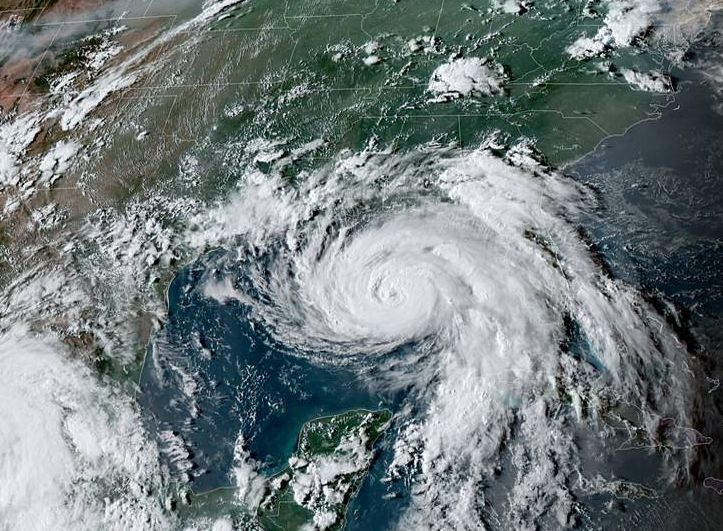
Hurricane Paths
Hurricanes move with the prevailing winds. In the Northern Hemisphere, they originate in the trade winds and move to the west. When they reach the latitude of the westerlies, they switch direction and travel toward the north or northeast. Hurricanes may cover 800 km (500 miles) in one day.Damage from hurricanes comes from the high winds, rainfall, and storm surge. Storm surge occurs as the storm’s low pressure center comes onto land, causing the sea level to rise unusually high. A storm surge is often made worse by the hurricane’s high winds blowing seawater across the ocean onto the shoreline. Flooding can be devastating, especially along low-lying coastlines such as the Atlantic and Gulf Coasts. Hurricane Camille in 1969 had a 7.3 m (24 foot) storm surge that traveled 125 miles (200 km) inland.
Hurricanes typically last for 5 to 10 days. Over cooler water or land, the hurricane’s latent heat source shut downs and the storm weakens. When a hurricane disintegrates, it is replaced with intense rains and tornadoes.
There are about 100 hurricanes around the world each year, plus many smaller tropical storms and tropical depressions. As people develop coastal regions, property damage from storms continues to rise. However, scientists are becoming better at predicting the paths of these storms and fatalities are decreasing. There is, however, one major exception to the previous statement: Hurricane Katrina.
Blizzards and Lake Effects
A blizzard is distinguished by certain conditions:
- Temperatures below –7 degrees C (20 degrees F); –12oC (10 degrees F) for a severe blizzard.
- Winds greater than 56 kmh (35 mph); 72 kmh (45 mph) for a severe blizzard.
- Snow so heavy that visibility is 2/5 km (1/4 mile) or less for at least three hours; near zero visibility for a severe blizzard.
Blizzards happen across the middle latitudes and toward the poles, usually as part of a mid-latitude cyclone. Blizzards are most common in winter, when the jet stream has traveled south and a cold, northern air mass comes into contact with a warmer, semitropical air mass. The very strong winds develop because of the pressure gradient between the low pressure storm and the higher pressure west of the storm. Snow produced by the storm gets caught in the winds and blows nearly horizontally. Blizzards can also produce sleet or freezing rain.
In winter, a continental polar air mass travels down from Canada. As the frigid air travels across one of the Great Lakes, it warms and absorbs moisture. When the air mass reaches the leeward side of the lake, it is very unstable and it drops tremendous amounts of snow. This lake-effect snow falls on the snowiest, metropolitan areas in the United States: Buffalo and Rochester, New York.
Heat Waves
Another potentially deadly weather phenomena is a heat wave. A heat wave is different for different locations; it is a long period of hot weather, at least 86 degrees F (30 degrees C) for at least three days in cooler locations but much more in hotter locations. Heat waves have increased in frequency and duration in recent years.

Video: Earth Rocks – Weather Phenomena
Licenses and Attributions
“Open Geography” by Lumen Learning is licensed under CC BY Adaptation: Renumbering, Remixing
