
17.1 Earth Science and You
Becoming a Better Citizen through Science
If someone asks you “what is science?” you might say that it’s a bunch of facts and explanations. But that’s only part of the story. Science is a knowledge base. But science is also a way of learning about the world.
Science is different from other types of information because scientists follow rigorous methods to learn about the world. A scientific idea must be testable and falsifiable. Ideas that are not supported by observations and data are revised or thrown out. The distinction between science and other ways of understanding the world is important because scientific information has been obtained with much more rigor than ideas that are the result of opinion, gut feelings, or faith. Scientists use the scientific method to answer questions about the natural world. The scientific method is not linear but takes on this basic structure: Ask a question, do background research, propose a hypothesis, test the hypothesis using data from observations and experiments, continue testing the hypothesis if it holds up or find a new hypothesis if it does not, eventually create a theory. A theory is an explanation of a complicated set of phenomena that fits virtually all of the available data. The theories of evolution, plate tectonics, and climate change are crucial to understanding earth science.
Whether you realize it or not, science impacts your life in every way. Science ultimately makes your life better, thanks to it you have access to food, water and medicine, thus increasing your lifespan and allowing you to live more comfortably. We could go on and easily list the scientific achievements that surround you, such as your phone, computer, electricity, medicine, etc., but science is simpler than that. Every time you observe something, a bird chirping, a pen falling, a shooting star, there is a systemic process in place to explain those observations – the scientific method. Using this method, many of the everyday observations you witness already have answers that scientists discovered long ago, but some observations still do not have answers. For example, if you contract strep throat, a bacterial infection, you go to the doctor and take antibiotics to get better, we have an answer or “cure” for strep throat. Scientists have conducted many experiments, retested them over and over to achieve that confidence in that “cure”. But, say you get diagnosed with colon cancer, there is no answer or “cure” to colon cancer, although there are treatments to slow the spread or completely reduce the signs of it for life (complete remission). Science is still trying to figure out the “cure” to cancer and scientists are conducting experiments every day, using the scientific method, to try to find an answer. Science is the never-ending search for answers to this amazing universe and maybe even beyond.
The reason understanding science and the systematic way science is conducted is important is so you can process scientific information and make informed decisions. It is about understanding how far humans have come using science, the collective effort of many to improve society, to improve your life. And the greatest thing about science is that anyone can conduct research or make scientific discoveries. Following the scientific method, you can answer something simple, such as what paint is best for your walls or something massive like the climate crisis. Science enriches your life, and you use it every day without even realizing it sometimes. But, if you do not understand the fundamentals or process of science then you may start to form your own misconceptions and make poor decisions that can impact your life negatively, to the point it may even kill you. Science is the reliable way we learn about everything around us; it requires a collective of rigorous testing to acquire evidence and knowledge to answer the questions of the world around us and create the human society we have today.
Humans and Astronomy
The topic of astronomy is an excellent model that we can use to demonstrate the progress of science over years, decades, and centuries.
Ancient astronomers constructed a model (partly from observations and partly from philosophical beliefs) that Earth was the center of the universe and everything moved around it in circular orbits. At first, our available observations of the Sun, Moon, and planets did fit this model; however, after further observations, the model had to be updated by adding circle after circle to represent the movements of the planets around Earth at the center. As the centuries passed and improved instruments were developed for keeping track of objects in the sky, the old model (even with a huge number of circles) could no longer explain all the observed facts.
Science is essentially a “progress report” on the current state of recorded data and the hypotheses that are derived from ever-evolving data.
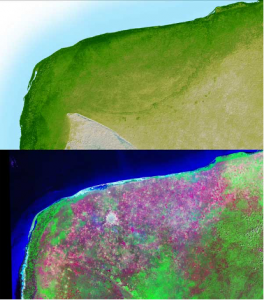
Figure 17.1 Shutter radar topography on top and Landsat on bottom of the Chicxulub Crater in the Yucatan peninsula, Mexico. One half of the impact crater is on land, and the other underwater. Credit: NASA, public domain.
Through direct observation with updated technology, humans have become better able to discern the behavior of celestial bodies like the Sun, asteroids, meteors, comets, and supernovas. We have come to understand that our existence on this planet hinges on ideal conditions for life that exist on Earth, and that celestial events can impact those conditions in both advantageous and disadvantageous ways. We know from recorded observations that the Earth has been subjected to varying degrees of cooling and warming over the vast period of time that Earth’s orbit takes to undergo changes to its orbital cycles (Milankovitch Cycles). We also know that from recorded data, the Earth has been subjected to many impacts from asteroids and comets over its existence.
The most well-known of these impacts is the Chicxulub asteroid impact on the Yucatán Peninsula in Mexico that occurred around 66.6 Ma, leading to the demise of the dinosaurs. The evidence for this impact is held by the “Alvarez Hypothesis”. The impact of this 10km (6.2 miles) wide diameter asteroid left a visible crater, created tsunamis, forest fires, and ejected an enormous amount of pulverized rock and debris into the atmosphere, leading to much cooler conditions globally following the impact. The impact was so violent that it damaged the highly resistant quartz crystals in rocks near the impact, creating “shocked quartz” crystals in close proximity to the crater. In addition, a global layer of the element Iridium was deposited on the Earth directly following the impact. Iridium is not a very common element in the Earth but is very common in asteroids. This theory competes with a Large Igneous Province eruption known as the Deccan Traps, which occurred after the impact, and emitted vast amounts of volcanic gases into the atmosphere over hundreds of thousands of years. While the cause of the demise of the dinosaurs will likely be debated for some time, there is no doubt that the asteroid impact had a negative effect on the dinosaurs during the end of the Cretaceous period. You can read more about this debate here.
The asteroid responsible for the Chicxulub crater was a very large asteroid. In human times, other much smaller impacts have been observed. Examples include the Tunguska Impact in Siberia, Russia in 1908. The explosion leveled trees across more than 2,000 square kilometers. The explosion is consistent with a large meteor strike, but to this day no evidence of a crater has been found. Now known as the Tunguska Event, its cause remains a mystery to this day.
One of the challenges in studying the Tunguska event is its remoteness. The region is sparsely populated, and the event only had a handful of witnesses. Scientific investigations of the event didn’t occur until the 1920s. It was then that the impact region was mapped and early searches for an impact crater were undertaken. By the 1960s it was clear the event was similar to an airburst nuclear explosion, with an energy of about 5 Megatons.
More recently, in In February of 2013 a meteor streaked across the sky near Chelyabinsk, which was caught on video from various angles, much to the delight of news media everywhere. The large amount of video data also meant there was more data on the size and trajectory of the meteor than we usually have. Now a paper in Nature presents an analysis of the Chelyabinsk meteor, as well as some sobering statistics on meteor strikes with Earth.
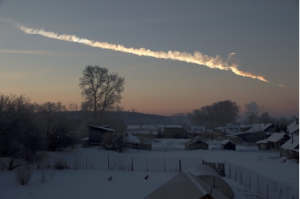
Figure 17.2 This image of a vapor trail was captured about 125 miles (200 kilometers) from the Chelyabinsk meteor event, about one minute after the house-sized asteroid entered Earth’s atmosphere. Credit: Alex Alishevskikh, NASA.
By analyzing video, infrasound and seismic data, the team estimated the size of the meteor to be about 20 meters in diameter, with an impact energy of about 500 kilotons. This is about 25 – 30 times more energy than was released by the atomic bombs dropped during World War II. Fortunately, the Chelyabinsk meteor came in at a very shallow angle, and exploded about 25 km (15 miles) above the ground, thus limiting its damage. Even from this height there was some serious shock wave damage, including injuries to more than 1,500 people.
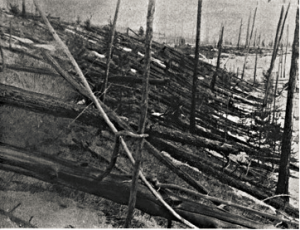
Figure 17.3 Trees felled by the Tunguska explosion. Credit: the Leonid Kulik Expedition. Credit: NASA, public domain.
By comparison, the famous Tunguska impact of 1908 was about 10 – 15 megatons, or about thirty times larger. It was likely 100 meters wide and detonated 5 – 10 kilometers above the ground. If Tunguska had detonated over a major city it would have wiped it off the map. The Chelyabinsk meteor wasn’t a potential city-killer, but it was moderately powerful.
Usually when we look at the risk of meteor impacts the focus has been on Tunguska-type impacts. That is, potential city killers. Larger meteoroids would cause more regional devastation, but they are also larger and easier to detect. Meteors a few meters wide are much more common and nearly impossible to detect, but are too small to create any serious damage. Now with Chelyabinsk we have a different risk. Moderate local damage from meteoroids tens of meters wide. One way to look at the odds of an impact is through an estimation of the cumulative number of impacts at a given size. In a typical year, how many 10 cm meteors strike the earth, how many are 1 meter in diameter, how many are 10 meters wide?
Just to be clear, the risk of you and yours being injured by a meteor impact is extremely low. But these new results indicate that the risk of Chelyabinsk-size impacts is higher than we’ve assumed. That means we would do well to put more attention on tracking meteoroids of that size. Fortunately we have the technical ability to do that. Whether we have the will is another story.
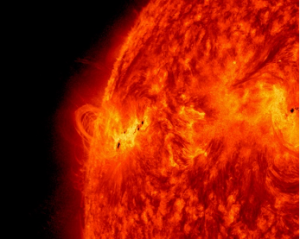
Figure 17.4 An image of a solar flare from our Sun. Credit: NASA, public domain.
The Sun is an average sized star that will continue to burn for billions of years into the future. The Sun has solar cycles that it undergoes during its lifetime, and during some of these cycles there are higher amounts of sunspots.Sunspots are areas of the sun that are cooler than other areas of the sun, with enhanced magnetic fields. During periods of high sunspot activity, solar flares and coronal mass ejections (CME) can occur. In 1859, an event known as the Carrington Event occurred over North America. This event disrupted telegraph lines, electrically shocked telegraph operators, and caused the occurrence of the Aurora Borealis at latitudes as low as Cuba, Hawaii, and Mexico. More recently, in 1989, a much smaller CME occurred over North America. This event disrupted the electrical grid in Canada. People as far south as Florida and Cuba could see auroras in the sky, while North America’s entire interconnected electrical grid groaned under the strain. The Canadian province of Quebec’s electrical grid wasn’t able to handle the load and went entirely offline. For 12 hours, in the freezing Quebec winter, almost the entire province was without power.
In summary, it is obvious that humans living on Earth need to be aware of the hazards that exist in our relation to Earth’s place in the Universe. NASA has a program that tracks near-Earth objects (NEO’s) that could potentially hit the Earth, but it can’t see all of them, so smaller impactors like the Chelyabinsk would be very difficult to detect. A detailed list of NEO’s is found on the Sentry program page. Ever-improving technology may refine our ability to detect NEO’s that may impact the Earth in the future, but the hazards related to impactors will likely remain for the foreseeable future.
Space weather can have an impact on our advanced technologies which has a direct impact on our daily lives. The main area of concern will most likely be our nation’s electric power grid. Northern territories are more vulnerable to these effects than areas farther south. Generally, power outages due to space weather are very rare events, but evidence suggests that significant effects could occur. These power outages may have cascading effects, causing:
- Loss of water and wastewater distribution systems
- Loss of perishable foods and medications
- Loss of heating/air conditioning and electrical lighting systems
- Loss of computer systems, telephone systems, and communications systems (including disruptions in airline flights, satellite networks and GPS services)
- Loss of public transportation systems
- Loss of fuel distribution systems and fuel pipelines
- Loss of all electrical systems that do not have back-up power
To begin preparing, you should build an emergency kit and make a family communications plan.
Humans and Rocks
At the beginning of this course, you may have thought, rocks are dumb, useless, or just boring. You may still find them boring, but hopefully you have a new appreciation for their importance. Rocks are the world’s greatest record keepers; they tell us the stories of the Earth and even the universe. Rocks provide us with answers to the past to help us predict the future. Not only are rocks great record keepers of time, they are also useful tools for science and crafts. For better or worse, coal is a very useful tool, it is a sedimentary rock that we burn (a fossil fuel) in order to turn turbines that provide us with electricity and energy. Without it, we wouldn’t have had the industrial revolution and the technological advances we have today. Similarly, without the mining of precious minerals we wouldn’t have the resources to make our technology work correctly. Those are easy examples of how rocks can benefit humanity. Since rocks are the key to the past, they help us understand climate changes through time, the evolution of organisms and the environment, the occurrence of natural hazards (volcanoes, earthquakes, landslides, etc.), the growing conditions of crops and the location of water sources, they even help you take care of your oral health! Everything you have learned in this course, links back to, in some way, to rocks.
Understanding the history of rocks of Earth allows us to reach out to space to understand other planets and celestial bodies. Rocks help us understand the movements of plate tectonics, where our planet rifts apart, collides or slides around. For example, if you see large mountains that span throughout a region, you can expect they were formed by the collision of two continental plates, evidenced by high-grade metamorphic rocks that formed through regional metamorphism. Rocks also help us understand past, current and future volcanic systems to help predict eruptions and possible future hazards. Similarly, earthquakes, the clash of rocks, leave their mark on rocks and formations to help us understand how earthquakes occur and the hazards they can produce. Rocks record the past history of water, where it migrated and where it is currently stored. Rock formations can record past weather patterns and events, as well as record the climate over the past 4.5 billion years, which helps us understand how today’s climate is changing. Almost everything in Earth Science is based on the information contained in rocks.
For example, consider this cobble, found in Montana (Figure 17.5):
Figure 17.5 An image of a sedimentary rock with Points of annotation showing the 7-chapter history of this one rock sample. Photo by Callan Bentley.
What is the history of a rock like this? What did it take for this thing to exist?
This chunk of rock contains features that we can translate into information. The variety of materials it is made from, how those materials are arranged, other features that cut across them, and the shape of the sample all convey information about past processes and circumstances. What would it take to make a rock just like this one? Why does it exist in this particular way?
As an exercise in practicing decoding the language of Rock, let’s translate: The smooth tan material is limestone. It originally formed as inorganic deposits of carbonate mud, laid down (1) in calm water, as evidenced from its very fine grain size. It sat still long enough to stick together into a semi-coherent mass. But then it must have been savagely ripped up to make (2) mud-chip clasts & entombed in (3) quartz sand. The event that was energetic enough to tear into the carbonate mud and rip it up, as well as energetic enough to transport in coarse particles of sand. It must have been a storm, perhaps a hurricane. The threat of more violent storms diminished as the sediment was buried and sank further and further underground, smothered beneath the crushing weight of thousands of feet of sediment piled atop it. Then the carbonate mud chunks and surrounding quartz sand (4) lithified into rock: No longer loose sediment, it was transformed through compaction and cementation into a solid, coherent rock: limestone clasts in quartz sandstone. After it was solid rock, it broke. Some stress, perhaps imparted by the wrenching compression of mountain building, snapped the bonds holding the rock together. This made fractures, but those fractures were soon healed by the precipitation of the mineral quartz, making (5) thin quartz veins. This is something that must have taken place deep underground, but in order for us to pick it up and hold it, we know it must thereafter have been (6) uplifted. It made its way back to Earth’s surface, and this particular chunk was broken off from its source outcrop. Finally, it experienced (7) differential weathering, etching away the limestone more readily than the quartz sandstone. This gives the sample its distinctive texture.
The rock is no longer just a rock. By speaking its language, we have turned it into a book, with seven chapters.
This is the power of rocks: it allows curious humans to interact with inert rock, and coax stories from that rock — vital tales of the planet’s ancient past and possible future. Being able to decode the stories of rocks, hidden in plain sight, is an ability akin to an acquired superpower and what you have learned will change the way you look at your world.
Like the best stories from our favorite storytellers, what we learn resonates with us, changes us. The Earth’s many tales help us understand our present and past, live our lives more meaningfully, and prepare for a future we can better comprehend. The perspective granted by speaking Rock helps us live better lives, and look to the future with hope and confidence.
Humans and Plate Tectonics
As we learned in Chapter 7 (Plate Tectonics), the Earth is covered by thick tectonic plates that are constantly on the move at the rate of centimeters per year. Over geologic time (hundreds of thousands to hundreds of millions of years) tectonic plates move over vast distances. The vast distances that tectonic plates move occur one earthquake at a time. Species on Earth have come and gone often due the effects of plate tectonics and humans are no exception to this. The landforms that we see today on various different types of maps around the world have impacted where humans have chosen to live on this planet. Millions of years of convergent plate tectonics have created large mountain ranges like the Alps in Switzerland, or the Himalayas in southern Asia which have created unique weather conditions on either side of them and substantial geographic barriers for the migration of all species. In other parts of the world, convergent tectonics have created zones of high volcano and earthquake density, creating hazards (eruptions and severe shaking) and benefits.
Benefits of volcanic systems include rich soil for agriculture from volcanic deposits, and geothermal energy from volcanic systems. Volcanic soils can be rich in nutrients which facilitate the production of certain agriculture. The Pinot Noir wines of the Willamette Valley of Oregon are grown in eroded basaltic soils and are well-known for their exquisite taste. Other regions that benefit from volcanic soils include Italy, Hawaii, and Greece. You can read more about these regions and their wines here.
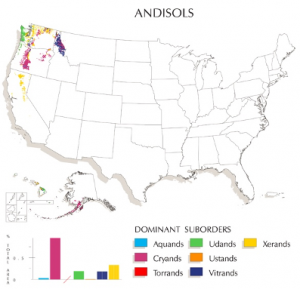
Figure 17.6 Map of andisols (soil formed from volcanic activity) in the US, the primary andisol is cryands which is dominate in the Pacific Northwest and Alaska. Credit: USDA, public domain.
Geothermal energy is a renewable resource that is being developed in many regions around the world such as Iceland, Indonesia, New Zealand, Turkey, and the Philippines. Geothermal energy originates from heat rising to the surface from Earth’s molten iron core created during the formation and compression of the early Earth as well as from heat produced continuously by radioactive decay of uranium, thorium, and potassium in the Earth’s crust. Geothermal power plants harness this heat energy to produce electricity much in the same way that heat from burning coal generates energy. Water is injected underground and heated. The steam that emerges can be used directly, the heat can be transferred to a closed system of another fluid, which then boils. Either way, the steam (or other high-pressure gas) ultimately turns a turbine and powers a generator.
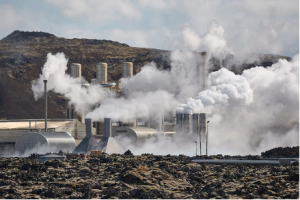
Figure 17.7 Steam is released from a geothermal power plant. Image by Open Access Government (CC-BY).
Humans and Volcanoes
Volcanoes are an obvious hazard in Oregon, the Juan de Fuca plate subducting underneath Oregon has created the beautifully stunning Cascade range. Almost anywhere you go in Oregon you will see evidence of Oregon’s past volcanic history. The cascades are only the newest volcanic chain to threaten the Pacific Northwest, but Oregon has a very long volcanic history. Not too far in the past, Washington’s Mt. St. Helens 1980 eruption reminded America that the cascade volcanoes are active and deadly. Even visiting Crater Lake (formally Mt. Mazama), in Oregon is a stark reminder of the power of volcanoes and the hazards they produce. Mt. Mazama violently erupted 7,700 years ago causing the destruction of its conical volcanic shape, in an eruption almost 40 times larger than Mt. St. Helens. Violent eruptions are not the only thing to worry about though, slow, passive lava flows, such as those from Newberry Caldera, can slowly swallow entire homes and towns. Every single active cascade volcano, Mt. Hood, Mt. Jefferson, Newberry, Three Sisters, and Crater Lake have the potential to erupt, it is in your best interest to understand your local hazards and prepare for the worst.
The next most likely eruption will be produced by Mt. Hood, Newberry, Three Sisters, and Crater Lake, with South Sister ranking the most likely to erupt in Oregon. Magmatic activity at South Sister is evident by the growing bulge on its western flank that began growing in 1996 and still continues to grow slowly today. Luckily, most cascade volcanoes do not have large population centers nearby and volcanology has come far in predicting eruptive activity, but that does not mean you do not need to worry. Even if everyone survives a local volcanic eruption, you will have to deal with the aftermath of ash fall, road closures, landscape changes and hazardous breathing conditions.
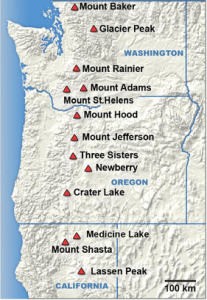
Figure 17.8 The active volcanos in the US cascade range. Credit:USGS, public domain.
Thankfully, Linn Benton Community College does not lie in the path of any Cascade volcano, but it will suffer the ash produced from any major Cascade eruption. All the Cascade volcanoes are heavily trafficked and some cities, such as Hood River and Bend, are threatened by these volcanic systems. Lahars, lava flows, pyroclastic density currents, and ashfall are the main hazards created by Oregon volcanoes, some of these hazards, such as lahars and flank collapse don’t even need an eruption to occur. It is better to prepare for the worst than to be unprepared in a bad situation. Oregon’s USGS has a great volcanic preparedness kit essentials, along with hazard maps for all active Cascade volcanoes. If you live in Oregon or near active volcanoes, it is best to always have a repository mask and goggles to help alleviate side effects from ashfall. Always know your individual local volcanic hazards and educate your family and neighbors. There are early warning systems in place and every volcano is monitored by the Cascade Volcano Observatory, if a volcanic alert is given, please listen and follow their instructions, it could save your life.
Case Study 1: Mt. St. Helens, 1980
Mt. St. Helens, in Washington, USA erupted laterally on May 18th, 1980. This eruption, even with evacuation orders, still killed 57 people, including 30-year-old USGS scientist, David Johnston. The lateral blast, debris flow, lahars, and ash caused 1.1 billion in damage. The eruption killed over 7,000 big game animals, countless small animals and birds, over 12 million salmon fingerlings and 40,000 young salmon, and it destroyed and/or damaged over 200 homes, 185 miles of highways, 15 miles of railroad, tens of thousands of acres. Ashfall covered agriculture fields, destroying countless crops. Over 2.4 million cubic yards (900,000 tons) of ash was removed.
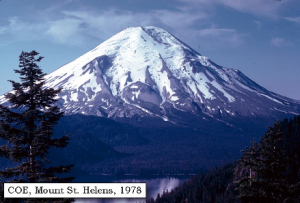
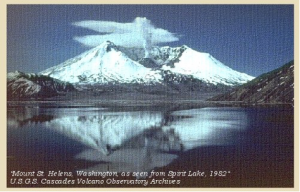
Figure 17.9 Left, Mt. St. Helens before the 1980 eruption standing 9,677 ft. Right, Mt. St. Helens after the 1980 eruption, now standing at 8,366 ft. Credit: USGS, public domain.
Before this major eruption, Mt. St. Helens was showing signs of unrest. On March 16th, a series of earthquakes began underneath the volcano. These earthquakes continued till March 27th, when Mt. St Helens started erupting steam, these steam explosions created a massive crater at the summit of the volcano, and continued on and off till May 17th. Around this time, magma began to intrude the north side of the volcano forming a bulge, known as a cryptodome, creating an unstable flank. This bulge grew roughly 2 m a day, until a magnitude 5.1 earthquake triggered its collapsed on May 18th. The entire flank of the volcano collapsed into a giant debris flow releasing pressurized magma and hydrothermal fluids in a massive eruption that lasted over 9 hours.
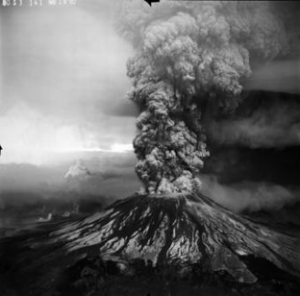
Figure 17.10 The Plinian column from the May 18th 1980 eruption. Credit: USGS, public domain.
This volcanic eruption is very significant, it the first heavily studied and documented eruption in modern times. This type of eruption, a lateral blast, had never been witnessed before. It birthed a new volcano monitoring era, safer and easier methods to monitor volcanoes and gave more insight to past and future eruptions. It also led to the creation of a mobile volcanologist unit, Volcano Disaster Assistance Program (VDAP), which assists other countries with volcanic unrest events. Lastly, the National Volcano Early Warning System was created, this warning system can alert the public of volcanic hazards and allows the continuous monitoring of all active US volcanos. Mt. St. Helens was a disaster, but its eruption led to a copious amount of new knowledge that saved future lives. Mt. St. Helens continued to erupt till 2008, creating a new lava dome in the summit caldera.
Video: How the Earth was Made: Mt. St. Helens
Case Study 2: Nevado del Ruiz, 1985
Navado del Ruiz is a remote stratovolcano located in the Andes Mountains, Columbia. In November, 1984, the volcano began to show signs of activity with gas emissions from fumaroles and earthquake swarms. Although, eruptions were small, the snowcapped volcano posed a serious threat of lahars. On Nov. 13th 1985, Nevado del Ruiz experienced a small magmatic eruption during a rainstorm. This eruption was noticed around 9 PM, at this point, lahars were flowing down the slopes of the volcano. Evacuation orders were given for no one to hear, the towns closest to the volcano did not have power, so live saving communication was nearly impossible in time. To further this, mistrust between the public and government officials and scientists lead to evacuation confusion and refusal. The first lahar, an hour after the eruption, hit the small town of Chinchiná were 1,000 people lost their lives. An hour later, the lahar reached the city of Armero were the flood of water and rock buried the town and killed 23,000 people and left 7,500 people homeless. In total, 26,000 lives were lost due to communication failures, these death were completely preventable.
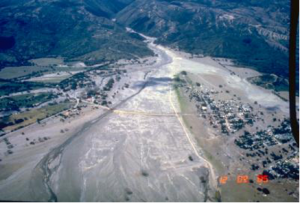
Figure 17.11 Ariel photograph of the city of Armero in the aftermath of the lahar. Credit: USGS, public domain.
Case Study 3: Mt. Pinatubo, 1991
Mt. Pinatubo is a stratovolcano located on the northern island of the Philippines. Multiple cities live in the surrounding area of the volcano and just 9 miles from the volcano is a US Air Force Base housing roughly 20,000 people, altogether 250,000 people were in danger from a Mt. Pinatubo eruption. On April 2nd 1991, multiple steam eruptions awakened the volcano from its 600 year slumber. USGS VDAP arrived to assist the Philippine Institute of Volcanology and Seismology (PHILVOLCS), together they monitored the ongoing activity and made the first hazard map for the volcano. Much like Mt. St. Helens, a dome steadily began to grow from the summit, while seismicity and ash emissions increased. VDAP and PHILVOLCS decided evacuations were needed, 60,000 people were evacuated from the volcano over June 9th and 10th. On June 12th, the volcano erupted sending ash 19 km into the atmosphere. After this, the remaining inhabitants were evacuated, over 200,000 people.
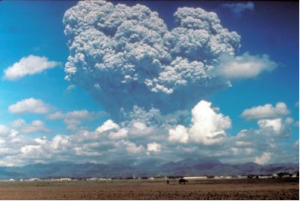
Figure 17.12 The smaller, June 12th eruption of Mt Pinatubo. Credit: USGS, public domain.
This was just the beginning of a series of massive eruptions. On June 15th, the eruption reached the climatic end while a typhoon rolled in. The massive eruption led to the destruction and collapse on the summit, creating a 2.5 km caldera and releasing a 40 km ash plume into the atmosphere. More than 840 people died during the eruptions, but thanks to the efforts of the VDAP and PHILVOLCS team many lives were saved and about 250 million dollars of property protected. The mixture of a typhoon and ash caused roof collapses killing many people. Eruptions continued after June 15th, but nothing close to the size of the climatic eruption. Over 700 million dollars in damage resulted from the eruptions. The resulting ash pumped into the atmosphere caused a global cooling of roughly 1-degree Fahrenheit.
Case Study 4: Kīlauea, 2018
Hawaii is not known for its massive eruptions, but it is one of our most active volcanoes. People travel around the world to visit the Hawaiian island volcanoes, specifically Kīlauea, the most active. Eruptions are a common site there, but in Spring 2018 activity increased significantly. The summit crater, Pele’s home, Halemaʻumaʻu crater and Puʻuʻōʻō crater in the East Rift Zone began erupting. Inflation at both craters showed as increase in volcanic activity causing an overflow of the lava lake.
On April 30th, the Puʻuʻōʻō crater collapsed, then 2 days later, the lava lake at Halemaʻumaʻu the summit crater lowered and began moving underneath towards the East Rift Zone. On May 3rd the ground in the East Rift Zone opened and a fissure erupted from the Earth. In the following days, 19 more fissures erupted spewing out lava. This lava may not be deadly and can easily be outrun, but lava tends to burn and bury everything in its path. Fissure 8 was the most active, and combined with the other fissure eruptions, over 13.7 square miles were covered in lava. 875 acres on new land was created off the east side of the island. The eruptions destroyed 700 homes, displaced 2,000 people, and caused 800 million dollars in damage. The eruptions continued and led to multiple collapse events of the Halemaʻumaʻu crater sending ash into the atmosphere. In September, a few months after eruptions began, Kīlauea stopped erupting.
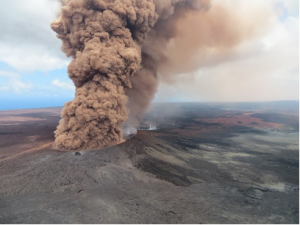
Figure 17.13 Eruption of the Puʻuʻōʻō crater. Credit: NPS, public domain
Video: Kīlauea Volcano – Lava Scenes from Fissure 8
Humans and Earthquakes
In chapter 9, we learned about earthquakes and how they can trigger multiple different types of hazards (shaking, liquefaction, tsunamis, fires, slope failures) that have impacted human life and property. One of the key goals of societies that are located in areas of the Earth that experience frequent seismic activity is to build resilient structures and infrastructure that can withstand earthquakes, which in turn, may reduce the impact of earthquakes to human life and property. To truly understand why earthquakes impact different societies differently, we need to understand the abilities of societies to create seismic resiliency. Societies that have a long history of living with earthquakes may have different strategies for mitigating earthquake impacts to societies. Societies also may have varying levels of economic resources to create seismically resilient structures.
Japan serves as a prime example of a society that has highly developed, seismically resilient structures. Since seismicity in Japan is fairly high, Japanese interest in historical seismicity can be traced back to the ninth century, only a few centuries after the formation of the ancient ruling state. A 1000 years later, 2 years earlier than the modern seismological society was founded, the research on historical seismology started in Japan in 1878. By the accumulation for the recent 140 years, the present Japanese seismologists can read many historical materials without reading cursive scripts. We have a convenient access to the historical information related to earthquakes, in the modern characters of 27,759 pages. We now have 214 epicenters of historical earthquakes from 599 AD to 1872.
Case Study 1: Kobe Earthquake, 1995
Despite having a good understanding of the behavior of seismic waves on buildings, the impacts of the Kobe earthquake (moment magnitude-Mw 6.9) of 1995 were substantial. Many buildings were not designed to withstand the severe shaking that occurred during the earthquake, and were built on soils that experienced liquefaction during the earthquake. Newer buildings fared much better than older buildings.
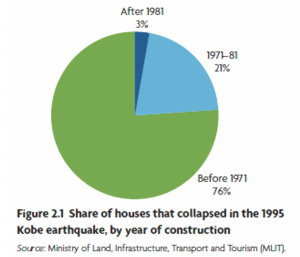
Figure 17.14 Pie chart of house collapses from the Koba earthquake. The majority of houses that were destroyed were built before 1971. Credit: Ranghieri, Federica, and Mikio Ishiwatari, eds. 2014. Learning from Megadisasters: Lessons from the Great East Japan Earthquake. Washington, DC: World Bank. doi:10.1596/978-1-4648-0153-2. CC BY 3.0.
Japan’s society devotes a great deal of investment into research, development, as a percent of Gross Domestic Product. It is notable that even with this level of investment in research and development, large magnitude earthquakes and their effects can still be impactful. The Kobe earthquake caused over 6,000 fatalities and cost over $100 billion (USD).
Case Study 2, Honshu Earthquake, 2011
In Japan, the Honshu Earthquake of 2011 was one of the largest earthquakes ever recorded. This earthquake also generated tsunami waves that inundated the coastlines of the island nation. The country had taken abundant steps to mitigate tsunami impacts to its shorelines with sea walls and hazard maps for many coastal towns. The tsunami waves overran the seawalls and decimated coastal towns and villages. The costs resulting from the earthquake and tsunami in Japan alone were estimated at $220 billion USD and over 20,000 lives were lost. . The damage makes the 2011 Great East Japan earthquake and tsunami the most expensive natural disaster in history. To learn from the tragedy in Japan, researchers collected extensive data on tsunami wave forces and building performance. This facilitated improvement in tsunami mitigation strategies, such as building codes.
If we compare the level of preparedness in Japan and the results of the Kobe earthquake and Honshu earthquake and tsunami to the impacts to other countries that have a lower level of preparedness and hazard mitigation it is not difficult to imagine the potential consequences of similar events in similarly high-density population countries.
Case Study 3, the Cascadia Subduction Zone
In the United States, in the Pacific Northwest, right under your feet is the Cascadia Subduction Zone. This convergent boundary hosts the Cascadia Megathrust fault which, research finds, has generated multiple large magnitude earthquakes similar to the Honshu earthquake of 2011. The Cascadia Subduction Zone is a 600-mile fault that runs from northern California up to British Columbia and is about 70-100 miles off the Pacific coast shoreline. There have been 41 earthquakes in the last 10,000 years within this fault that have occurred as few as 190 years or as much as 1200 years apart. The last earthquake that occurred in this fault was on January 26, 1700, with an estimated 9.0 magnitude. This earthquake caused the coastline to drop several feet and a tsunami to form and crash into the land. What is most surprising is that evidence for this great earthquake also came from Japan. Japanese historic records indicate that a destructive distantly-produced tsunami struck their coast on January 26, 1700. By studying the geological records and the flow of the Pacific Ocean, scientists have been able to link the tsunami in Japan with the great earthquake from the Pacific Northwest. Native American legends and other geologic evidence also support to the timing of this last event.
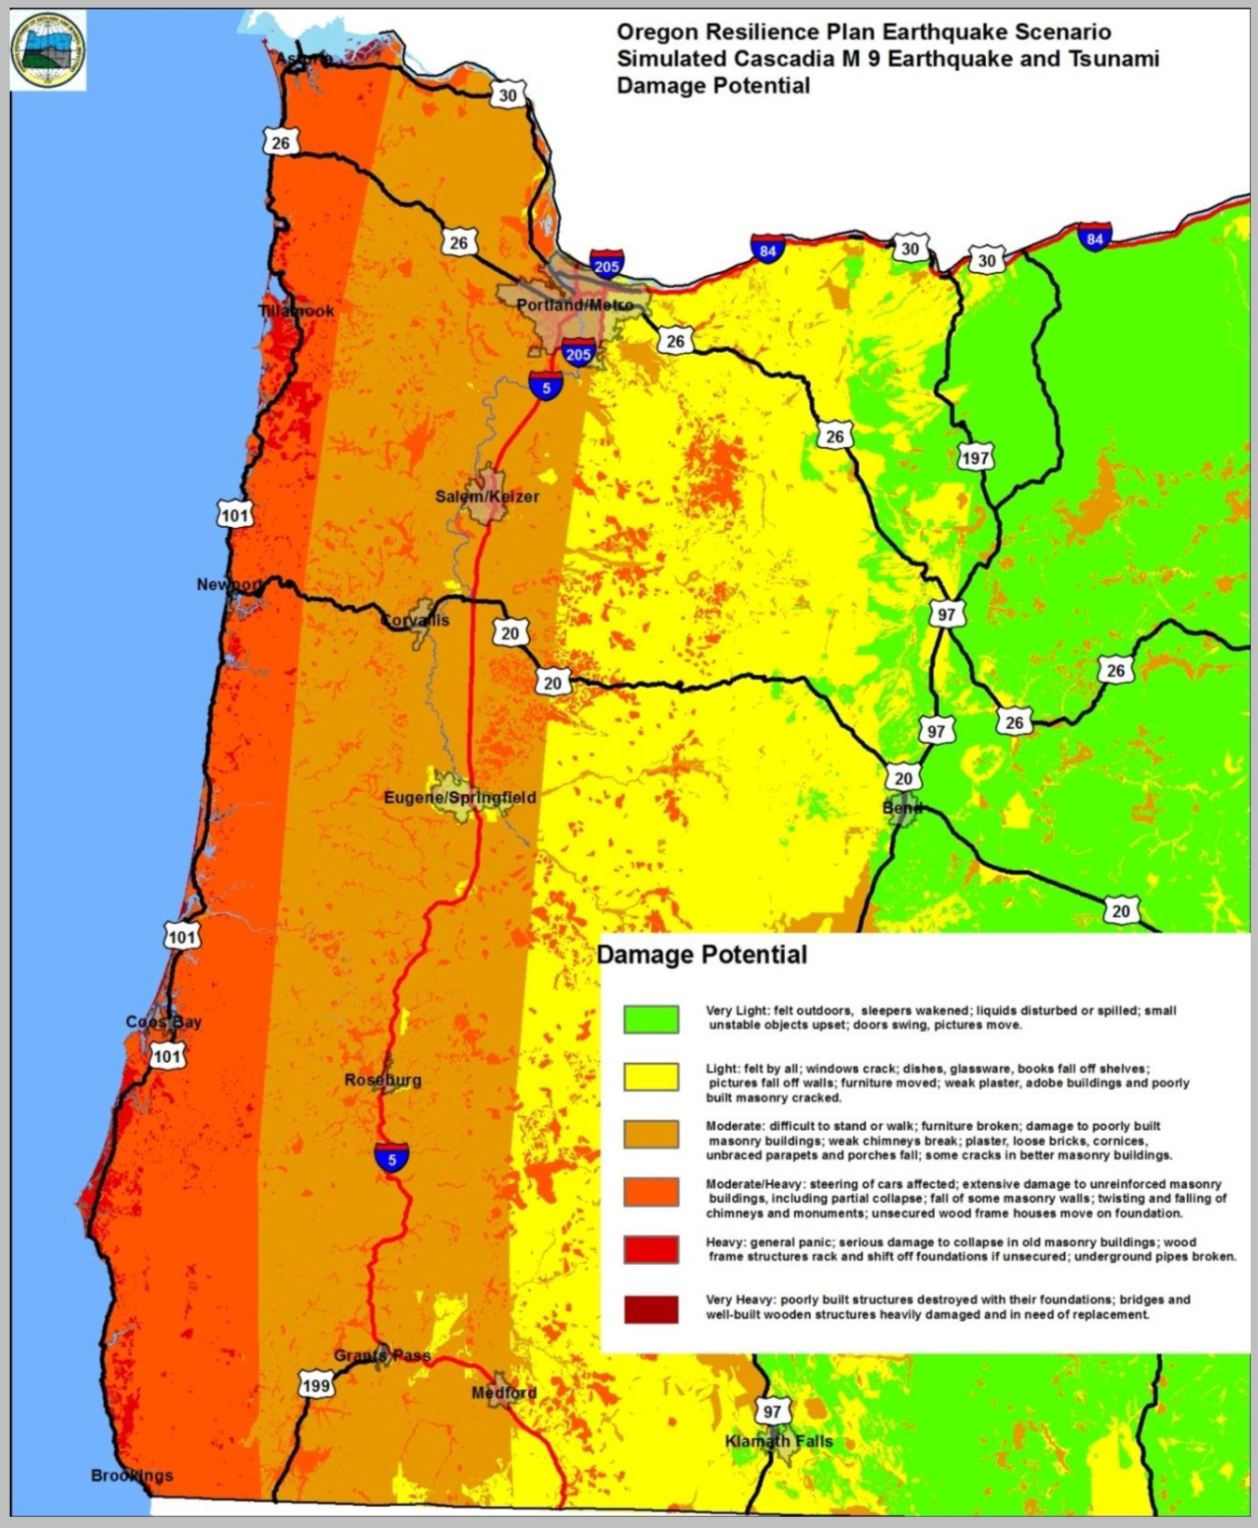
Figure 17.15 Expected ground shaking intensity from a magnitude 9 earthquake in Oregon. Oregon government, Public domain.
Oregon has the potential for a 9.0+ magnitude earthquake caused by the Cascadia Subduction Zone and a resulting tsunami of up to 100 feet in height that will impact the coastal area. There is an estimated 2-4 minutes of shaking or rolling that will be felt along the coastline with the strength and intensity decreasing the further inland you are. Currently, scientists are predicting that there is about a 37 percent chance that a megathrust earthquake of 7.1+ magnitude in this fault zone will occur in the next 50 years. This event will be felt throughout the Pacific Northwest. This earthquake is expected to kill thousands of people, disrupt transportation, water and sewage lines, electricity, and phone lines for 3 months to a year. Overall, this event could cause 32 billion dollars of damage. While this will be difficult to overcome, communities as a whole can take steps to get prepared. Take action now by actively planning and preparing yourself and your community to be ready for two weeks for disasters. Also, if you have a smartphone, download the ShakeAlert in Oregon application on your phone. This application is an alert system, that will alert you of the earthquake as soon as it occurs. This can provide lifesaving seconds to allow you to get to safety before shaking is felt.
Video: Shake Alert
Case Study 4: Boxing Day Tsunami and Earthquake of 2004
The December 26, 2004 magnitude (M) 9.1 Sumatra-Andaman earthquake occurred along a tectonic subduction zone in which the India Plate, an oceanic plate, is being subducted beneath the Burma micro-plate, part of the larger Sunda plate. The magnitude (M) of a submarine earthquake is, in most cases, the most important factor that determines the size of a tsunami. Because of the size and complexity of this earthquake, it has been difficult to assign a precise magnitude. A magnitude of M=9.1 seems to be most appropriate for tsunami studies as ascertained from analysis of seismograms and geodetic data (Banerjee et al., 2007; Chlieh et al., 2007).
The tsunami from the 2004 M=9.1 Sumatra-Andaman earthquake was primarily caused by vertical displacement of the seafloor, in response to slip on the inter-plate thrust fault (Figure 17.16). During the 2004 Sumatra-Andaman earthquake, the seafloor on the overriding Burma plate deformed vertically, uplifting seaward toward the trench and downdropping (subsiding) landward toward the coastline. The line in map view where offshore uplift gives way to subsidence near the coast is termed the hingeline. One, the distant tsunami, propagates outbound across the Bay of Bengal towards India and Sri Lanka, eventually reaching the Atlantic and Pacific Oceans. The other, the local tsunami, travelled towards Indonesia, Thailand, and nearby islands in less than an hour (Figure 17.17).
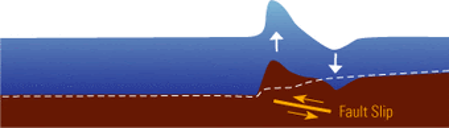
Figure 17.16 Schematic diagram of tsunami generation from an inter-plate thrust fault. Credit: USGS.
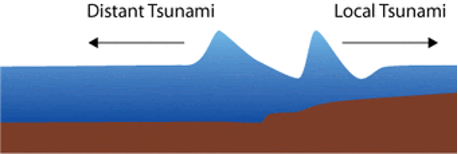
Figure 17.17 Schematic diagram of tsunami splitting, soon after generation. Credit: USGS.
The length of the fault that ruptured during this earthquake was massive, extending from northwest Sumatra north to the Andaman Islands. In tsunami models, because of its size, we have to include the time it takes for the 2004 earthquake to unzip along the fault. Like a propagating crack in a frozen lake, the rupture front for this earthquake moved at a high speed of approximately 2.5 km/s, typical for subduction zone earthquakes. It took approximately 8 minutes for the rupture front to propagte from the hypocenter to the end of its journey 1200 km away (approximately the length of California!). In tsunami models for smaller magnitude earthquakes, the displacement of the seafloor caused by an earthquake is assumed to occur instantaneously, since tsunami waves move more slowly than fault rupture. It takes approximately 8 minutes for the entire fault to break, tsunami waves generated near the epicenter have propagated part way into the Bay of Bengal by the time the earthquake has just started to generate more tsunami waves near the Andaman Islands. These waves then cross the Andaman Sea toward Thailand.
This event would easily have outstripped the ability of any coastal community or nation to be resilient to it. The building standards of many of the nations impacted by the earthquake alone, which shook the land in some cases for up to ten minutes, caused structures that were not resilient to fail dramatically. Examples of buildings that withstood both the shaking and waves can be found here. These nations did not have seawalls like Japan, so there was no barrier to incoming tsunami waves.
These waves killed over 220,000 people and travelled across the Indian Ocean all the way to east Africa, India, and Bangladesh. One of the key problems in tsunami detection in the Indian Ocean at the time was the complete absence of ocean buoys which are used to detect the presence and movement of tsunami waves. The Pacific Ocean has a complete network, while the Indian Ocean had none. If we consider the GDP of many countries impacted by the earthquake and tsunami, and the percentage of GDP that is devoted to research and development, there is quite a gap. We can also think about housing and resource availability for the citizens of these countries as a factor in the disparity in the impacts to life and property. According to the World Bank data (https://data.worldbank.org/indicator/GB.XPD.RSDV.GD.ZS) Japan spent 3.58 of its GDP on research and development in 2014, whereas Indonesia, and Thailand spent 0.08 and 0.48 in 2013 and 2014 respectively. The GDP of Japan was 5,064,872.88 in millions of dollars as of 2019, whereas the GDP of Indonesia was 1,058,423.84 in millions of dollars in 2020 and the GDP of Thailand was 501,794.96 in millions of dollars in 2020. Japan not only has a much higher GDP but as well, devotes a much larger share of its GDP to research and development than Indonesia and Thailand.
Hydrological Cycle: Rivers and Groundwater
It is no secret that you need water to survive, so needless to say hydrology is a very important part of earth science that directly affects human society. Not only do we need to consume water to survive, we also need it to feed our crops and livestock, which in turn, feeds us. Water is the most essential compound for all living things. Human babies are approximately 75% water and adults are 60% water. Our brain is about 85% water, blood and kidneys are 83% water, muscles are 76% water, and even bones are 22% water. We constantly lose water by perspiration; in temperate climates we should drink about 2 quarts of water per day and people in hot desert climates should drink up to 10 quarts of water per day. Loss of 15% of body-water usually causes death.
Earth is truly the Water Planet. The abundance of liquid water on Earth’s surface distinguishes us from other planetary bodies in the solar system. About 70% of Earth’s surface is covered by oceans and approximately half of Earth’s surface is obscured by clouds (also made of water) at any time. There is a very large volume of water on our planet, about 1.4 billion cubic kilometers (km3) (330 million cubic miles) or about 53 billion gallons per person on Earth. All of Earth’s water could cover the United States to a depth of 145 km (90 mi). From a human perspective, the problem is that over 97% of water is seawater, which is too salty to drink or use for irrigation. The most commonly used water sources are rivers and lakes, which contain less than 0.01% of the world’s water (Figure 17.18)!
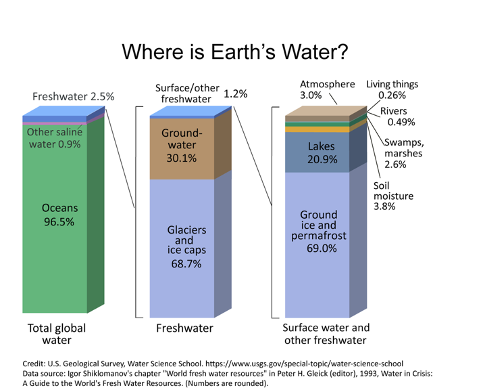
Figure 17.18 The majority of Earth’s freshwater is locked away in glaciers.
One of the most important environmental goals is to provide clean water to all people. Fortunately, water is a renewable resource and is difficult to destroy. Evaporation and precipitation combine to replenish our freshwater supply constantly; however, water availability is complicated by its uneven distribution over the Earth. Arid climate and densely populated areas have combined in many parts of the world to create water shortages, which are projected to worsen in the coming years due to population growth and climate change. Human activities such as water overuse and water pollution have significantly compounded the water crisis that exists today (Figure 17.19). Hundreds of millions of people lack access to safe drinking water, and billions of people lack access to improved sanitation as simple as a pit latrine. As a result, nearly two million people die every year from diarrheal diseases and 90% of those deaths occur among children under the age of 5. Most of these are easily prevented deaths. Needless to say, water is vital to human survival.
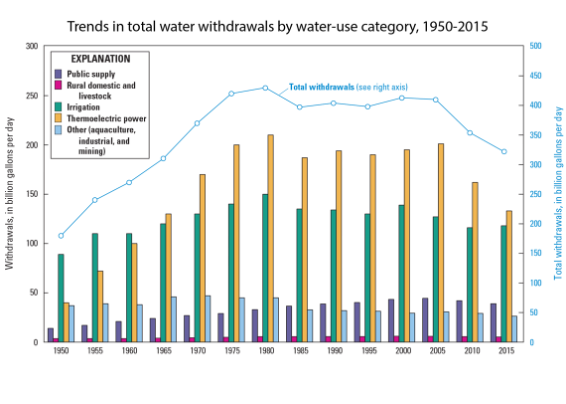
Figure 17.19 US water-use trends from 1950 to 2015. The majority of freshwater is used for thermoelectric power and irrigation. Credit: USGS, public domain
Humans and Weather
Every day weather on this planet impacts human lives. These impacts can come in the form of storms with wind, flooding, lightning, hail, snow, that they can produce; or it can come in the form of periods of extreme cold or heat. Humans depend on climates and the weather types that occur in various climates for access to water for drinking and agriculture. Changes to weather patterns that occur in a region can have impacts on many aspects of human life.
Droughts
As of June, 2021, the National Oceanic and Atmospheric Administration had the below data regarding the water condition in North America.
- Based on the Palmer Drought Index, severe to extreme drought affected about 36% of the contiguous United States as of the end of June 2021, an increase of about 8% from last month. About 4% of the contiguous U.S. fell in the severely to extremely wet categories.
- About 47% of the contiguous U.S. fell in the moderate to extreme drought categories (based on the Palmer Drought Index) at the end of June
- On a broad scale, the 1980s and 1990s were characterized by unusual wetness with short periods of extensive droughts, the 1930s and 1950s were characterized by prolonged periods of extensive droughts with little wetness, and the first two decades of the 2000s saw extensive drought and extensive wetness (moderate to extreme drought graphic, severe to extreme drought graphic).
The extreme drought conditions on going as of September 2021, impact agricultural productivity for food because high temperatures increase evaporation rates, which dries out soils that agriculture depends on to produce food for humans. Lower productivity in places like North and South Dakota, and California is likely as a result of these ongoing drought conditions.
Extreme Heat Events
Extreme temperatures can be hazardous to humans in a number of ways. Dehydration can happen quickly in extreme temperatures and can lead to heat exhaustion and heat stroke. The Centers for Disease Control and Prevention provides the below data on the impacts on extreme heat events:
Extreme heat events have long threatened public health in the United States. Many cities, including St. Louis, Philadelphia, Chicago, and Cincinnati, have suffered dramatic increases in death rates during heat waves. Deaths result from heat stroke and related conditions, but also from cardiovascular disease, respiratory disease, and cerebrovascular disease. Heat waves are also associated with increased hospital admissions for cardiovascular, kidney, and respiratory disorders. Extreme summer heat is increasing in the United States, and climate projections indicate that extreme heat events will be more frequent and intense in coming decades.
Some heat-related illness and death risks have diminished in recent decades, possibly due to better forecasting, heat-health early warning systems, and/or increased access to air conditioning for the U.S. population. However, extreme heat events remain a cause of preventable death nationwide. Urban heat islands, combined with an aging population and increased urbanization, are projected to increase the vulnerability of urban populations to heat-related health impacts in the future.
Wildfires
With increasing temperatures, the “fuel” that feeds forest fires (underbrush) becomes increasingly dried out and prone to burning. Lightning strikes from storms and arson may start a wildfire, but the abundance of extremely dry vegetation allows a fire to spread more rapidly than it would in a non-drought environment. High winds can hamper wildfire containment, and in many cases, as we have seen in the news over the past decade, the only option for survival is to get out of the way of a wildfire. The cost of some of the largest wildfires ever seen in the United States is quite substantial. According to the Federal Emergency Management Agency, the 2020 wildfires in Western North American cost an estimated 17.1 billion dollars and 46 lives alone . Developing wildfire resilient communities, thinning forests (Proceedings of the Second International Symposium on Fire Economics, Planning, and Policy: A Global View), and reducing the underbrush concentration in an area are all reasonable approaches to help communities be better able to withstand wildfire events.
Tornadoes
Weather impacts you depending on where you live. In the Western United States, drought and wildfires have been the most impactful. In other regions of the country, other weather impacts are felt. In the midwest, tornadoes are common, in some places, more than in others.

Exactly how and why tornadoes form is not completely understood. What is known is that most result from supercell thunderstorms. These severe thunderstorms have persistent updrafts that can reach speeds of 100 mph. Within the storm, a strong vertical wind shear causes a horizontally rotating cylinder of air. The updraft lifts the rotating cylinder within the supercell. The rotating cylinder of air narrows, becoming stretched, and spins faster and faster forming a tornado. The rotation within the thunderstorm gives the supercell its classic “hook” appearance which can be seen on radar.
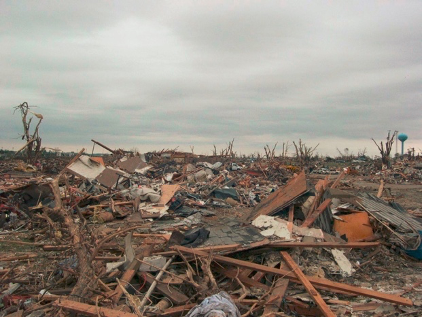
Figure 17.21 Mass devastation in Parkersburg, Iowa from an EF5 tornado on May 25, 2008. These natural hazards have significant impacts on human activities and communities. Credit: National Weather Service, public domain.
Each year, about 56 people are killed by tornadoes. However, the spring of 2011 was one of the deadliest and costliest tornado seasons on record. Between April and June 2011 tornadoes killed more than 580 people and caused over $21 billion dollars in economic damages. The high death toll was partly a result of the tornadoes traveling rapidly through heavily populated areas, a lack of adequate storm shelters and individuals who did not quickly seek shelter.
Multiple methods are used to reduce the risks from these natural disasters but preparation is still the key element of survival. Your first line of defense is to be weather-wise by being aware of weather forecasts, warnings and watches. Plan ahead, thinking of where you can seek shelter should a tornado approach. For generations, families in regions with significant numbers of tornadoes have built storm cellars where they can take shelter if a tornado occurs. New construction techniques are being developed to make buildings more resistant to strong winds but most people still live in homes which offer limited protection. The addition of self-contained “safe rooms” to these buildings has saved multiple lives.
Since the first tornado forecast rules were established in 1884 tornado research has continued to advance. With the development and use of sophisticated observations, technical equipment, data analysis and computer modeling the National Weather Service and others seek to improve our understanding of the causes of these storms. Warning systems are continually being evaluated and improved to utilize new research findings and technologies.
Climate Change
As discussed in Chapter 16, and above in Weather, temperatures will kept rising and cause shifts in our climate belts, ocean and atmospheric circulation and generate more serve weather. Climate change is something that will affect not only humans, but everything living on this planet. Although the climate has changed multiple times in the past naturally, this current change is solely caused by humans. We are responsible for the warming of our planet and the consequences that it creates. Anthropogenic greenhouse gases have already warmed the planet significantly and it will continue to rise as long as we burn fossil fuels. Climate change will affect everyone differently, but in Oregon; snowfall and precipitation will decrease – which will diminish the water supply, sea-level rise will inundate coastal communities, and the Oregon’s two biggest industries, fishing and logging will take an economic hit from increases wildfires, insect pests, tree diseases, ocean acidification and hypoxia.
Although difficult, we can predict possible future consequences of climate change and learn to adapt and change. We have to change our behaviors, this will be hard, and it is made even harder due to the political and economic nature of discussing climate change. According to NASA, a leader in climate change science, the collapse of most civilizations throughout history was due to climate change and their inability to adapt. Since this is a global issue, the world needs to fix this together, but that is easier said than done. NASA states, without national or international climate policy, it will be up to state governments and cities to be the frontline of adaptation. We need to change our behaviors, such as, look for sustainable products and resources, limit greenhouse gas emissions and turn to renewable energy, conserve freshwater, minimize waste and pollution, increase recycling, create sustainable infrastructure, consume less red meat, and vote in all government level elections. As preachy as this all sounds, climate change is the biggest threat humans have ever faced and it is up to us to protect the future of our species. If you would like more information, please visit NASA Climate Change webpage.
Video: Global warming since the industrial revolution.
Licenses and Attributions
Becoming a Better Citizen through Science
“Introduction to Earth Science” by CK12.org is licensed under CC BY-NC: Attribution-NonCommercial Adaptation: Modified, Renumbering, Remixing
https://www.ck12.org/book/ck-12-earth-science-concepts-for-high-school/section/1.0/
Humans and Astronomy:
“Astronomy” by OpenStax is licensed under :CC BY: Attribution.
Adaptation: Modified, Renumbering, Remixing
http://cnx.org/contents/2e737be8-ea65-48c3-aa0a-9f35b4c6a966@10.1.
“The Tunguska Explosion could have been caused by an Asteroid that still Orbits the Sun” by Brain Koberlein is licensed under :CC BY: Attribution.
Adaptation: Modified, Renumbering, Remixing
“Fire in the Sky” by Brain Koberlein is licensed under :CC BY-NC: Attribution-NonCommercial.
Adaptation: Modified, Renumbering, Remixing
https://briankoberlein.com/blog/fire-in-the-sky/
“Space Weather” by Ready.gov is licensed under: Public Domain.
Adaptation: Modified, Renumbering, Remixing
https://www.ready.gov/space-weather
Humans and Rocks
“Historical Geology” by Open Geology, Callan Bentley, Karen Layou, Russ Kohrs, Shelley Jaye, Matt Affolter, and Brian Ricketts (in progress). License: CC-BY-NC
Adaptation: Modified, Renumbering, Remixing
https://opengeology.org/historicalgeology/
Humans and Plate Tectonics
“Renewable Energy and Challenges and Impacts of Energy Use from Environmental Biology by Matthew R. Fisher” Modified by Melissa Ha. License: CC-BY
Adaptation: Modified, Renumbering, Remixing
https://bio.libretexts.org/Bookshelves/Ecology/Environmental_Science/05%3A_Energy/5.03%3A_Renewable_Energy/5.3.04%3A_Geothermal_Energy
Humans and Earthquakes
“A short history of Japanese historical seismology: past and the present.” by Ritsuko Matsu’ura. License: CC-BY
Adaptation: Modified, Renumbering, Remixing
“Honshu Earthquake, 2011” by NOAA. License: Public Domain.
Adaptation: Modified, Renumbering, Remixing
https://www.ncei.noaa.gov/news/day-2011-japan-earthquake-and-tsunami
“Cascadia Subduction Zone” by Oregon.gov. License: Public Domain.
Adaptation: Modified, Renumbering, Remixing
https://www.oregon.gov/oem/hazardsprep/Pages/Cascadia-Subduction-Zone.aspx
“Boxing Day Tsunami and Earthquake of 2004” by USGS. License: Public Domain.
Adaptation: Modified, Renumbering, Remixing
Humans and the Hydrological Cycle: Rivers and Groundwater
“Environmental Geology” edited and co-authored by Matthew R. Fisher (original by Kamala Doršner) is licensed under CC BY 4.0 Adaptation: Modified, Renumbering, Remixing
https://openoregon.pressbooks.pub/envirobiology/chapter/7-1-water-cycle-and-fresh-water-supply/
Humans and Weather
Physical Geology – 2nd Edition by Steven Earle is licensed under CC BY 4.0
Adaptations: Renumbering, Remixing
https://opentextbc.ca/physicalgeology2ed/chapter/19-3-implications-of-climate-change/
“Tornadoes” by NOAA is licensed under: Public Domain.
Adaptation: Modified, Renumbering, Remixing
https://www.noaa.gov/education/resource-collections/weather-atmosphere/tornadoes
“Drought Conditions in 2021” by NOAA. License: Public Domain.
Adaptation: Modified, Renumbering, Remixing
https://www.ncdc.noaa.gov/sotc/drought/202106.
“Temperature Extremes” by CDC is licensed under: Public Domain.
Adaptation: Modified, Renumbering, Remixing
https://www.cdc.gov/climateandhealth/effects/temperature_extremes.htm
“Billion-Dollar Weather and Climate Disasters: Events” by NOAA is licensed under: Public Domain.
Adaptation: Modified, Renumbering, Remixing
