
Chapter 13 Answers
Review Question Answers:
- The size of waves are determined by the wind velocity, the length of time the wind blows in the approximately the same direction, and the area of water over which it blows.
- Table 13.1 provides data for 56 and 74 kilometres an hour winds, and 65 kilometres an hour is half way between these two values. The listed values for duration and fetch are high enough for the sea to fully develop, so the simple answer would be that the wave amplitude and wavelength would also be approximately half way between the listed values: amplitude around 6 meters, wavelength around 106 meters.
- Waves will start to feel” the bottom at around 50% of the wavelength, so at a 50 meter depth in this case. This will slow the waves down and also cause their amplitude to increase.
- A longshore current is the movement of water parallel to the shore in the surface zone caused by waves approaching at an angle. Longshore drift is the movement of sediment parallel to the shoreline, caused partly by the longshore current and also by swash and backwash on the beach.
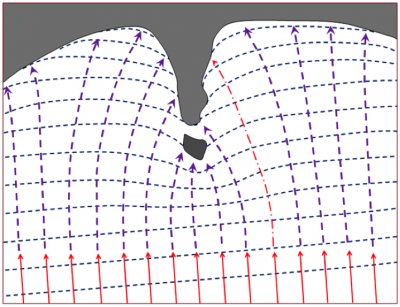
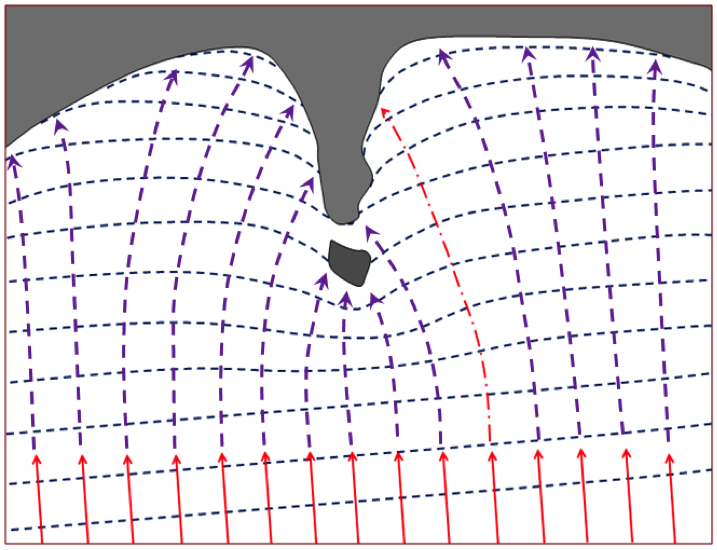
- Wave energy is focused on the headland, with more wave energy vectors per length of coast than in the bays, and thus the headland is eroding faster than the bays on either side, leading to coastal straightening.
- Rocky coasts are eroded by waves and that erosion is greatest within the surface zone. As stacks and arches are eventually eroded away, a wave-cut platform is left.
- The beach face is the relatively steep area of the beach between the low and high tide levels. This is also known as the foreshore or swash zone.
- A spit can form where there is longshore drift and the geometry of the shoreline is such that a sand bar extends away from the shore.
- The area of the Atlantic coast north of Massachusetts (including New Hampshire, Maine, New Brunswick, Nova Scotia, and Newfoundland plus all of the area inland) was glaciated during the Pleistocene and has since rebounded isostatically. This is all now relatively young rocky coast that is being actively eroded.
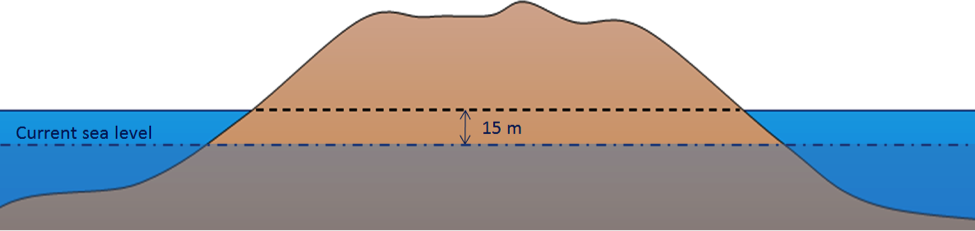
- There has been approximately 125 meters of eustatic sea-level rise since the last deglaciation, so the current sea level should be approximately 140 – 125 = 15 meters lower than it was during glaciation. The dash-dot line marks present-day sea level. An uplifted coast like this should have uplifted wave-cut terraces and coastal waterfalls.

- Sediments would be trapped in the reservoir behind such a dam, and the water flowing through the dam would be sediment-free. Although there would be erosion of new sediments downstream from the dam, the water reaching the ocean at Richmond would have less sediment than it does now. This is likely to result in the beaches around Vancouver being starved of sediment, and they would gradually get smaller.
Exercise Answers:
Exercise 13.1 Wave height versus length
This table shows the typical amplitudes and wavelengths of waves generated under different wind conditions. The steepness of a wave can be determined from these numbers and is related to the ratio: amplitude/wavelength.
- Calculate these ratios for the waves shown.
- How would these ratios change with increasing distance from the wind that produced the waves?
Amplitude (meters) Wavelength (meters) Ratio (amplitude/wavelength) 0.27 8.5 0.03 1.5 33.8 0.04 4.1 76.5 0.05 8.5 136 0.06 14.8 212 0.07 Within increasing distance from the source the wave heights would gradually decrease and so the ratios would decrease.
Exercise 13.2 Wave refraction
![[SE]](https://opentextbc.ca/physicalgeology2ed/wp-content/uploads/sites/298/2019/08/ex17-2-300x144.png)
[Image by Steven Earle] Exercise 13.3 Beach forms
Barrier islands could from if this was a low-relief coast with an abundant supply of sediment from large rivers.
![Possible locations of coastal deposits [SE]](https://opentextbc.ca/physicalgeology2ed/wp-content/uploads/sites/298/2019/08/ex17-3-300x201.png)
Possible locations of coastal deposits [Image by Steven Earle] Exercise 13.4 A Holocene uplifted shore
The melting of glacial ice around the world at the end of the last glaciation (between 14 and 8 ka – see Figure 17.25) led to relatively rapid sea-level rise (by a total of approximately 125 m) which resulted in this area being submerged. That was a eustatic process. In response to the loss of ice in this region of coastal British Columbia there was a slower isostatic rebound of the crust, which is why this area is now back up above sea level.
Exercise 13.5 Crescent Beach groynes
![[SE]](https://opentextbc.ca/physicalgeology2ed/wp-content/uploads/sites/298/2019/08/ex17-5-300x124.png)
[Image by Steven Earle] Licenses and Attributions
“Physical Geology – 2nd Edition” by Steven Earle is licensed under CC BY 4.0 Adaptation: Renumbering, Remixing
![[SE]](https://opentextbc.ca/physicalgeologyearle/wp-content/uploads/sites/145/2016/07/ex17-2.png)
![Possible locations of coastal deposits [SE]](https://opentextbc.ca/physicalgeologyearle/wp-content/uploads/sites/145/2016/07/ex17-3.png)
![[SE]](https://opentextbc.ca/physicalgeologyearle/wp-content/uploads/sites/145/2016/07/ex17-5.png)
