
Chapter 16 Answers
Review Questions Answers:
- The greenhouse gases (GHG) vibrate at frequencies that are similar to those of infrared (IR) radiation. When IR radiation impinges on a GHG molecule, the molecule’s vibrational energy is enhanced and the radiation energy is converted into heat, which is trapped within the atmosphere.
- The combustion of fossil fuels releases CO2 that was previously stored in the crust. The resulting increase in atmospheric CO2 leads to a temperature increase. As the temperature increases, the solubility of CO2 in the ocean decreases and additional CO2 is released by the ocean, resulting in even higher atmospheric CO2 levels and higher temperatures.
- Gondwana was situated over the South Pole for much of the Paleozoic and became glaciated during the Ordovician (Andean-Saharan Glaciation) and again during the Permian (Karoo Glaciation). These glaciations cooled the entire planet during these periods.
- From a climate perspective, the two important volcanic gases are SO2 and CO2. SO2 is converted to sulfate aerosols which block sunlight and can lead to short-term cooling (years). CO2 can lead to warming, but only in situations where there is an elevated level of volcanism over at least thousands of years.
- We use 65° for estimating the glaciation potential of orbital variations because glaciers are most likely to form at high latitudes. We use 65° N rather than 65° S because for more than 50 million years the continents have been concentrated in the northern hemisphere. We use July instead of January because for glaciers to grow it’s more important to have cool summers than cold winters.
- If the major currents in the oceans were to slow down or stop, the tropics would get hotter and the high-latitude areas would get colder, leading to expansion of glaciers and sea ice. The various feedbacks (e.g., higher albedo because of increased ice cover) would result in an overall cooler climate.
- The main climate implication of the melting and breakdown of permafrost is that carbon that was trapped in the frozen ground will be released and then converted to CO2 and CH4, leading to more warming.
- Sea-floor methane hydrates are stable because the deep ocean water is cold. In order for the hydrates to become unstable, warmth from the upper layers of the ocean has to be transferred to depth.
- A significant part of our GHG emissions take place during because of the (formerly) intentional and (presently) unavoidable release of natural gas (CH4) during the extraction of oil and gas. Some is lost during transportation — for example when pipelines leak — and some is consumed during transportation — for example to pressurize pipelines or to power tanker trains. GHG’s are also leaked to the atmosphere during the routine refueling and operation of motor vehicles.
- The rise of sea level results from a combination of melting glaciers and thermal expansion of the ocean water. Both of these large systems are slow to respond to the warming climate. For example it takes a long time for warm surface water to be transferred to depth in the ocean or for heat to be transferred to depth in a glacier. Even if we stabilized the GHG levels in the atmosphere today, the climate would continue to warm for approximately another 100 years, and sea level would continue to rise for much longer than that.
- West Nile virus is carried by birds and is transmitted to humans by certain species of mosquitoes. The range and abundance of those mosquitoes is partly controlled by climate change, especially by warm winters. Sufficiently warm winters are increasingly common in the northern United States and southern Canada.
Exercise Answers:
Exercise 16.1 Climate Change at the K-Pg Boundary
The short-term climate impact was significant cooling because the dust (and sulphate aerosols) would have blocked incoming sunlight. This effect may have lasted for several years, but its intensity would have decreased over time.
The longer-term impact would have been warming caused by the greenhouse effect of the carbon dioxide.
Exercise 16.2 Albedo Implications of Forest Harvesting
Clear-cutting (or any logging activity) leads to a net increase in albedo, so the albedo-only impact is cooling.
Exercise 16.3 What Does Radiative Forcing Tell Us?
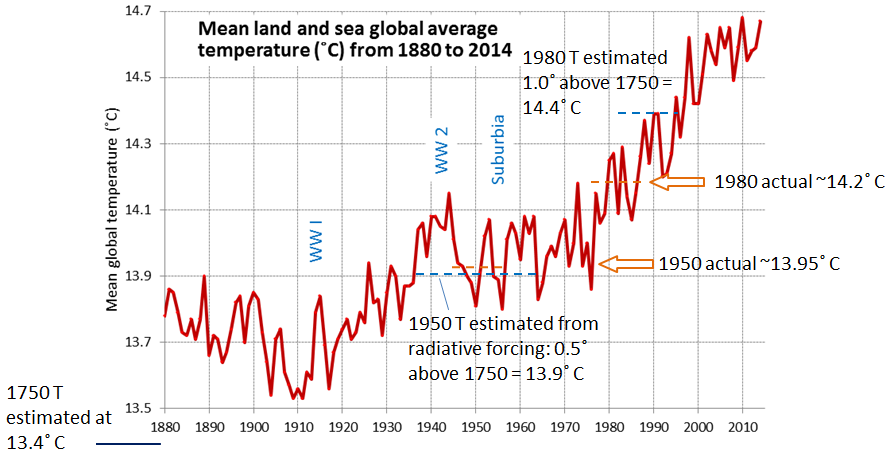
Using the ΔT = ΔF * 0.8 equation the expected temperatures for 2011, 1980 and 1950 compared with the estimated 13.4 C in 1750 should be:
2011 vs 1750 ΔT = 0.8 * 2.29 = 1.8°C (13.4 + 1.8 = 15.2)
1980 vs 1750 ΔT = 0.8 * 1.25 = 1.0°C (13.4 + 1.0 = 14.4)
1950 vs 1750 ΔT = 0.8 * 0.57 = 0.5°C (13.4 + 0.5 = 13.9)

[SE from data at NASA at: http://data.giss.nasa.gov/gistemp/tabledata_v3/GLB.Ts+dSST.txt] Based on this reasoning the estimated temperature for 1950 is13.9˚ C (which is close to the actual of 14.0 ˚ C), while that for 1980 is 14.4˚ C, which is well above the actual of 14.2˚ C. It’s also clear that we didn’t reach 15.2˚ C by 2011, because even in the hottest year so far (2015) the global average temperature was only 14.8˚ C.
So while the ΔT = ΔF * 0.8 equation is useful, it appears to overestimate the temperature, probably because it takes some time (years to decades) for the climate to catch up to the forcing.
Exercise 16.4 Rainfall and ENSO
Describe the relationship between ENSO and precipitation in B.C.’s southern interior.
As shown on the diagram below, there are some examples where a strong ENSO signal corresponds with very strong precipitation in the interior (and on the coast as well). The two strongest El Niños (1983 and 1998) shown correspond with the highest recorded precipitation levels in Penticton. Some other strong El Niños (1958 and 1973) are associated with strong precipitation within 6 months of the ENSO peak, but others show a negative correlation between ENSO and rainfall (marked with “?”).
![[SE using climate data from Environment Canada, and ENSO data from: http://www.esrl.noaa.gov/psd/enso/mei/table.html]](https://opentextbc.ca/physicalgeology2ed/wp-content/uploads/sites/298/2019/08/ex19-4-300x153.png)
[SE using climate data from Environment Canada, and ENSO data from: http://www.esrl.noaa.gov/psd/enso/mei/table.html] Exercise 16.5 How Can You Reduce Your Impact on the Climate?
Responses will vary.
Licenses and Attributions
“Physical Geology – 2nd Edition” by Steven Earle is licensed under CC BY 4.0 Adaptation: Renumbering, Remixing
![[SE using climate data from Environment Canada, and ENSO data from: http://www.esrl.noaa.gov/psd/enso/mei/table.html]](https://opentextbc.ca/physicalgeologyearle/wp-content/uploads/sites/145/2016/07/ex19-4.png)
