9.1 What is an Earthquake?
Earthquake Shaking Comes from Elastic Deformation
Earthquakes occur when rock ruptures (breaks), causing rocks on one side of a fault to move relative to the rocks on the other side. Although motion along a fault is part of what happens when an earthquake occurs, rocks grinding past each other is not what creates the shaking. In fact, it could be said that the earthquake happens after rocks have undergone most of the displacement. Consider this: if rocks slide a few centimeters or even meters along a fault, would that motion alone explain the incredible damage caused by some earthquakes? If you were in a car that suddenly accelerated then stopped, you would feel a jolt. But earthquakes are not a single jolt. Buildings can swing back and forth until they shake themselves to pieces, train tracks can buckle and twist into s-shapes, and roads can roll up and down like waves on the ocean. During an earthquake, rock is not only slipping. It is also vibrating like a plucked guitar string.
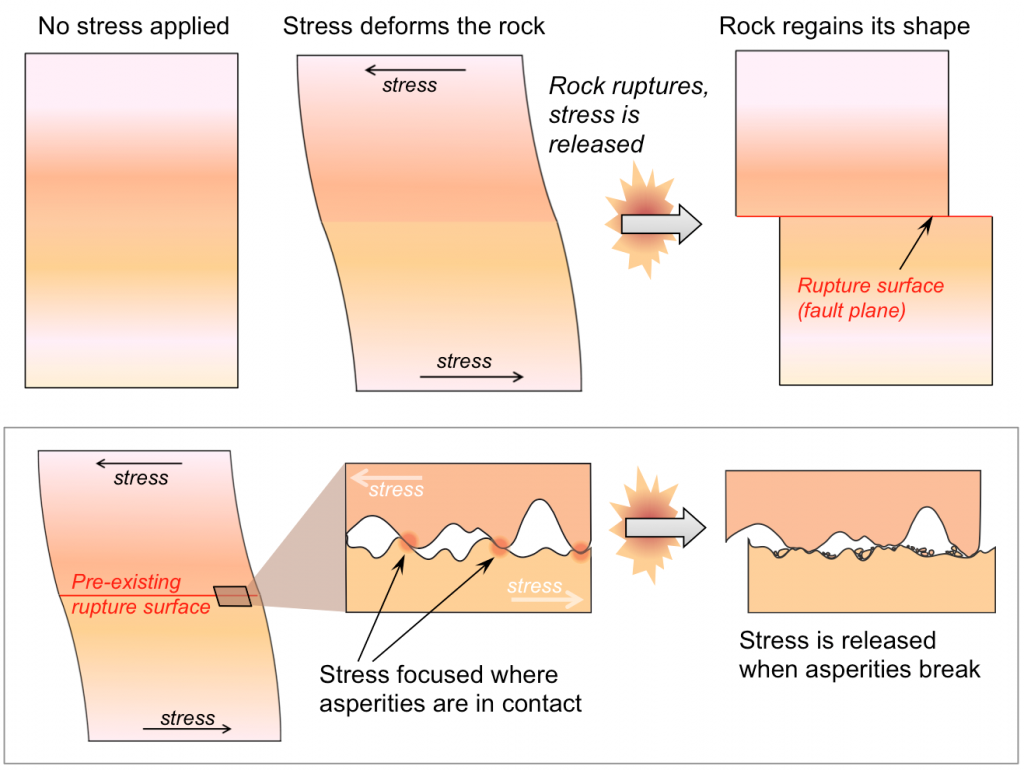
Rocks might seem rigid, but when stress is applied they may stretch. If there hasn’t been too much stretching, a rock will snap back to its original shape once the stress is removed. Deformation that is reversible is called elastic deformation. Rocks that are stressed beyond their ability to stretch can rupture, allowing the rest of the rock to snap back to its original shape. The snapping back of the rock returning to its original shape causes the rock to vibrate, and this is what causes the shaking during an earthquake. The snapping back is called elastic rebound.
Figure 9.3 (top) shows this sequence of events. Stress is applied to a rock and deforms it. The deformed rock ruptures, forming a fault. After rupturing, the rock above and below the fault snaps back to the shape it had before deformation.

Ruptures can also occur along pre-existing faults (Figure 9.3, bottom). The rocks on either side of the fault are locked together because bumps along the fault, called asperities, prevent the rocks from moving relative to each other. When the stress is great enough to break the asperities, the rocks on either side of the fault can slide again. While the rocks are locked together, stress can cause elastic deformation. When asperities break and release the stress, the rocks undergo elastic rebound and return to their original shape.
Rupture Surfaces Are Where the Action Happens
Images like 9.3 are useful for illustrating elastic deformation and rupture, but they can be misleading. The rupture that happens doesn’t occur as in 9.3, with the block being ruptured through and through. The rupture and displacement only happen along a subsection of a fault, called the rupture surface. In Figure 9.4, the rupture surface is the dark pink patch. It takes up only a part of the fault plane (lighter pink). The fault plane represents the surface where the fault exists, and where ruptures have happened in the past. Although the fault plane is drawn as being flat in Figure 9.4, faults are not actually perfectly flat.
The location on the fault plane where the rupture happens is called the hypocenter or focus of the earthquake (Figure 9.4, right). The location on Earth’s surface immediately above the hypocenter is the epicenter of the earthquake.

Within the rupture surface, the amount of displacement varies. In Figure 9.4, the larger arrows indicate where there has been more displacement, and the smaller arrows where there has been less. Beyond the edge of the rupture surface there is no displacement at all. Notice that this particular rupture surface doesn’t even extend to the land surface of the diagram.
The size of a rupture surface and the amount of displacement along it will depend on a number of factors, including the type and strength of the rock, and the degree to which the rock was stressed beforehand. The magnitude of an earthquake will depend on the size of the rupture surface and the amount of displacement.
A rupture doesn’t occur all at once along a rupture surface. It starts at a single point and spreads rapidly from there. Figure 9.4 illustrates a case where rupturing starts at the heavy blue arrow in the middle, then continues through the lighter blue arrows. The rupture spreads to the left side (green arrows), then the right (yellow arrows).
Depending on the extent of the rupture surface, the propagation of failures (incremental ruptures contributing to making the final rupture surface) from the point of initiation is typically completed within seconds to several tens of seconds. The initiation point isn’t necessarily in the center of the rupture surface; it may be close to one end, near the top, or near the bottom.
Shifting Stress Causes Foreshocks and Aftershocks
Earthquakes don’t usually occur in isolation. There is often a sequence in which smaller earthquakes occur prior to a larger one, and then progressively smaller earthquakes occur after. The largest earthquake in the series is the mainshock. The smaller ones that come before are foreshocks, and the smaller ones that come after are aftershocks. These descriptions are relative, so it can be necessary to reclassify an earthquake. For example, the strongest earthquake in a series is classified as the mainshock, but if another even bigger one comes after it, the bigger one is called the mainshock, and the earlier one is reclassified as an aftershock.
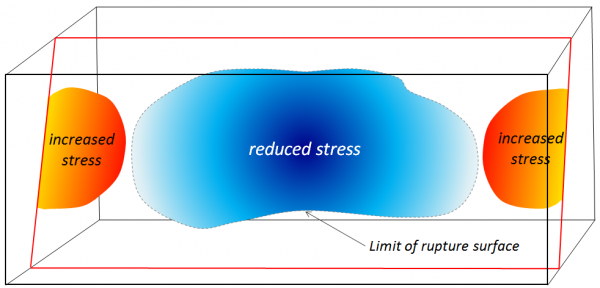
A rupture surface does not fail all at once. A rupture in one place leads to another, which leads to another. Aftershocks and foreshocks represent the same thing, except on a much larger scale. The rupture illustrated in Figure 9.4 reduced stress in one area, but in doing so, transferred stress to others (Figure 9.5). Imagine a frayed rope breaking strand by strand. When a strand breaks, the tension on that strand is released, but the remaining strands must still hold up the same amount of weight. If another strand breaks under the increased burden, the remaining strands have an even greater burden than before. In the same way that the stress causes one strand after another to fail, a rupture can trigger subsequent ruptures nearby.

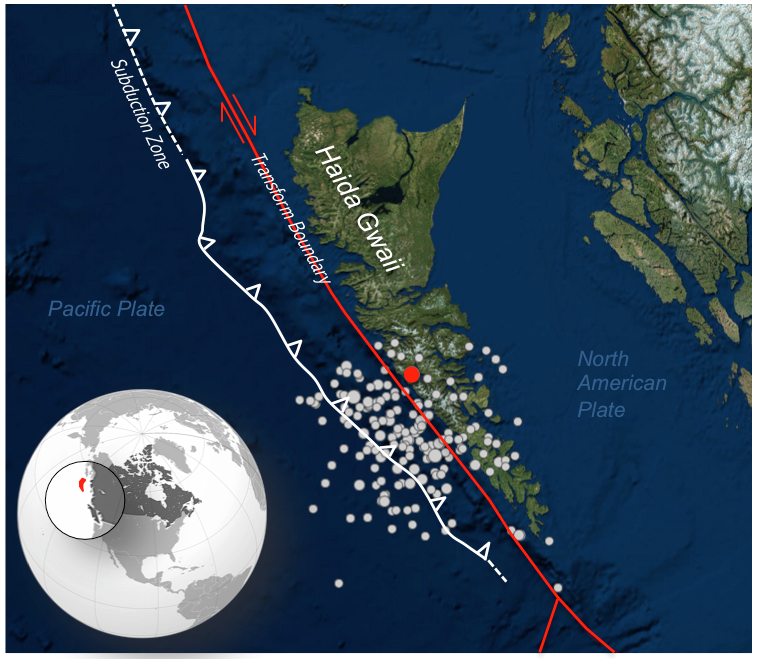
Numerous aftershocks were associated with the magnitude 7.8 earthquake that struck Haida Gwaii, B.C., in October of 2012 (Figure 9.6; mainshock in red, aftershocks in white). Some of the stress released by the mainshock was transferred to other nearby parts of the fault, and contributed to a cascade of smaller ruptures. But stress transfer need not be restricted to the fault along which an earthquake happened. It will affect the rocks in general around the site of the earthquake and may lead to increased stress on other faults in the region. The aftershocks from the Haida Gwaii earthquake are scattered rather than located only on the main faults.

The effects of stress transfer may not show immediately. Aftershocks can be delayed for hours, days, weeks, or even years. Because stress transfer affects a region, not just a single fault, and because there can be delays between the event that transferred stress and the one that was triggered by the transfer, it can sometimes be hard to be know whether one earthquake is actually associated with another, and whether a foreshock or aftershock should be assigned to a particular mainshock.
Episodic Tremor and Slip
Episodic tremor and slip (ETS) is periodic slow sliding along part of a subduction boundary. It does not produce recognizable earthquakes, but does produce seismic tremor (observed as rapid seismic vibrations on instruments). It was first discovered on the Vancouver Island part of the Cascadia subduction zone by Geological Survey of Canada geologists Herb Dragert and Gary Rogers.[1]
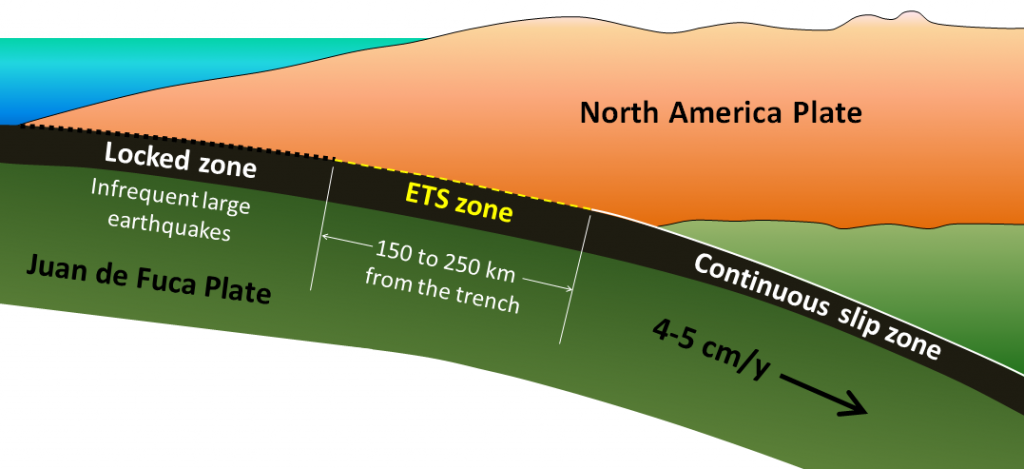
The boundary between the subducting Juan de Fuca plate and the North America plate can be divided into three segments (Figure 9.7). The cold upper part of the boundary is the locked zone. There the plates are stuck together for long periods of time. When slip does occur, it generates very large earthquakes. The last time the locked zone along Canada’s west coast slipped was January 26, 1700. It caused an earthquake of magnitude 9. The warm lower part of the boundary, called the continuous slip zone, is sliding continuously because the warm rock is weaker. The central part of the boundary, the ETS zone, isn’t cold enough to be stuck, but isn’t warm enough to slide continuously. Instead it slips episodically approximately every 14 months for about 2 weeks, moving a few centimeters each time.

It might seem that periodic slip along this part of the plate helps to reduce tension, and thus reduce the risk of a large earthquake. In fact, the opposite is likely the case. The movement along the ETS part of the plate boundary transfers stress to the adjacent locked part of the plate. During the two-week ETS period, the transfer of stress means an increased chance of a large earthquake.
Since 2003, ETS processes have also been observed in subduction zones in Mexico and Japan.
Video: Earth Rocks – Earthquakes
Additional Resources
IRIS Teachable Moment slides for the October 2012 Haida Gwaii earthquake
References
Wang, K., Jiangheng, H., Schulzeck, F., Hyndman, R. D., and Riedel, M. (2015). Thermal Condition of the 27 October 2012 Mw 7.8 Haida Gwaii Subduction Earthquake at the Obliquely Convergent Queen Charlotte Margin. Bulletin of the Seismological Society of America, 105(2B), 1290–1300. doi: 10.1785/0120140183
Licenses and Attributions
“Physical Geology, First University of Saskatchewan Edition” by Karla Panchuk is licensed under CC BY-NC-SA 4.0 Adaptation: Renumbering, Remixing
- Rogers, G. and Dragert, H. (2003). Episodic tremor and slip on the Cascadia subduction zone: The chatter of silent slip. Science, 300, 1942-1943. ↵

