3.3 Measuring Global Stratification
What does global inequality look like? Today, despite the many initiatives to address it, there is an extreme difference between the wealthiest and poorest nations. There are a number of ways that social scientists measure this stratification, economically as well as with other indicators of wellbeing.
3.3.1 Economic Measures Between Countries
One way to measure these comparisons is by looking at the income earned by a nation’s population in a year. Income is considered a household’s disposable income consisting of earnings, self-employment and capital income. Forty percent of the world’s population, or about 2 billion people, live on less than $2 per day (United Nations Development Programme, 2005).
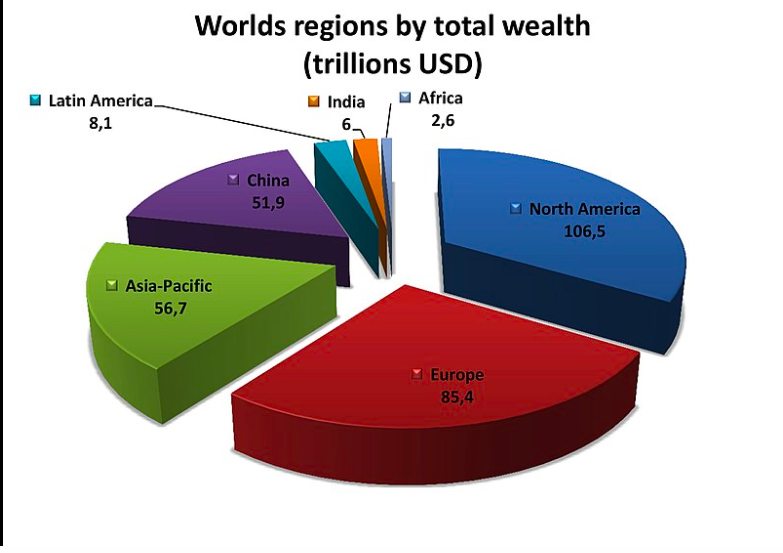
We can also measure global stratification by wealth. In the study of stratification, wealth refers to financial assets or physical possessions which can be converted into a form that can be used for transactions. Figure 3.5 shows the world’s regions by their total wealth in 2018.

Figure 3.5. World regions by total wealth (in trillions USD), 2018.
GDP, GNP, GNI
Three other economic measures often used to compare economic inequality between countries are gross national income (GNI), gross domestic product (GDP), and gross national product (GNP):
- Gross national income (GNI) per capita is the total amount of money earned by a nation’s people and businesses. It is used to measure and track a nation’s wealth from year to year.
- Calculations of a country’s GNI include the income it receives from overseas sources as well as its gross domestic product (GDP), or the total value of all goods and services produced by a nation’s citizens within its borders. Because costs of goods and services vary from one country to the next, this number is compared with the relative power a country has to purchase those same goods and services.
- Similar to GDP, gross national product (GNP) is the total value of goods and services produced by a country no matter the location of the earners.
GNP and GDP are used to gain insight into global stratification based on a country’s standard of living. According to this analysis, a GDP standard of a middle-income nation represents a global average. In low-income countries, most people are poor relative to people in other countries. Citizens have little access to amenities such as electricity, plumbing, and clean water. People in low-income countries are not guaranteed education, and many are illiterate. The life expectancy of citizens is lower than in high-income countries. Therefore, the different expectations in lifestyle and access to resources varies.
Since its conceptual development in the 1940s, GDP has been criticized for its many limitations: it is blind to environmental degradation, it poorly captures variations in human well-being, and ignores inequality.
3.3.2 Economic Measures Within Countries
One straightforward method of comparing economic inequality within countries is to use the 90/10 income inequality ratio: the wage or salary income earned by individuals at the 90th percentile (those earning more than 90 percent of other workers) compared to the earnings of workers at the 10th percentile (those earning higher than the bottom 10 percent). This method does not always provide a full picture of income inequality (it literally leaves out the middle), but it can certainly provide insight. For example, a 90/10 ratio of five means that the richest 10% of the population earn five times more than the poorest 10%.
Another measure of internal inequality is the Gini Coefficient. A country in which every resident has the same income would have a Gini coefficient of 0 (or 0 percent). A country in which one resident earned all the income, while everyone else earned nothing, would have an income Gini coefficient of 1 (or 100 percent). Thus, the higher the number (the closer to that one person having all the income or wealth), the more inequality there is.
3.3.3 The Classification of Countries
Social scientists have devised a number of ways to categorize countries based on both types of inequality. These classification methods can be important in understanding economic differences among countries, and identify trends in other areas. However, it’s important to look critically at the ideology that supports those categorizations.
A major concern when discussing global classifications is how to avoid an ethnocentric bias in the language we use to describe economic differences among countries. Social scientists must take care in how we delineate different countries. The classifications that social scientists have used in the past originated from the perspective of colonizing nations. Over time, these terms have shifted to make way for more inclusive language. The following sections will describe these changes in more detail.
3.3.3.1 First, Second and Third Worlds
“First World,” “Second World,” and “Third World” is one of the first typologies for the classification of countries. It came into use after World War II to distinguish between capitalist democracies, communist nations belonging to the Soviet Union, and all the remaining nations. This classification was primarily a political one, rather than a way to identify countries based on economic stratification.
Eventually, First and Third world became related to economic development and standards of living. Capitalistic democracies such as the United States and Japan were considered part of the First World and included most of sub-Saharan Africa, Latin America, and Asia. The Second World was the in-between category: nations not as limited in development as the Third World, but not as well off as the First World, having moderate economies and standard of living, such as China or Cuba.
While still used by many people, First, Second, and Third world terminology has grown out of favor as it connotes a sense of superiority and inferiority. It also fails to acknowledge the role that colonization has played in determining economic and social inequality between nations.
Watch this 2.5-minute Al Jazeera video, “How The Term ‘Third World’ Is An Outdated Term” for a good explanation of the issues with the term Third World (figure 3.6):
Figure 3.6. How The Term ‘Third World’ Is An Outdated Term [YouTube Video]
Later, sociologist Manual Castells (1998) added the term Fourth World to refer to stigmatized minority groups that were denied a political voice all over the globe. These groups include indigenous minority populations, prisoners, and unhoused populations.
3.3.3.2 Developed, Developing, Undeveloped
Another popular categorization applies the concept of development to nations. “Developed,” and other derivatives are used, such as “developing,” and “undeveloped.” More-developed nations have higher wealth, such as Canada, Japan, and Australia. Less-developed nations have less wealth to distribute among populations, including many countries in central Africa, South America, and some island nations.
These terms came about when the idea that richer worlds have a responsibility to provide foreign aid to the lesser-developed nations in order to raise their standard of living. Although this typology was initially popular, and is still widely used, calling nations “developed” denotes a label of superiority in comparison to developed nations. The terms imply that unindustrialized countries must improve to participate successfully in the global economy, and assumes that members of less-developed nations want to be like those who’ve attained post-industrial global power.
3.3.3.3 Wealthy, Middle-Income, and Poor Nations
Today a popular typology simply ranks nations into groups called wealthy (or high-income) nations, middle-income nations, and poor (or low-income) nations, based on measures such as gross domestic product (GDP) per capita.
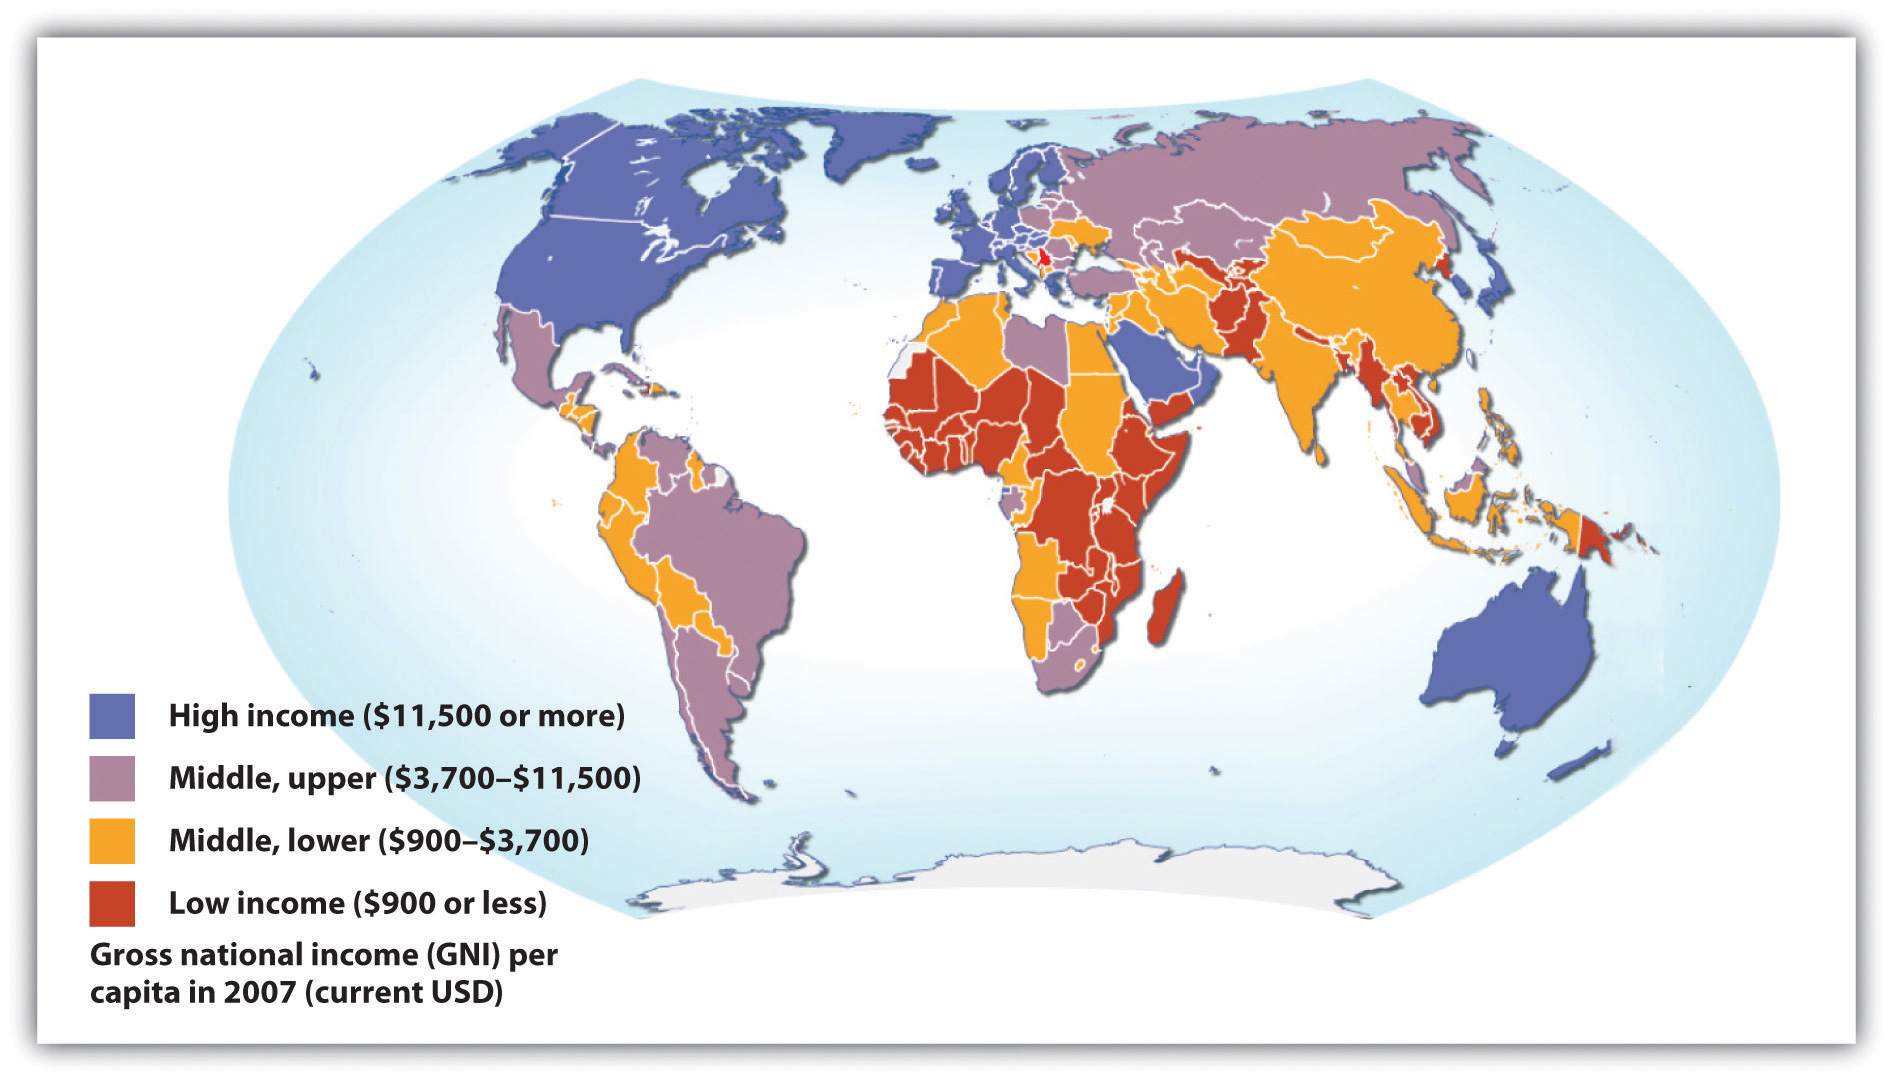
This typology has the advantage of emphasizing what many researchers consider the most important variable in global stratification: how much wealth a nation has. The other important differences among the world’s nations are considered as all stemming from their degree of wealth or poverty. Figure 3.7 “Global Stratification Map” depicts these three categories of nations (with the middle category divided into upper-middle and lower-middle).

Figure 3.7. Global Stratification Map
Categorizations based on GDP per capita or similar economic measures are very useful, but they also have a significant limitation. Nations can rank similarly on GDP per capita (or another economic measure) but still differ in other respects. One nation might have lower infant mortality, another might have higher life expectancy, and a third might have better sanitation. Recognizing this limitation, organizations such as the United Nations Development Programme (UNDP) use typologies based on a broader range of measures than GDP per capita.
While the World Bank is often criticized, both for its policies and its method of calculating data, it is still a common source for global economic data. Along with tracking the economy, the World Bank tracks demographics and environmental health to provide a complete picture of whether a nation is high income, middle income, or low income. We’ll include World Bank data here to illustrate differences between nations with this typology.
3.3.3.3.1 Wealthy Nations
The wealthy, or high income nations are the most industrialized nations. They consist primarily of the nations of North America and Western Europe; Australia, Japan, and New Zealand, and certain other nations in the Middle East and Asia. They are the leading nations in industry, high finance, and information technology and exercise political, economic, and cultural influence across the planet. As the global economic crisis that began in 2007 illustrates, when the economies of just a few wealthy nations suffer, the economies of other nations and indeed of the entire world can suffer.
Members of these nations live a much more comfortable existence than middle-income nations and, especially, poor nations. People in wealthy nations are healthier and more educated, and they enjoy longer lives. Many of these nations were the first to become industrialized starting in the 19th century, which contributed to the great wealth they enjoy today. It is also true that many Western European nations were also wealthy before they industrialized, thanks in part to the fact that as colonial powers they acquired wealth from the resources of the lands they colonized.
Although wealthy nations constitute only about one-sixth of the world’s population, they hold about four-fifths of the world’s entire wealth. At the same time, wealthy nations use up more than their fair share of the world’s natural resources, and their high level of industrialization causes them to pollute and otherwise contribute to climate change to a far greater degree than is true of nations in the other two categories.
3.3.3.3.2 Middle-Income Nations
Middle-income nations are generally less industrialized than wealthy nations but more industrialized than poor nations. They consist primarily of nations in Central and South America, Eastern Europe, and parts of Africa and Asia. They constitute about one-third of the world’s population. Many of these nations have abundant natural resources but still have high levels of poverty, partly because political and economic leaders sell the resources to business owners of wealthy nations and keep much of the income from these sales for themselves.
There is much variation in income and wealth within the middle-income category, even within the same continent. In South America, for example, the gross national income per capita in Chile is $13,270 (2008 figures), compared to only $4,140 in Bolivia (Population Reference Bureau, 2009). Not surprisingly, many more people in the latter nations live in dire economic circumstances than those in the former nations.
3.3.3.3.3 Poor Nations
Poor, or low-income nations are the least industrialized and most agricultural of all the world’s countries. They are primarily found in Asia and Africa (World Bank 2021), where most of the world’s population lives. For example, Afghanistan, Ethiopia, and Yemen are considered low-income countries. Many of these nations rely heavily on one or two crops, making them vulnerable to fluctuations in weather and global economic conditions. These nations tend to have some natural resources that political leaders sell to business owners of wealthier nations while keeping much of the income they gain from these sales.
By any standard, the majority of people in these nations live a desperate existence in very challenging physical conditions. They suffer from AIDS and other deadly diseases, live on the edge of starvation, and lack indoor plumbing, electricity, and other modern conveniences that most Americans take for granted. Women are disproportionately affected by poverty and much of the population lives in absolute poverty, when household income is so low it is impossible for individuals or families to meet basic needs of life.

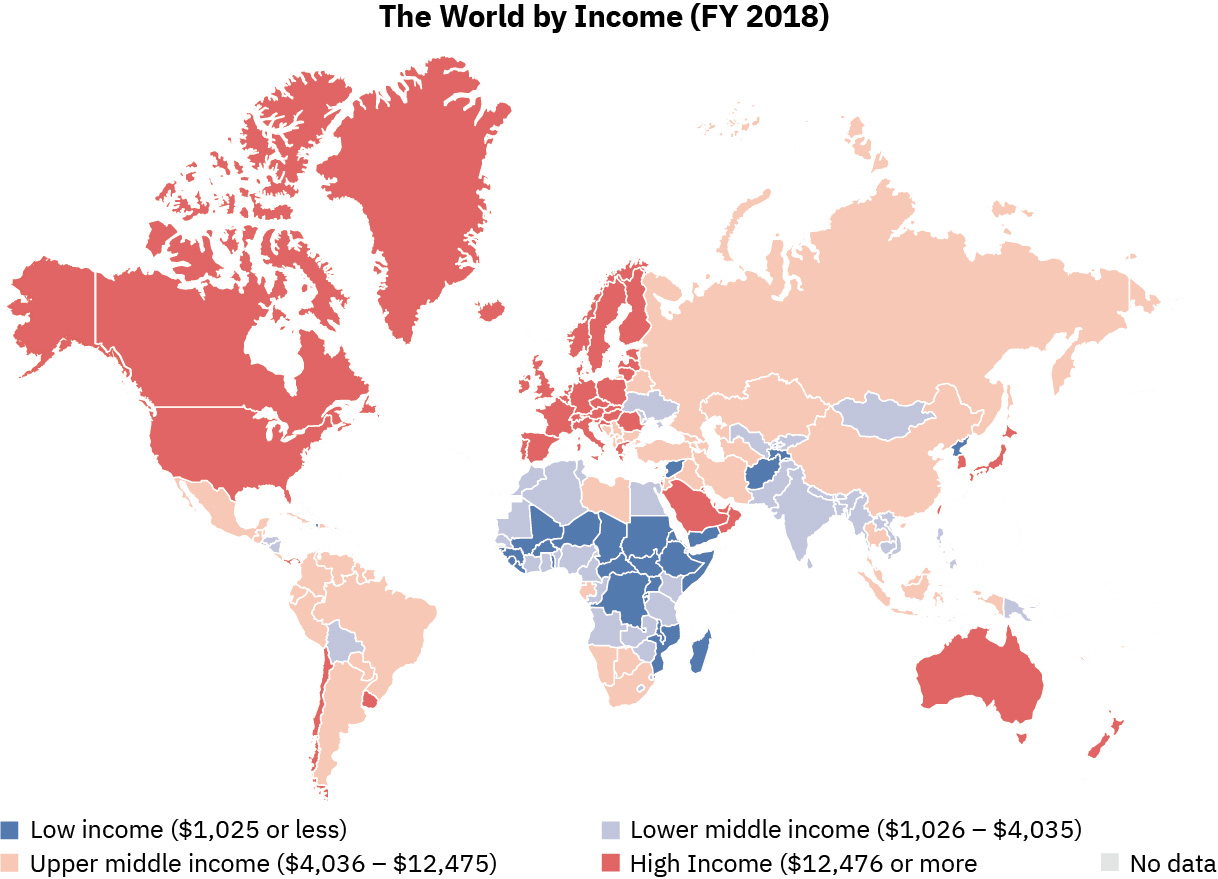
Figure 3.8. This world map shows a world map with low income, upper middle income, lower middle income and high income countries in 2018. Note that the data in this map is one year older than the data presented in the text below.
Nations’ classifications often change as their economies evolve and, sometimes, when their political positions change. Nepal, Indonesia, and Romania all moved up to a higher status based on improved economies. Sudan, Algeria, and Sri Lanka moved down a level. A few years ago, Myanmar was a low-income nation, but now it has moved into the middle-income area. With Myanmar’s 2021 coup, the massive citizen response, and the military’s killing of protesters, its economy may go through a downturn again, returning it to the low-income nation status.
3.3.4 Licenses and Attributions for Measuring Global Stratification
Intro paragraphs to Measuring Global Stratification and Economic Measures Between Countries by Aimee Samara Krouskop is licensed under CC BY 4.0.
GDP, GNP, GNI is a remix of Introduction to Sociology, Chapter 9.3 Global Stratification and Inequality, published by OpenStax and licensed under CC by 4.0
The intro section to Classification of Countries and First Second and Third Worlds is a remix of Introduction to Sociology; First Canadian Edition, Chapter 10 Global Inequality, published by BC Campus licensed under CC 4.0 International license and found here. Additions of video.
Economic Measures Within Countries and Developed, Developing, Undeveloped is a remix of Introduction to Sociology, Chapter 10.1 Global Stratification and Classification published by OpenStax licensed with CC by 4.0 and found here.
Wealthy, Middle-Income, and Poor Nations is a remix of Sociology; Understanding and Changing the Social World, Chapter 9.1 The Nature and Extent of Global Stratification, published by The University of Regina OER Publishing Program licensed with CC Attribution-NonCommercial-ShareAlike 4.0 found here: and Introduction to Sociology; First Canadian Edition Chapter 10 Global Inequality, published by BC Campus with CC Attribution 4.0 International license and found here.
Poor Nations is a remix of The Nature and Extent of Global Stratification published by the University of Minnesota, licensed with CC Attribution-NonCommercial-ShareAlike 4.0 and found here, and Sociology; Understanding and Changing the Social World, Chapter 9.1 The Nature and Extent of Global Stratification, published by The University of Regina OER Publishing Program licensed with CC Attribution-NonCommercial-ShareAlike 4.0 found here.
Figure 3.5. World regions by total wealth (in trillions USD), 2018 is published by Wikipedia and licensed with CC BY-SA 4.0 and found here
Figure 3.6. Video, “How The Term ‘Third World’ Is An Outdated Term” is published on YouTube by Maximum Impact with Jay Cameron
Figure 3.7. Global Stratification Map Source: Adapted from UNEP/GRID-Arendal Maps and Graphics Library (2009). Country income groups (World Bank classification). Retrieved from http://maps.grida.no/go/graphic/country-income-groups-world-bank-classification.
Figure 3.8. World map with low-income, upper middle income, lower middle income and high income countries in 2018 (Credit: Sbw01f, data obtained from the CIA World Factbook/Wikimedia Commons)
