
3.5 Inequality Within Nations
Although inequality between countries has generally narrowed, inequality within countries is rising as economic growth derived from globalization tends to be unevenly distributed within countries. In 2015 all of the United Nations member states adopted a 2030 Agenda for Sustainable Development. It’s a “shared blueprint for peace and prosperity for people and the planet, now and into the future.” The Agenda includes 17 Sustainable Development Goals (SDGs). Goal 10 is to “Reduce inequality within and among countries.” Let’s look at how some branches of the United Nations and other organizations identify and address internal inequality as a global concern.
3.5.1 Comparing and Measuring Inequality Within Nations
The United Nations Department of Economic and Social Affairs reports that 71 percent of the world’s population live in countries where inequality has grown (2019). Economic differences, regional differences, as well as racial differences, gender differences, and class differences are considered when calculating internal inequality. According to the UN, inequality within countries matters because “[these] are the inequalities people feel day to day, month to month, year to year. This is how people stack up and compare themselves with their neighbors, family members, and society” (United Nations 2022).
To evaluate global inequality, researchers compare internal inequality between nations. Take a look at figure 3.12. It’s a regional map that shows the top 10 and the bottom 50 income gaps across the world in 2021. Mexico, countries of Northern South America, along with much of Africa, India, several west Asian countries (e.g., Saudi Arabia, Libya) and Indonesia experience the greatest income inequality. The United States is in the second tier, experiencing the second greatest income inequality, along with Egypt and Kenya and other nations in red. While Central America, much of northern South America, Southern Africa and much of the Middle East have the greatest internal inequality.

Figure 3.12. Top 10/Bottom 50 Income gaps across the world, 2021.
3.5.2 Social Inequality
As we discussed in Chapter 2, social inequality refers to events or interactions that limit or harm a group’s social status, social class, and social circle. While researchers tend to focus on economic inequalities, social inequality is just as harmful. Stereotyping, prejudice, and discrimination (at times legally sanctioned) creates and aggravates conditions of economic inequality globally just as it does in the US.
Human rights organizations work to address these social inequalities, often applying the United Nations’s Universal Declaration of Human Rights. Let’s look at how some international human rights organizations identify and address social inequality as a global concern.
3.5.2.1 Social Inequalities, Women and Girls
Global social research has focused on gender inequalities over the last several decades, applying many tools to measure them. Figure 3.13 shows a map developed by the World Inequality Database, an online tool providing interactive, visual data about global inequality. It offers insights into gender inequality and inequality between nations based on the percentage of income shared by women. Looking at their interactive map, you can see how countries and regions differ in their share of female labor income.

Figure 3.13. Female labor income share across countries
Another way to measure gender inequality is with the Gender Inequality Index. It focuses on:
- Health
- Socio-economic resources
- Gender disparities in the household
- Gender disparities in politics
Figure 3.14 shows a snapshot of the Historical Gender Equality Index map at the World Inequality Lab site. You can see how index scores changed between 1950 and 2000 across global regions.

Figure 3.14. Historical Gender Equality Index map showing trends across global regions between 1950 and 2000.
The World Economic Forum produced a Global Gender Gap Report for 2021, in which they note that the time predicted it will take to close the gender gap has increased by a generation, from 99.5 years to 135.6 years. This gap has been exasperated by the Covid-19 pandemic (Global Gender Gap Report 2021).
3.5.3 Activity: The Girl Effect and Critique
| There are many global organizations working to bring resources to girls and bridge the gender inequities gap. Watch this pair of videos produced by the organization Girl Effect. The first, “The girl effect: The clock is ticking” is 3:04-minutes long (figure 3.15). The second, “Yegna, The Sound of All of Us” is 2:42 minutes long and tells the story of a project supported by Girl Effect in Ethiopia (figure 3.16). As you watch, consider: What social inequalities are mentioned for girls in poorer nations? And what are the solutions that the Girl Effect sees can reduce those inequalities?
Figure 3.15. The girl effect: The clock is ticking [YouTube Video] (time 3:04)
Some researchers criticize the Girl Effect. Critics assert that answers to poverty should not be sought in the earning power of impoverished adolescents, but by shifts in the systems and institutions that fuel poverty. They assert that by asking young entrepreneurs to solve societies’ biggest problems instead keeps existing systems intact. It turns girls into consumers and drives social change NGOS and girls themselves into a dependency upon the corporate world. Further, it distracts from the awareness and human rights education that is needed to make more foundational change (Hengeveld 2015). You may read more about this critique in the Al Jazeera article, Nike’s girl effect. For optional reading, see the journal article, The Girl Effect: A Neoliberal Instrumentalization of Gender Equality. Considering what you’ve learned about globalization and inequality, what are your thoughts about the Girl Effect strategy and this critique? |
3.5.3.1 Social Inequalities Based on Sexual Expression and Gender Identity
Social inequalities based on sexual expression, and between people identifying with binary or nonbinary identities are also present throughout the world. Introduced in Chapter 2, dominant assumptions of sexual expression follow binary – or heterosexual categories. Similarly, a binary system of gender identity only leaves room for two categories of gender: male and female. While people who identify as non-binary have always existed throughout the world, stigma and discrimination, as well as violence and oppression against trans and gender-diverse people are part of the story.
While this concern does not yet receive the same attention as inequalities surrounding women and girls, some organizations are tracking the issues and working to create change. For example, the organization Transrespect versus Transphobia Worldwide (TvT) documented 2,982 cases of reported killings of trans and gender-diverse people worldwide between January 2008 and September 2018. We know that these kinds of totals are low, as there are no reliable methods of capturing these crimes (Transrespect versus Transphobia Worldwide 2018).
3.5.3.2 Social Inequalities Based on Race
As part of the UN’s sustainable goals, the organization designated the years 2015-2024 as the International Decade for People of African Descent. The International Decade “aims to celebrate the important contributions of people of African descent worldwide, advance social justice and inclusion policies, eradicate racism and intolerance, promote human rights, and assist in creating better, more prosperous communities (United Nations 2021:n.p).”
Take a few minutes to browse the UN pages dedicated to the International Decade for People of African Descent. (Figure 3.17) What inequalities do you see the UN is identifying with people of African descent? What initiatives do you see the UN is working on to address inequalities with this population? “

Figure 3.17. The UN pages dedicated to the International Decade for People of African Descent.
Let’s turn to South Africa as an example of how racial discrimination affects lives in a global context. During the 1950s and until the mid 1990’s there existed “Pass Laws” in South Africa that prohibited inter-racial sex and marriage and strictly segregated residential areas, schools, trains, buses, beaches, toilets, parks, stadiums, ambulances, hospitals, and cemeteries. These laws were similar to the state and local “Jim Crow” laws in the United States that legalized racial segregation.
Enforced with police brutality, the Pass Laws served as only part of a South African’s system of apartheid, a policy or system of segregation or discrimination on grounds of race. It is one of the most extreme cases of institutionalized and legal discrimination in the world. Through decades of social movement, with many lives lost, apartheid in South Africa ended in the early 1990’s.
However, today, South Africa still experiences one of the highest levels of inequality in the world (Six Charts Explain South Africa’s Inequality 2020). One of the areas where that continued inequality is noticed, is in its apartheid-era architecture. This includes city planning that segregates communities along racial lines, and sets black townships 40 km away from town. This kind of architecture forces black South Africans to spend 40% of their income commuting, and makes it difficult for communities to develop economic and gathering opportunities.
Watch this 2:40 minute video, Apartheid Architecture that introduces Wandile Mthiyan, CEO and Co-Founder of social enterprise firm Ubuntu Design Group, (previously an Obama Foundation Fellow and One Young World Ambassador) (figure 3.18).
In the video, Mr. Mthiyan explores the science behind apartheid architecture and explains how it it continues to disenfranchise black townships and shantytown communities 26 years after apartheid was abolished. As you watch, consider: How does architecture in or near where you live support institutionalized racial segregation?
Figure 3.18. Apartheid Architecture [YouTube Video]
3.5.3.3 Social Inequalities Based on Ethnicity
As with research on nonbinary inequality, global research related to inequalities across ethnic lines have been sparse. However, some recent attention has been devoted to this topic. In 2021 the United Nations released research that examined inequality across ethnicity. Researchers found that poverty among ethnic groups is consistently high across many countries, with sometimes more than 90 percent of populations being trapped in poverty. The report highlights that in Latin America, indigenous peoples are among the poorest.
3.5.3.4 Going Deeper
In this section, we’ve explored several comparisons of inequality. The following resources support learning more:
World Inequality Database
Take a look at the tool provided by World Inequality Database (Figure 3.19) that compares where you land in the income / wealth distribution of the world. Answer about 5 questions at their comparative tool. You can choose to make comparisons of your income or wealth within the US, or within other countries. Does anything surprise you?
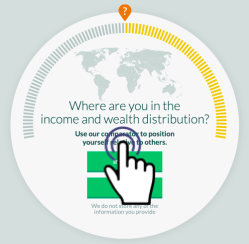
Figure 3.19. The World Inequality Database income and wealth distribution tool.
See the interactive Worldview page of the World Inequality Database for more visual global inequality data.
Gender Inequality Quiz
Take a look at Oxfam’s Gender Inequality quiz (Figure 3.20) to for a snapshot of the discrimination, violence, unequal treatment that girls and women experience in the world.
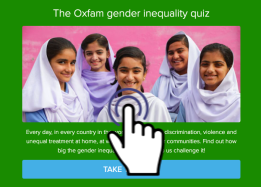
Figure 3.20. The Oxfam gender inequality quiz
Or you can read Oxfam’s summary of “Why the majority of the world’s poor are women.”
3.5.4 Licenses and Attributions for Inequality Within Nations
“Inequality Within Nations” by Aimee Samara Krouskop is licensed under CC BY 4.0.
Figure 3.12. Top 10/bottom 50 income gaps across the world, 2021 is published in Chapter 1: Global economic inequality: insights published in the World Inequality Database by World Inequality Lab licensed with xxx
Figure 313. Female labor income share across countries
Figure 3.14. Historical Gender Equality Index map showing trends across global regions between 1950 and 2000.
Figure 3.15. Video, “The girl effect: The clock is ticking” is published on YouTube by Girl Effect.
Figure 3.16. Video, “Yegna, The Sound of All of Us” is published on YouTube by Girl Effect.
Figure 3.17. Linkable image to the International Decade for People of African Descent 2015-2024 page on UN.org is published by the United Nations.
Figure 3.18. Video, Apartheid Architecture
Figure 3.19. World Inequality Database income and wealth distribution tool.
Figure 3.20. The Oxfam gender inequality quiz