
7.4 Education, Poverty, and Wealth
One of the critical questions sociologists examine when they consider education and social change is whether education actually makes a difference in the life of an individual or the quality of life in a society. To explore this, we focus specifically on money. Will an education actually make you rich? You may have seen the following chart as you were making the decision to go to college (figure 7.11):
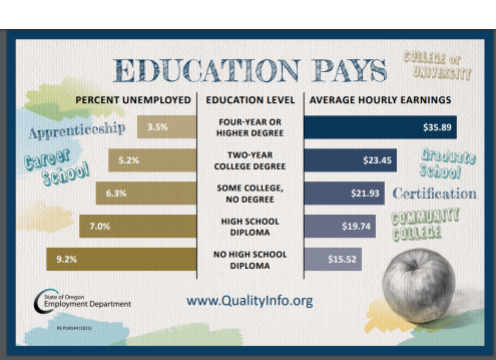
Figure 7.11. Oregon Education Pays
This chart is commonly used in Oregon high schools and state unemployment offices to show that it pays to get a college degree. Clearly, people with a four-year degree or higher experience less unemployment and significantly higher hourly earnings than people with a high school diploma. Of course, these charts trumpet, everyone should get the most education they can, so they can make enough to buy houses and take care of their families. Is this the whole picture, though? Let’s look deeper.
Over their collective lifetimes, Oregon’s population of dropouts will cost the state about $2 billion in lost taxable earnings
The following table represents annual average earnings and total annual earnings by educational attainment.
| Educational Attainment | Population | Average Annual Earnings | Lifetime Earnings | Lifetime Earnings if Dropouts become HS Grads |
|---|---|---|---|---|
| Dropouts | 218,641 | $16,785 | $3,669,932,913 | $0 |
| HS Graduates | 604,555 | $26,561 | $16,057,343,533 | $21,864,908,956 |
| Some College | 566,942 | $29,633 | $16,800,078,898 | $16,800,078,898 |
| Associate’s Degree | 210,710 | $38,548 | $8,122,428,009 | $8,122,428,009 |
| Bachelor’s Degree | 471,916 | $49,959 | $23,576,357,061 | $23,576,357,061 |
| Master’s/ PhD/ Professional | 206,917 | $74,428 | $15,400,335,709 | $15,400,335,709 |
| Total | 2,279,681 | $39,319 | $83,626,476,123 | $85,764,108,633 |
Increased earnings if all dropouts became HS Graduates: $2,137,632,510.
Source: U.S. Census Bureau, “Current Population Survey, March Supplement 2007,”data for Oregon, author’s calculations.
Figure 7.12. Costs of dropping out.
When we compare the chart in figure 7.12 to the previous one in figure 7.11, we notice that the size of each group is not comparable. When we look at all the people who have bachelor’s degrees and more we are talking about roughly 700,000 people. When we look at the populations of high school dropouts, we see only 218,641. People with associate degrees are about 200,000 people, a relatively small pool. Given the significantly different sizes of the groups, percentages and average wages may be hiding significant differences between the groups.
Second, this chart hides alternate ways of training and education. Where are the plumbers and the electricians who attend training other than college? Where are the massage therapists, acupuncturists, and other health professionals who may not attend the kinds of colleges tracked here, and yet are highly trained professionals? What about cosmetologists, hairdressers, tattoo artists, musicians and other creative workers who earn incomes often through self-employment, and are not counted in unemployment statistics?
Third, when we look at unemployment data, we are only looking at people who are eligible for unemployment, not all people, not even all people who would be in the workforce if they could find work. This data then under-reports the number of people who may be looking for work but are no longer eligible for state or federal unemployment benefits. Even though definitions of who can be considered unemployed have expanded during the COVID-19 pandemic, the overall statistics don’t tell a complete picture.
Finally, what about differences in social location? Sociologists look more deeply at this data to explore whether combinations of gender, sexual orientation, race, ethnicity, age, socioeconomic status, and neurodiversity make a difference in access to education and educational outcomes, differences that this chart obscures. To answer some of these questions with theory, data and experience, we need to introduce some sociological vocabulary.
7.4.1 Individual Improvement vs Class Improvement
A common saying for those who work to end poverty for families is “there are two ways out of poverty—education and savings.” Is this really true for all families?
Sociologists differentiate between social mobility and structural mobility. Social mobility is an individual’s or group’s (e.g., family) movement through the class hierarchy due to changes in income, occupation, or wealth. When we consider the dream of immigrants to the United States in the past and today, many say that their American Dream is to work hard so that their children can have a better life than they do. When you consider your own family history, you may notice that you have more education than your grandparents or great grandparents. Over time, individuals and families can get richer or poorer, moving between social classes. Education can contribute to social mobility.
Structural mobility is the ability of an entire class of people to become more wealthy or less wealthy. The efforts of the United Nations and other world service organizations to end extreme poverty would fall into the case of structural mobility. In general, industrialization led to a higher standard of living for many people. Many people got electricity and indoor plumbing, indicating some amount of upward structural mobility. However, global literacy and other educational measures are higher than they have ever been worldwide. If education was truly the only cause of structural mobility, we would see a reduction in poverty, and we don’t (Hanauer 2019).
7.4.2 Correlation and Causation
For that, we have to turn to two other social science concepts: correlation, and causation. Causation describes a relationship between variables in which a change in the first variable creates a change in the second variable Correlation, on the other hand, when a change in one variable coincides with a change in another variable, but does not necessarily indicate causation.
For example, sociologists might measure how many churches and grocery stores there are. They might see that where there are more churches, there are also more grocery stores. They might conclude that because many churches host potlucks, dinners, and soup kitchens there is a need for more groceries. Alternatively, they might conclude that well fed people go to church more often. However, there is a third variable at work—population. The more people live in a particular location, the more built environment there is likely to be, including schools, churches, grocery stores, and libraries. Population size drives causation, at this point, even though the number of churches and the number of grocery stores are correlated.
As we apply these concepts to education, our essential question deepens: To what extent do changes in education levels cause social or structural mobility?
7.4.3 Models of Education, Wealth, and Poverty
To answer this question, we look at this model, developed by economists from the federal reserve bank. They propose the following relationship between education and wealth in figure 7.13.

Figure 7.13. This model of education and wealth looks at the variables that increase income, improve financial decision making and lead to wealth.
There is a lot going on in this model, so let’s break it down together. In the first column, we see characteristics that influence further steps in the model. These characteristics include how smart you are, how persistent you are, your socioeconomic class, education itself, and the idea that you are likely to marry a similarly educated spouse. Not listed in the model is the idea that people from higher socioeconomic classes expect to live longer, because they have access to good medical care, so they have some incentive to do financial planning (and extra wealth in the first place, so that they can save).
All of these factors both increase income and lead to better financial decision-making. These two factors influence the acquisition of wealth—land, savings, stocks, buildings, businesses—that someone may own. This particular study concludes that it’s not education itself that directly leads to wealth. Rather, people who are wealthy already are more likely to have access to education and attain higher educational outcomes.

Figure 7.14. The impact of education is more, if you make more money in the first place.
Even when students achieve a bachelor’s education, we find that their social class impacts how much their income increases (figure 7.14). For people of all social classes, we see that people earn more as they age, presumably because they have more experience and are getting paid more for their work. However, when we look at how much of a “bump” this is, we notice that people in lower socioeconomic classes don’t see as significant an increase in their earnings. This adds evidence to the idea that while getting a college education can increase anyone’s earnings, wealthy people still benefit more.

Figure 7.15. Girls in school uniforms laughing together.
Global models, on the other hand, paint a slightly different picture. In figure 7.15 we see some young girls playing at school. The Borgen project highlights four ways in which educating women can reduce poverty. They find that educating women tends to lead to higher age at marriage and greater maternal health. Because more girls between the ages of 15–19 die from pregnancy complications than any other cause of death, increasing the age of marriage (and thus the age of first pregnancy) leads to less mother and infant mortality. A second improvement is the increase in wages that a more educated woman can expect. With more skills, a woman can look for higher paying work, reducing poverty in her family, and increasing economic stability. Third, when women make more money, they tend to spend that money on food and education for their children, strengthening the health of their entire families. Finally, educating women supports the overall health of entire communities because education allows women to be leaders in their communities (Borgen Project 2018).
When you consider, then, whether you should study for your next test, take the next class, or even go to college at all, the money that you might make can only be part of the reason.
7.4.4 Going Deeper
The United Nations examines the link between education and weath for people around the world. The model is complicated, but useful in understanding how education and economics interact. The research is: Reducing global poverty through
7.4.5 Licenses and Attributions for Education Poverty and Wealth
“Education, Poverty, and Wealth” by Kimberly Puttman is licensed under CC BY 4.0.
Figure 7.11. Oregon Education Pays
Figure 7.12 Costs of Dropping Out House, Emily. 2010. “Oregon’s High School Dropouts: Examining the Economic and Social Costs.” The Foundation for Educational Choice State Research.
Figure 7.13. https://www.stlouisfed.org/~/media/Files/PDFs/HFS/assets/Emmons-Education-and-Wealth-27Oct2015.pdf?la=en Fair Use
Figure 7.14. Bachelors Bump.
Figure 7.15. Girls in school uniforms laughing together. https://unsplash.com/photos/Jcg4Y4Zst0o
Photo by Heather Suggitt on Unsplash